BET Analysis in Catalysis: The Essential Guide to Surface Area Measurement for Drug Development
This comprehensive guide explains the Brunauer-Emmett-Teller (BET) theory and its critical application in measuring catalyst surface area for researchers, scientists, and drug development professionals.
BET Analysis in Catalysis: The Essential Guide to Surface Area Measurement for Drug Development
Abstract
This comprehensive guide explains the Brunauer-Emmett-Teller (BET) theory and its critical application in measuring catalyst surface area for researchers, scientists, and drug development professionals. We cover the foundational principles of gas adsorption, provide step-by-step methodological protocols, address common troubleshooting and data optimization challenges, and compare BET analysis to complementary characterization techniques. This article serves as a practical resource for accurate catalyst characterization in biomedical research and pharmaceutical process development.
BET Theory Fundamentals: Understanding the Science Behind Catalyst Surface Area
What is BET Analysis? Defining the Brunauer-Emmett-Teller Method
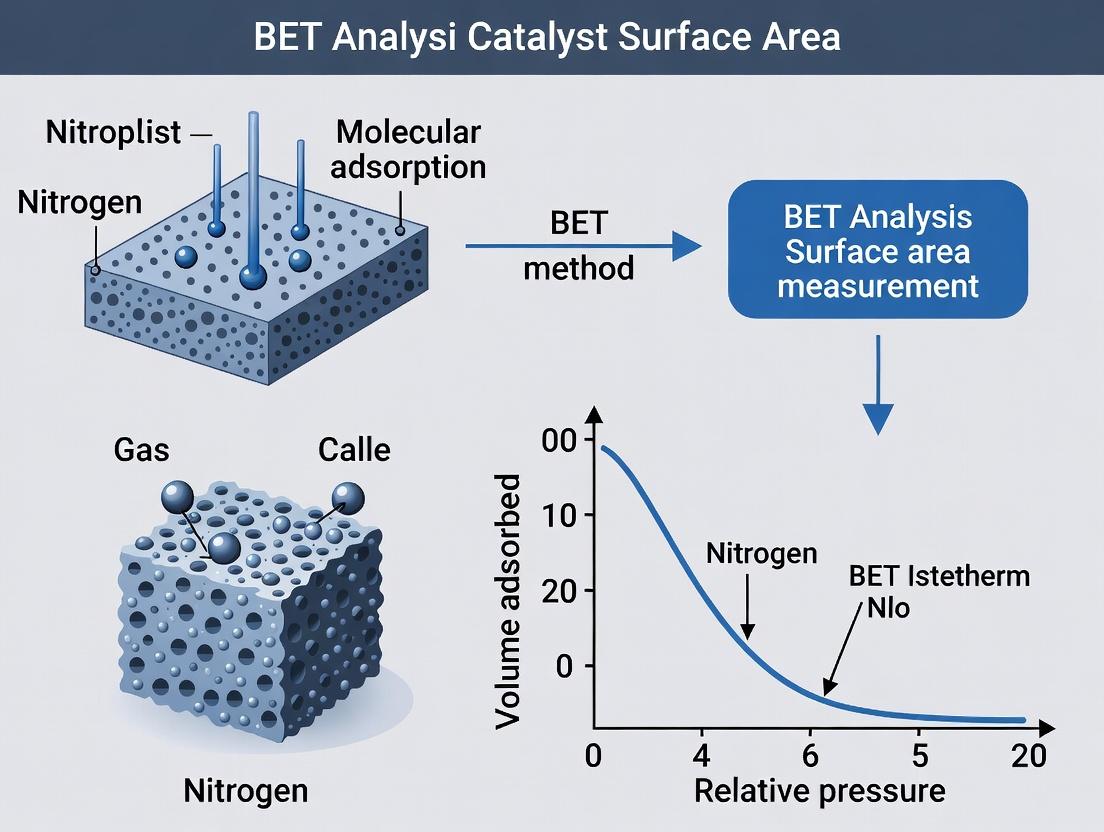
The Brunauer-Emmett-Teller (BET) analysis is a standardized procedure for determining the specific surface area of porous and particulate materials, most notably solid catalysts and pharmaceuticals, by quantifying the physical adsorption of a gas (typically nitrogen) on a solid surface. This in-depth guide frames the method within catalyst surface area measurement research, detailing its theoretical basis, modern experimental protocols, and critical data interpretation for scientific professionals.
Theoretical Foundations
The BET theory, published in 1938, extends the Langmuir monolayer adsorption model to multilayer physical adsorption. It rests on core assumptions: 1) gas molecules adsorb on a solid in infinite layers, 2) the Langmuir model applies to each layer, and 3) the heat of adsorption for the first layer is unique and higher than the heat of liquefaction for subsequent layers.
The derived linearized BET equation is: [ \frac{1}{v[(P0/P)-1]} = \frac{C-1}{vm C} \left( \frac{P}{P0} \right) + \frac{1}{vm C} ] Where:
v= Volume of gas adsorbed at STPP= Equilibrium adsorption pressureP₀= Saturation pressure of adsorbate at analysis temperaturev_m= Volume of gas required to form a monolayerC= BET constant related to adsorption enthalpy
The specific surface area (S) is calculated from v_m:
[
S = \frac{vm NA \sigma}{V{mol}}
]
Where (NA) is Avogadro's number, (\sigma) is the cross-sectional area of the adsorbate molecule (0.162 nm² for N₂ at 77 K), and (V_{mol}) is the molar volume.
Diagram: Logical Flow of BET Theory Derivation
Core Experimental Protocol
The modern BET analysis is performed using automated gas sorption analyzers.
Sample Preparation
- Degassing: A precisely weighed sample (typically 50-500 mg) is placed in a glass cell and subjected to vacuum and/or inert gas flow (e.g., N₂, He) at elevated temperature (e.g., 150-300°C for catalysts, lower for polymers) for 2-12 hours to remove adsorbed contaminants.
- Weighing: The evacuated cell is weighed to determine the outgassed sample mass.
Data Acquisition (Adsorption Isotherm)
- The sample cell is immersed in a cryogenic bath (liquid N₂ at 77 K).
- Controlled, incremental doses of adsorbate gas (N₂) are introduced.
- After each dose, the system equilibrates, and the quantity adsorbed is measured manometrically.
- The process continues until a relative pressure (P/P₀) of ~0.05-0.30 (the linear BET range) is exceeded, generating an adsorption isotherm.
Data Analysis
- Data from the linear range (P/P₀ ≈ 0.05-0.30) is fitted to the linear BET equation.
- Slope and intercept are used to solve for
v_mandC. - The specific surface area is calculated using the
v_mvalue.
Diagram: BET Analysis Experimental Workflow
Key Data & Validation
Table 1: Standard BET Analysis Parameters for N₂ at 77 K
| Parameter | Typical Value / Range | Significance |
|---|---|---|
| Adsorbate Gas | Nitrogen (N₂) | Standard probe molecule; cross-sectional area (σ) = 0.162 nm² |
| Analysis Temperature | 77 K (Liquid N₂ bath) | Ensures physical adsorption; convenient & reproducible |
| Linear BET Range (P/P₀) | 0.05 – 0.30 | Region where model assumptions are most valid |
| BET Constant (C) | 50 – 300 (ideal) | Indicator of adsorbent-adsorbate interaction strength |
| Monolayer Capacity (v_m) | Sample-dependent (cm³/g STP) | Directly proportional to total surface area |
| Specific Surface Area (S) | 0.1 m²/g to >1500 m²/g | The primary reported result |
Table 2: Common Isotherm Types (IUPAC Classification) & BET Applicability
| Type | Shape | Typical Material | Suitability for Standard BET |
|---|---|---|---|
| I | Microporous (Plateau at low P/P₀) | Zeolites, Activated Carbon | Poor; micropore filling violates assumptions. Use t-plot or NLDFT. |
| II | Sigmoidal, non-porous/macroporous | Non-porous powders (SiO₂, TiO₂) | Excellent. Clear point B (monolayer completion). |
| IV | Hysteresis loop at high P/P₀ | Mesoporous materials (MCM-41) | Good in linear region (P/P₀ < 0.3-0.4) before capillary condensation. |
| VI | Step-wise, layered adsorption | Graphitized carbon blacks | Good; distinct layer formation. |
The Scientist's Toolkit: Key Research Reagent Solutions
Table 3: Essential Materials & Reagents for BET Analysis
| Item | Function / Specification |
|---|---|
| High-Purity Adsorbate Gas | N₂ (99.999%+), Kr (for low surface area), CO₂ (for micropores). Probe molecule for surface coverage. Purity is critical to avoid contamination. |
| Cryogen | Liquid Nitrogen (77 K) or Liquid Argon (87 K). Maintains constant, low temperature for controlled physical adsorption. |
| Sample Tubes & Cells | Precision glass or metal cells with known tare volume. Must withstand vacuum and high temperature degassing. |
| Calibration & Reference Materials | Certified surface area standards (e.g., NIST 1900, alumina, carbon black). For instrument validation and quality control. |
| Degassing Station | Stand-alone or integrated unit. Provides controlled heating and vacuum/inert flow for sample preparation. |
| Vacuum Pump & Manifold | High-vacuum capable (<10⁻³ Torr). Essential for sample degassing and analyzer operation. |
| Thermal Conductivity Detector (TCD) | Used in flow-type analyzers. Measures concentration changes in carrier gas to determine adsorption amount. |
Advanced Considerations in Catalyst Research
- Micropore Analysis: Standard BET overestimates area in microporous catalysts. Complementary t-plot or NLDFT/QSDFT methods are required.
- Chemisorption vs. Physisorption: BET measures total (physical) surface area. Active metal dispersion requires selective chemisorption (H₂, CO) on reduced catalyst samples.
- Operando & In-Situ Cells: Modern developments allow surface area measurement under reaction conditions, though methodology is complex.
BET analysis remains the cornerstone of surface area characterization for catalysts, pharmaceuticals, and nanomaterials. Its reliability hinges on strict adherence to validated experimental protocols and a critical understanding of its limitations, particularly for microporous or chemically complex surfaces. When applied correctly within its valid range, it provides an indispensable, reproducible metric for correlating material structure with performance in catalytic activity, drug dissolution, and filtration efficiency.
Within catalysis research, the measurement of a solid catalyst's specific surface area is a fundamental prerequisite for understanding activity, selectivity, and deactivation. The Brunauer-Emmett-Teller (BET) theory, published in 1938, provided the first practical methodology for this critical measurement. This whitepaper details the historical journey of BET analysis from a theoretical model to an indispensable standard practice in catalyst characterization, framing its evolution within the broader thesis of its role in surface area measurement research.
Theoretical Foundations and Historical Evolution
The BET theory extended the Langmuir adsorption model (1916) for monolayer adsorption to multilayer physical adsorption on solid surfaces. Its core assumption was that the heat of adsorption for all layers beyond the first is equal to the heat of liquefaction of the adsorbate gas (typically N₂ at 77 K). The resulting BET equation is:
[ \frac{P}{V{ads}(P0 - P)} = \frac{1}{Vm C} + \frac{C - 1}{Vm C} \cdot \frac{P}{P_0} ]
Where:
- (P): Equilibrium adsorption pressure
- (P_0): Saturation pressure of the adsorbate
- (V_{ads}): Volume of gas adsorbed at STP
- (V_m): Volume of gas required for monolayer coverage
- (C): BET constant related to the adsorption energy
The linearization of this equation between (P/P0 = 0.05 - 0.30) allows the calculation of (Vm) and, using the cross-sectional area of the adsorbate molecule ((σ{N₂} = 0.162 \, nm²)), the specific surface area ((S{BET})).
Key Methodological Protocols
Protocol 1: Standard BET Surface Area Measurement via Volumetric (Manometric) Method
Objective: Determine the specific surface area of a porous catalyst via N₂ adsorption at 77 K.
Materials & Procedure:
- Sample Preparation: Pre-treat the catalyst sample (~50-200 mg) by degassing under vacuum or inert gas flow at an elevated temperature (e.g., 150-300°C for 2-12 hours) to remove physisorbed contaminants.
- Cooling: Immerse the sample cell in a liquid nitrogen bath (77 K) to achieve isothermal conditions.
- Dosing: Introduce known, incremental quantities of high-purity N₂ gas into the sample cell containing the evacuated, cooled sample.
- Equilibration: After each dose, allow the system to reach pressure equilibrium. The amount adsorbed is calculated from the pressure change using gas laws (e.g., the manometric method).
- Data Collection: Record the equilibrium pressure ((P)) and the corresponding volume adsorbed ((V{ads})) for each dose until a relative pressure ((P/P0)) of ~0.3 is reached.
- Analysis: Plot ( \frac{P/P0}{V{ads}(1 - P/P0)} ) vs. (P/P0) for the linear region. Calculate slope ((s)) and intercept ((i)).
- (Vm = \frac{1}{s + i})
- (S{BET} = \frac{Vm \cdot NA \cdot σ{N₂}}{m{sample}} ) where (NA) is Avogadro's number and (m{sample}) is the sample mass.
Data Presentation: Evolution of BET Analysis Standards
Table 1: Key Quantitative Developments in BET Theory and Practice
| Year | Development | Key Parameter/Standard | Impact on Catalysis |
|---|---|---|---|
| 1938 | Publication of BET Theory (Brunauer, Emmett, Teller) | Multilayer adsorption model | Provided the first theoretical framework for surface area measurement beyond monolayers. |
| 1940s-50s | Commercialization of early adsorption instruments | Use of N₂ at 77 K as standard adsorbate | Enabled routine laboratory measurement, linking catalyst porosity to performance. |
| 1985 | IUPAC Adsorption Isotherm Classification | Definition of Type II (non-porous/macroporous) & IV (mesoporous) isotherms | Standardized interpretation of physisorption data for pore structure analysis. |
| 2015 | IUPAC Technical Report on Physisorption | Recommends (P/P_0) range of 0.05-0.30 for linear BET region | Clarified best practices to avoid overestimation on microporous materials. |
| 2020s | Advanced DFT and NLDFT Methods | Pore size distribution from adsorption isotherms | Complemented BET area with detailed pore network analysis for catalyst design. |
Table 2: Typical BET Surface Areas of Common Catalyst Classes
| Catalyst Class | Typical BET Range (m²/g) | Common Support/Precursor | Primary Application Context |
|---|---|---|---|
| Heterogeneous Metal Catalysts (e.g., Pt/Al₂O₃) | 100 - 300 | γ-Alumina, Silica | Automotive exhaust, petroleum refining |
| Zeolites | 400 - 800 | Microporous aluminosilicates | Acid-catalyzed reactions (cracking, isomerization) |
| Activated Carbon | 800 - 1500+ | Carbonaceous materials | Adsorption, support for liquid-phase reactions |
| Metal-Organic Frameworks (MOFs) | 1000 - 6000+ | Coordination polymers | Gas storage, selective catalysis |
| Bulk Metal Oxides (e.g., V₂O₅, TiO₂) | 5 - 50 | Precipitated or fused oxides | Selective oxidation reactions |
The Scientist's Toolkit: Research Reagent Solutions
Table 3: Essential Materials for BET Surface Area Analysis
| Item/Reagent | Function / Role in Experiment |
|---|---|
| High-Purity (≥99.999%) N₂ Gas | Primary adsorbate; its consistent molecular cross-section (0.162 nm²) is the basis for area calculation. |
| Liquid N₂ or He Cryostat | Maintains constant 77 K temperature for N₂ adsorption, ensuring reproducible isothermal conditions. |
| High-Vacuum System (<10⁻³ mbar) | Essential for effective sample degassing to clean the surface prior to analysis. |
| Reference (Non-Porous) Standard (e.g., Alumina) | Calibrates instrument volume and validates experimental protocol accuracy. |
| Ultrahigh-Purity He Gas | Used for dead volume measurement (free space calibration) within the sample cell. |
| Sample Tube with Sealable Connector | Holds catalyst sample, withstands vacuum, and connects to the analysis manifold. |
Visualizing the BET Analysis Workflow and Context
Diagram Title: The BET Analysis Thesis and Workflow
Diagram Title: Experimental Protocol for BET Measurement
This technical guide elucidates the core physical principles underpinning the Brunauer-Emmett-Teller (BET) theory, the cornerstone of surface area analysis for porous materials. Framed within the broader thesis of "What is BET analysis in catalyst surface area measurement research," this document provides researchers with a rigorous examination of physisorption energetics, the critical concept of monolayer formation, and the derivation and application of the BET isotherm. The content is tailored for applied researchers in catalysis, materials science, and pharmaceutical development who require a deep understanding of the methodology's foundations, assumptions, and practical implementation.
Fundamental Principles
Physisorption
Physisorption (physical adsorption) is a weak, reversible interaction between a solid surface and an adsorbate gas molecule, primarily driven by van der Waals forces (London dispersion, dipole-induced dipole). It is non-specific, exothermic, and results in multilayer formation at conditions near the adsorbate's condensation point.
Key Characteristics:
- Adsorption Enthalpy: Typically 5–50 kJ/mol, close to the enthalpy of condensation.
- Reversibility: Complete desorption upon reduction of pressure or increase in temperature.
- No Activation Energy: Fast kinetics with minimal barrier to adsorption/desorption.
Monolayer Coverage (Vm)
The monolayer capacity (Vm) is the volume of adsorbate gas (at STP) required to form a single, complete molecular layer over the entire accessible surface of the solid. It is the central quantitative parameter from which the total specific surface area is calculated. Accurate determination of Vm is the primary objective of BET analysis.
The BET Isotherm Theory
The BET theory (1938) extends the Langmuir model for localized, monolayer adsorption to account for multilayer physisorption. Its core assumptions are:
- Adsorption occurs on energetically homogeneous sites.
- No lateral interactions between adsorbed molecules.
- The heat of adsorption for the first layer (E₁) is unique.
- For all subsequent layers, the heat of adsorption is equal to the enthalpy of liquefaction (E_L) of the adsorbate.
The derived BET equation is: [ \frac{P}{V(P0 - P)} = \frac{1}{Vm C} + \frac{C - 1}{Vm C} \cdot \frac{P}{P0} ] Where:
- P: Equilibrium pressure.
- P₀: Saturation vapor pressure of adsorbate at analysis temperature.
- V: Volume of gas adsorbed at STP.
- V_m: Monolayer capacity.
- C: BET constant, related to the net heat of adsorption: ( C ≈ \exp(\frac{E1 - EL}{RT}) ).
Table 1: Common Adsorbates for BET Surface Area Analysis
| Adsorbate | Cross-sectional Area (Ų/molecule) | Typical Analysis Temperature (K) | Primary Application |
|---|---|---|---|
| Nitrogen (N₂) | 16.2 | 77 (liquid N₂ bath) | Standard for high-surface-area materials (e.g., catalysts, zeolites). |
| Krypton (Kr) | 20.2 (often 21.5 used) | 77 (liquid N₂ bath) | Low-surface-area materials (< 1 m²/g, e.g., dense ceramics, some APIs). |
| Argon (Ar) | 14.2 (on oxides) / 16.6 (on carbon) | 77 or 87 (liquid Ar bath) | Alternative to N₂, avoids quadrupole moment issues; useful for microporous materials. |
| Carbon Dioxide (CO₂) | 17.0 (at 273K) | 273 (ice-water bath) | Ultramicropore (<0.7 nm) characterization. |
Table 2: BET C-Constant Interpretation
| Range of C Value | Implication for Adsorbent-Adsorbate Interaction |
|---|---|
| C < 10 | Weak interaction, often leading to unreliable isotherms for BET analysis. |
| 10 < C < 100 | Moderate to strong interaction. Ideal range for reliable BET application (Type II/IV isotherms). |
| C > 100 | Very strong interaction, often indicative of microporous materials where the BET model is applied with caution. May signify chemisorption components. |
Experimental Protocol for BET Surface Area Measurement
Standard Operating Procedure for N₂ Physisorption at 77 K
1. Sample Preparation (Degassing/Outgassing):
- Purpose: Remove pre-adsorbed contaminants (water, vapors) from the sample surface and open pores without altering the surface structure.
- Protocol: A precisely weighed sample (typically 50-200 mg) is placed in a pre-cleaned analysis tube. It is connected to a degassing station and heated under vacuum or flowing inert gas. Temperature and time are set based on sample stability (e.g., 150°C for 6-12 hours for many metal oxides; 70°C for 2-4 hours for heat-sensitive pharmaceuticals). The sample is then cooled to room temperature under vacuum, sealed, and weighed for final mass before analysis.
2. Data Acquisition (Isotherm Measurement):
- Principle: Measure the quantity of N₂ gas adsorbed/desorbed as a function of relative pressure (P/P₀) at 77 K.
- Protocol: The degassed sample tube is transferred to the analysis port of a volumetric or gravimetric sorption analyzer. The sample is immersed in a liquid nitrogen bath (77 K). Precisely controlled doses of high-purity N₂ are introduced. After each dose, the system equilibrates, and the adsorbed volume (V_ads) is calculated from pressure change (volumetric) or mass change (gravimetric). This is repeated across the relative pressure range, typically from ~10⁻⁷ to 0.995 P/P₀, to generate the adsorption branch. Desorption is measured by systematically reducing the pressure.
3. Data Analysis (BET Transformation):
- Purpose: Determine the monolayer capacity (V_m) from the adsorption isotherm data.
- Protocol: a. Select the linear region of the BET plot. The IUPAC recommends using the range where ( P/P0 ) results in ( n(1-P/P0) ) increasing with ( P/P0 ). For many materials, this is 0.05 ≤ P/P₀ ≤ 0.30. b. Plot ( \frac{P/P0}{V(1 - P/P0)} ) vs. ( P/P0 ) using data points within the selected range. c. Perform linear regression. The slope (( s )) and intercept (( i )) are used to calculate: [ Vm = \frac{1}{s + i}, \quad C = \frac{s}{i} + 1 ] d. Calculate the specific surface area (SBET): [ S{BET} = \frac{Vm \cdot NA \cdot \sigma}{m \cdot V{molar}} ] Where ( NA ) is Avogadro's number, ( \sigma ) is the adsorbate cross-sectional area, ( m ) is sample mass, and ( V{molar} ) is the molar volume of gas at STP.
Visualizations
Title: BET Surface Area Analysis Workflow
Title: Logical Relationship of Core BET Principles
The Scientist's Toolkit: Research Reagent Solutions & Essential Materials
Table 3: Essential Materials for BET Physisorption Analysis
| Item | Function & Specification | Critical Notes for Researchers |
|---|---|---|
| High-Purity Adsorbate Gas | Source of probe molecules (e.g., N₂, Kr, Ar). Purity > 99.999% (5.0 grade) is standard to prevent contamination of surfaces and analyzer. | Impurities (e.g., water, hydrocarbons) can block pores and skew results. Use in-line filters/cleaners. |
| Cryogenic Fluid | Maintains constant analysis temperature (e.g., Liquid N₂ for 77 K, Liquid Ar for 87 K). | Dewar quality and fill level stability are crucial for isotherm reproducibility. |
| Sample Tubes & Fittings | Contain the sample during degassing and analysis. Made of borosilicate glass or stainless steel with standard connectors. | Must be scrupulously clean, dry, and of known "dead volume" for accurate dosing calculations. |
| Degas Station | Prepares the sample by applying heat under vacuum or inert flow to remove surface contaminants. | Temperature control and vacuum capability (<10⁻² mbar) are key. Must avoid sintering or melting the sample. |
| Reference Material | Certified standard with known surface area (e.g., NIST RM 1898, alumina powder). | Used for periodic validation and calibration of the entire analyzer system. |
| Calibration Doses (Bulbs) | Precisely known volumes within the analyzer for volumetric gas dosing. | System calibration with non-adsorbing gases (e.g., He) is required to determine these volumes accurately. |
| Micromeritics ASAP 2460 or Equivalent | Modern automated physisorption analyzer. Performs degassing, dosing, pressure measurement, and data collection. | Represents the state-of-the-art platform for high-throughput, precise BET measurements. |
Why Surface Area Matters in Catalysis for Drug Synthesis and Development
The development of efficient and selective catalytic processes is paramount in pharmaceutical synthesis, where molecule complexity demands high precision. A catalyst's performance is intrinsically linked to its accessible surface area, which dictates the number of active sites available for reactant adsorption and transformation. This guide frames the critical role of surface area within the context of catalyst characterization via Brunauer-Emmett-Teller (BET) analysis, a cornerstone technique in heterogeneous catalysis research.
The BET Thesis: Quantifying the Accessible Landscape
The Brunauer-Emmett-Teller (BET) theory provides the fundamental framework for measuring the specific surface area of porous materials. It extends the Langmuir monolayer adsorption model to multilayer physical adsorption of gas molecules (typically N₂ at 77 K) on solid surfaces. The derived BET equation allows for the calculation of the monolayer capacity, which, combined with the cross-sectional area of the adsorbate molecule, yields the total specific surface area (m²/g).
For catalysts used in Active Pharmaceutical Ingredient (API) synthesis—such as supported metal catalysts (Pd/C, Pt/Al₂O₃), zeolites, or metal-organic frameworks (MOFs)—this value is not merely a number. It is a direct proxy for potential catalytic activity, influencing reaction kinetics, selectivity, and catalyst loading efficiency.
Key BET Analysis Data for Common Catalytic Materials
Table 1: BET Surface Area and Performance Metrics for Catalysts in Drug Synthesis
| Catalyst Type | Typical BET Surface Area (m²/g) | Common Drug Synthesis Application | Impact of Higher Surface Area |
|---|---|---|---|
| Activated Carbon (Support) | 500 - 1500 | Hydrogenation, debenzylation | Higher metal dispersion, increased reaction rate. |
| Mesoporous Silica (e.g., SBA-15) | 600 - 1000 | Heterogeneous acid catalysis, immobilization | More sites for functionalization & reactant access. |
| Metal-Organic Frameworks (MOFs) | 1000 - 7000 | Asymmetric catalysis, tandem reactions | Exceptional substrate uptake & confined active sites. |
| Zeolites (e.g., H-BEA) | 300 - 800 | Shape-selective alkylation, isomerization | Enhanced shape selectivity & acid site availability. |
| Platinum on Alumina (Pt/Al₂O₃) | 50 - 300 (metal area) | Nitro group reduction, aromatic hydrogenation | Improved metal utilization and turnover frequency. |
Experimental Protocol: BET Surface Area Analysis
Objective: To determine the specific surface area of a heterogeneous catalyst sample via N₂ physisorption using the BET method.
Principle: Measure the volume of nitrogen gas adsorbed onto the catalyst surface at the boiling point of liquid nitrogen (77 K) across a range of relative pressures (P/P₀).
Procedure:
- Sample Preparation (~6-12 hours):
- Weigh 50-200 mg of catalyst sample into a pre-weighed analysis tube.
- Degas: Subject the sample to vacuum (<10⁻³ mbar) and elevated temperature (typically 150-300°C, depending on material stability) to remove adsorbed contaminants (water, volatiles). Degassing continues until a stable outgassing rate is achieved.
Analysis Setup:
- Immerse the sample tube in a liquid nitrogen dewar (77 K).
- Connect to an automated gas sorption analyzer (e.g., Micromeritics ASAP, Quantachrome Autosorb).
Adsorption Isotherm Measurement (~4-8 hours):
- The instrument introduces controlled doses of high-purity N₂ gas into the sample cell.
- After each dose, the system equilibrates, and the quantity of gas adsorbed is measured manometrically.
- This process is repeated across a relative pressure (P/P₀) range of 0.05 to 0.30, the optimal range for BET theory application.
Data Processing & BET Calculation:
- Plot the adsorption data as an isotherm (Quantity Adsorbed vs. Relative Pressure).
- Apply the BET transformation to the linear region (typically 0.05-0.30 P/P₀):
(P/P₀) / [V(1 - P/P₀)] = 1/(V_m * C) + (C - 1)(P/P₀)/(V_m * C)where V is adsorbed volume, V_m is monolayer capacity, and C is the BET constant. - From the slope and intercept of the linear plot, calculate V_m.
- Calculate Specific Surface Area (S):
S = (V_m * N * σ) / (m * V_molar)where N is Avogadro's number, σ is the cross-sectional area of N₂ (0.162 nm²), m is sample mass, and V_molar is molar volume.
The Scientist's Toolkit: Research Reagent Solutions for Catalyst Synthesis & BET Analysis
Table 2: Essential Materials for Catalyst Preparation and Surface Area Characterization
| Item | Function & Rationale |
|---|---|
| High-Purity Silica/Alumina Supports | Provide a high-surface-area, inert scaffold for anchoring active metal sites. |
| Metal Precursors (e.g., PdCl₂, H₂PtCl₆) | Source of catalytically active metal for impregnation onto supports. |
| Liquid Nitrogen (77 K) | Provides the constant temperature bath required for controlled N₂ phasisorption. |
| Ultra-High Purity (UHP) Nitrogen Gas | The adsorbate gas; purity >99.999% prevents contamination of catalyst surfaces. |
| UHP Helium Gas | Used for dead volume calibration and as a non-adsorbing carrier gas. |
| Micropore/Mesopore Reference Material | Certified standard (e.g., NIST alumina) for instrument validation and method calibration. |
| Sample Cells & Degassing Stations | Specialized glassware for holding samples and preparing them under vacuum and heat. |
Visualizing the Workflow: From Analysis to Application
Diagram 1: Catalyst Development and BET Analysis Workflow (80 chars)
Diagram 2: BET Multilayer Adsorption Model on Catalyst (78 chars)
In conclusion, BET surface area analysis provides the indispensable quantitative foundation for rational catalyst design in pharmaceutical development. By correlating the measured surface area with catalytic performance in key bond-forming steps, researchers can optimize materials for higher yield, superior selectivity, and more sustainable drug manufacturing processes.
Within the framework of BET (Brunauer-Emmett-Teller) theory for catalyst surface area analysis, three derived parameters are paramount for characterizing porous materials: Specific Surface Area (SBET), Pore Size Distribution, and Total Pore Volume. This whitepaper provides an in-depth technical guide on these metrics, detailing their significance in catalysis and drug development, experimental protocols for their determination, and current data trends.
BET analysis is the cornerstone technique for measuring the specific surface area of solid catalysts by quantifying nitrogen gas adsorption at cryogenic temperatures. However, a comprehensive material characterization extends beyond the BET surface area value. The pore architecture—defined by pore size, volume, and distribution—critically governs mass transport, reaction kinetics, active site accessibility, and drug loading/release profiles. This document dissects these key parameters that are extracted from the same gas sorption experiments used for BET analysis.
Core Parameter Definitions & Significance
Specific Surface Area (SBET)
- Definition: The total surface area per unit mass of material (m²/g), calculated from nitrogen adsorption data using the BET equation within a relative pressure (P/P₀) range of 0.05–0.30.
- Significance: Directly correlates with the potential number of active sites. Higher SBET generally indicates greater capacity for catalytic reactions or drug adsorption.
Pore Size
- Definition: The width or diameter of pores, classified by IUPAC as micropores (< 2 nm), mesopores (2–50 nm), and macropores (> 50 nm).
- Significance: Pore size dictates which molecules can enter and diffuse through the material. It is critical for shape-selective catalysis (e.g., zeolites) and controlling the release rate of active pharmaceutical ingredients (APIs).
Total Pore Volume
- Definition: The cumulative volume of all pores per gram of material (cm³/g), typically estimated from the amount of nitrogen adsorbed at a high relative pressure (P/P₀ ≈ 0.95–0.99).
- Significance: Indicates the total capacity for adsorbate uptake. In drug delivery, it relates to the maximum payload of an API.
Table 1: Typical Parameter Ranges for Common Porous Materials
| Material Class | Typical SBET (m²/g) | Dominant Pore Size Range | Typical Total Pore Volume (cm³/g) | Primary Application |
|---|---|---|---|---|
| Microporous Zeolites | 400 - 800 | < 2 nm (Micropores) | 0.15 - 0.30 | Acid Catalysis, Molecular Sieves |
| Mesoporous Silica (e.g., MCM-41) | 800 - 1200 | 2 - 10 nm (Mesopores) | 0.70 - 1.20 | Catalyst Support, Drug Delivery Vector |
| Activated Carbons | 900 - 2000 | Micropores & Mesopores | 0.50 - 1.50 | Adsorption, Purification |
| Metal-Organic Frameworks (MOFs) | 1500 - 6000 | Micropores & Mesopores | 0.50 - 2.50 | Gas Storage, Catalysis |
| Pharmaceutical Excipient (e.g., Mesoporous Silica) | 200 - 500 | 5 - 30 nm (Mesopores) | 0.40 - 1.00 | API Amorphization & Delivery |
Table 2: Impact of Parameter Variation on Performance
| Parameter | Increase Effect on Catalysis | Increase Effect on Drug Delivery |
|---|---|---|
| Specific Surface Area | Increased active site density; potential for higher activity. | Increased capacity for API loading. |
| Pore Size | Altered selectivity and diffusion rates; may reduce site density. | Controls API release kinetics and molecular size compatibility. |
| Total Pore Volume | May improve capacity for reactant/product storage. | Directly increases total possible API payload. |
Detailed Experimental Protocols
Protocol: Multipoint BET Surface Area Analysis
- Sample Preparation: ~50-200 mg of sample is degassed under vacuum or flowing inert gas at an elevated temperature (e.g., 150-300°C for 3-12 hours) to remove physisorbed contaminants.
- Cooling: The sample cell is immersed in a bath of liquid nitrogen (77 K).
- Controlled Dosing: Precise doses of nitrogen gas are introduced into the sample.
- Pressure Measurement: The equilibrium pressure is measured after each dose.
- Data Collection: The volume of nitrogen adsorbed is plotted versus relative pressure (P/P₀).
- Calculation: Data points in the linear P/P₀ range (0.05-0.30) are fitted to the BET equation:
1/(V[(P₀/P)-1]) = (C-1)/(V<sub>m</sub>C) * (P/P₀) + 1/(V<sub>m</sub>C). The slope and intercept yield Vm (monolayer volume), from which SBET is calculated.
Protocol: Pore Size Distribution via BJH/KDFT Methods
- Full Isotherm: Extend the adsorption measurement up to near-saturation pressure (P/P₀ ≈ 0.99).
- Desorption Branch: Record the desorption isotherm as pressure is reduced.
- Model Application:
- For mesopores (2-50 nm), the Barrett-Joyner-Halenda (BJH) method is commonly applied to the desorption branch, using the Kelvin equation to relate capillary condensation pressure to pore radius.
- For micropores (< 2 nm), Non-Local Density Functional Theory (NLDFT) or Quenched Solid DFT (QSDFT) models are used on the adsorption branch, providing more accurate size distributions based on statistical mechanics.
Visualizations
Diagram 1: Gas Sorption Analysis Workflow (64 chars)
Diagram 2: Parameter Impact on Applications (72 chars)
The Scientist's Toolkit: Research Reagent Solutions
Table 3: Essential Materials for Gas Sorption Analysis
| Item | Function | Key Considerations |
|---|---|---|
| High-Purity N₂ Gas (99.999%) | Primary adsorbate for analysis at 77 K. | Purity is critical to prevent contamination of the sample surface. |
| Liquid N₂ Dewar | Provides constant 77 K temperature bath for sample cell. | Must maintain adequate level throughout long experiment. |
| He Gas (99.999%) | Used for dead volume calibration and as inert carrier gas. | Essential for accurate volume calculations. |
| Sample Tubes | Hold the solid sample during degassing and analysis. | Must be precisely sized and calibrated for volume. |
| Degas Station | Heats sample under vacuum/inert flow to clean the surface. | Temperature must be material-specific to avoid degradation. |
| Porosimetry Reference Material | Certified standard (e.g., alumina, silica) with known surface area/pore size. | Used for instrument calibration and validation. |
| Micropore & Mesopore DFT/Kernel Files | Model files for NLDFT/QSDFT analysis software. | Must match adsorbate (N₂) and assumed pore geometry (e.g., cylindrical, slit). |
Conducting BET Analysis: Step-by-Step Protocol and Data Interpretation
Sample Preparation Best Practices for Catalytic Materials and Supports
Within the broader thesis on What is BET analysis in catalyst surface area measurement research, it is paramount to understand that the accuracy and reproducibility of Brunauer-Emmett-Teller (BET) surface area data are fundamentally contingent upon meticulous sample preparation. The measured surface area is not an intrinsic property but a reflection of the material's state after preparation and pre-treatment. Inadequate preparation can lead to erroneous conclusions regarding catalytic activity, support dispersion, and structure-property relationships. This guide details best practices to ensure samples are prepared in a manner that yields reliable, meaningful BET data.
Core Principles of Sample Preparation
The primary goals of sample preparation for BET analysis are:
- Removal of Contaminants: Elimination of adsorbed water, atmospheric gases, and residual precursors or solvents that occupy active surface sites.
- Preservation of Native Structure: Avoiding thermal, chemical, or mechanical alteration of the material's pore structure and surface morphology.
- Achieving Representative Sampling: Ensuring the analyzed aliquot accurately reflects the bulk material's properties.
Degassing and Pre-Treatment Protocols
Degassing is the most critical step prior to BET analysis. Its purpose is to clean the surface without sintering or altering the structure.
Detailed Methodology:
- Sample Mass: Weigh an appropriate mass into a clean, pre-weighed analysis tube. Typical mass ranges are provided in Table 1.
- Outgassing Temperature: Determine the optimal temperature. As a rule, use a temperature 50°C above the expected operational temperature of the catalyst but below its Tammann temperature (typically 0.3 x melting point in Kelvin for supported metals, or the support's phase transition temperature).
- Outgassing Duration: A minimum of 3 hours is standard, but 6-12 hours (or overnight) is recommended for microporous materials or those with strong chemisorbed species.
- Outgassing Environment: Apply a dynamic vacuum (<10⁻² Torr) or a flow of pure, dry inert gas (e.g., N₂, Ar). Heating under flowing gas is often preferred for metals prone to reduction under vacuum.
- Cool-down: Cool the sample to ambient temperature under continuous vacuum or inert gas flow to prevent re-adsorption.
Table 1: Recommended Degassing Conditions for Common Catalytic Materials
| Material Type | Example | Typical Sample Mass (mg) | Recommended Outgassing Temp. (°C) | Minimum Time (hrs) | Special Considerations |
|---|---|---|---|---|---|
| High-Surface-Area Oxide | γ-Al₂O₃, SiO₂ | 50 - 200 | 200 - 300 | 6 | Remove physisorbed water. Avoid temps causing phase change. |
| Microporous Zeolite | ZSM-5, Zeolite Y | 50 - 150 | 300 - 400 | 12 | Thorough removal of template residues and H₂O from micropores. |
| Activated Carbon | Powder, pellets | 50 - 100 | 150 - 200 | 6 | High vacuum essential. High temps can alter surface functional groups. |
| Supported Metal | Pt/Al₂O₃, Ni/SiO₂ | 100 - 300 | 150 - 250 | 3 - 6 | Use inert gas flow to prevent autoreduction of metal precursors. |
| Metal Oxides (Reducible) | CeO₂, TiO₂ | 100 - 200 | 150 - 200 | 3 | Vacuum may cause partial reduction. Consider inert gas purge. |
Grinding and Pelletization
For coarse or pelleted catalysts, particle size reduction may be necessary to expedite degassing.
Detailed Methodology:
- Gentle Grinding: Use an agate mortar and pestle to gently break up aggregates. Avoid excessive force that may destroy pore structures (especially for zeolites).
- Sieving: Pass the ground material through a standard sieve (e.g., 60-80 mesh) to obtain a uniform particle size fraction. This improves packing in the analysis tube and degassing uniformity.
- Pelletization (Alternative): For fragile structures, consider making a self-supporting thin wafer under low pressure (< 1 ton) and then crushing it lightly to produce uniform-sized chips.
The Sample Preparation Workflow for BET Analysis
The following diagram illustrates the logical decision pathway for preparing a catalytic sample.
Diagram Title: Catalyst Prep Workflow for BET Analysis
Handling Air-Sensitive and Pyrophoric Materials
Some catalysts (e.g., reduced metals, organometallics) require special handling.
Detailed Methodology (Glovebox Technique):
- Transfer: Load the sample into the analysis tube inside an argon/vacuum glovebox (O₂ & H₂O < 1 ppm).
- Sealing: Use a tube with a removable seal (e.g., a Swedgelok fitting with a septum or a valve).
- Transport: Seal the tube inside the glovebox. Transfer to the degassing station using an airtight transfer vessel or attach it directly to the degassing port without air exposure.
- Degas: Connect under inert purge. Degas at a lower temperature if necessary to prevent structural change.
The Scientist's Toolkit: Essential Research Reagent Solutions & Materials
Table 2: Key Materials for Catalyst Sample Preparation
| Item | Function & Explanation |
|---|---|
| Analysis Tubes (with bulb) | High-precision glassware designed for the specific analyzer. Pre-weighed to allow accurate sample mass determination after filling. |
| High-Vacuum Degassing Station | Apparatus combining a heating jacket, a high-vacuum pump (turbo or diffusion), and pressure gauges. Crucial for creating the ultra-clean surfaces required for accurate physisorption. |
| Flow Degassing Unit | Alternative to vacuum, uses a continuous flow of ultra-pure (99.999%) dry nitrogen or helium. Preferred for materials that may decompose or reduce under vacuum. |
| Agate Mortar & Pestle | Chemically inert and extremely hard. Used for gentle grinding without introducing metallic contaminants that could affect surface chemistry. |
| Standard Test Sieves (SS) | Used to obtain a uniform particle size fraction (e.g., 60-80 mesh/250-180 µm). Ensures consistent packing and reduces inter-particle diffusion limitations during degassing and analysis. |
| Micropipettes & Funnels | For clean transfer of powdered samples into the narrow analysis tubes, minimizing spillage and loss. |
| Tube Seals (Valves or Caps) | Maintain sample integrity after degassing. Septum-sealed caps allow for needle-based introduction of analysis gas without air exposure. |
| Ultra-High Purity Gases | N₂ (99.999%) & Ar (99.999%): For flow degassing. He (99.999%): Often used for dead volume calibration. N₂ (99.999%) or Kr: The standard adsorbates for BET surface area measurement. |
| Calibrated Microbalance | Capable of measuring to 0.01 mg. Essential for accurately determining the mass of the degassed sample, which is the denominator in all surface area calculations. |
| Desiccator | For short-term storage of samples after degassing, containing a desiccant like P₂O₅ or molecular sieves, to prevent moisture re-adsorption. |
Data Integrity and Reporting
Always document the complete preparation protocol alongside BET results:
- Exact outgassing temperature and duration.
- Degassing method (vacuum level or gas flow rate).
- Sample mass used for analysis.
- Any pre-treatment (drying, calcination) prior to degassing.
In conclusion, rigorous adherence to these sample preparation best practices is not merely a procedural step but the foundation upon which valid BET surface area data—and by extension, meaningful catalyst characterization—is built. Within the thesis of BET analysis research, it establishes the critical link between the measured adsorbed volume and the true, accessible surface area of the catalytic material.
The determination of a catalyst's specific surface area via the Brunauer-Emmett-Teller (BET) method is a cornerstone of materials characterization. This analysis is fundamentally dependent on the accurate acquisition and interpretation of gas adsorption-desorption isotherms. The isotherm is a graphical representation of the quantity of gas adsorbed onto a solid surface at a constant temperature across a range of relative pressures. This whitepaper details the precise experimental protocols for obtaining these isotherms, the critical points for their analysis, and their direct role in deriving the BET surface area, a key parameter in catalyst and drug delivery system research.
Core Principles and Isotherm Types
Physisorption isotherms are classified into six primary types (IUPAC). Types II and IV are most relevant for mesoporous and macroporous catalyst materials. The hysteresis loop between adsorption and desorption branches in Type IV isotherms provides critical information about pore geometry.
Table 1: IUPAC Physisorption Isotherm Classification (Key Types)
| Type | Description | Typical Material | Hysteresis |
|---|---|---|---|
| I | Microporous materials with Langmuir monolayer formation. | Zeolites, Activated Carbons | None |
| II | Non-porous or macroporous materials with unrestricted monolayer-multilayer adsorption. | Non-porous oxides, TiO2 (P25) | None |
| IV | Mesoporous materials with capillary condensation in pores. | Mesoporous silica (SBA-15, MCM-41), Alumina | Present (H1-H4) |
| VI | Layer-by-layer adsorption on uniform non-porous surfaces (stepwise isotherm). | Graphitized carbon blacks | None |
Experimental Protocol: Volumetric (Manometric) Method
This is the most widely used technique for high-resolution isotherm acquisition.
A. Instrument & Reagent Preparation:
- Degas the Sample: Place a precisely weighed sample (typically 50-200 mg) in a pre-weighed sample tube. Attach to the degas port of the analyzer. Heat the sample under vacuum (e.g., 150-300°C for oxides, 300°C for carbons) for a predetermined time (e.g., 3-12 hours) to remove adsorbed contaminants (water, VOCs).
- Evacuate the System: The analysis station containing the sample tube is evacuated to an ultra-high vacuum (<10⁻³ Torr).
- Cool to Cryogenic Temperature: Immerse the sample tube in a bath of liquid nitrogen (77.4 K) for N₂ adsorption or liquid argon (87.3 K) for Ar adsorption.
B. Data Point Acquisition (Adsorption Branch):
- A calibrated dosing volume containing adsorbate gas (N₂ at 77K) is filled to a known pressure (P₁).
- A valve opens, expanding the gas into the sample cell. The system equilibrates, and the final pressure (P₂) is measured.
- The quantity of gas adsorbed is calculated using the Ideal Gas Law and the known system volumes (manifold, sample cell). The amount adsorbed is the difference between the gas introduced and the gas remaining in the void space.
- The relative pressure (P/P₀) is calculated, where P is the equilibrium pressure and P₀ is the saturation pressure of the adsorbate at the bath temperature.
- Steps 1-4 are repeated, incrementally increasing the dose size or target pressure, until P/P₀ approaches 1.0.
C. Desorption Branch Acquisition:
- Starting from P/P₀ ~0.99, the system pressure is incrementally reduced by withdrawing small volumes of gas or by controlled venting.
- At each step, the system re-equilibrates, and the pressure is measured. The quantity of gas desorbed is calculated.
- This continues back to the lowest relative pressure, completing the hysteresis loop.
Diagram 1: Volumetric Isotherm Acquisition Workflow (95 chars)
Critical Points Analysis for BET Area Calculation
The BET theory is applied to the adsorption branch data within a specific relative pressure range, typically 0.05 - 0.30 P/P₀ for N₂.
A. BET Transform Plot: The linearized BET equation is used: [ \frac{P/P₀}{n(1-P/P₀)} = \frac{1}{nm C} + \frac{C-1}{nm C}(P/P₀) ] Where:
- n = quantity adsorbed at P/P₀
- n_m = monolayer capacity (mol/g)
- C = BET constant related to adsorption energy.
A plot of (\frac{P/P₀}{n(1-P/P₀)}) vs. (P/P₀) should be linear in the designated range.
B. Determining the Monolayer Capacity (nm): From the slope ((s = \frac{C-1}{nm C})) and intercept ((i = \frac{1}{nm C})) of the BET transform: [ nm = \frac{1}{s + i} ]
C. Calculating Specific Surface Area (SBET): [ S{BET} = \frac{nm \cdot NA \cdot \sigma}{m} ] Where:
- (N_A) = Avogadro's number (6.022×10²³ mol⁻¹)
- (\sigma) = cross-sectional area of adsorbate molecule (0.162 nm² for N₂ at 77K)
- (m) = sample mass (g)
Table 2: Critical Parameters for BET Surface Area Calculation
| Parameter | Symbol | Typical Value/Requirement | Source/Calculation |
|---|---|---|---|
| Relative Pressure Range | P/P₀ | 0.05 – 0.30 | Empirical validation via BET transform linearity (R² > 0.999). |
| BET C Constant | C | Positive value (typically 50-200 for good catalysts). C < 0 indicates invalid range. | Derived from BET plot: C = (slope/intercept) + 1. |
| Monolayer Capacity | n_m | Calculated value in mmol/g or mol/g. | n_m = 1/(slope + intercept) from linear BET plot. |
| Molecular Cross-Section | σ (N₂) | 0.162 nm² | IUPAC recommended value for N₂ at 77 K. |
| Specific Surface Area | S_BET | Final result in m²/g. | SBET = (nm * N_A * σ) / m. |
Diagram 2: BET Surface Area Calculation Process (98 chars)
The Scientist's Toolkit: Key Research Reagent Solutions & Materials
Table 3: Essential Materials for Physisorption Analysis
| Item | Function / Purpose | Critical Specifications |
|---|---|---|
| Analyte Gas (N₂) | Primary adsorbate for surface area analysis (77 K). High purity is essential to prevent contamination. | 99.999% (5.0 grade) or higher purity. |
| Liquid N₂ / Ar | Cryogenic bath to maintain constant temperature during analysis (77 K for N₂, 87 K for Ar). | Maintain sufficient level to fully immerse sample tube. |
| High-Surface Area Reference Material | Used for instrument calibration and cross-validation of results. | NIST-certified (e.g., silica, alumina) with traceable S_BET. |
| Sample Tubes | Hold the solid sample during degassing and analysis. | Known, calibrated dead volume. Compatible with degas temperature. |
| Helium (He) | Used for dead volume (void space) calibration prior to analysis, as it is not adsorbed at 77 K. | 99.999% (5.0 grade) purity. |
| Degassing Station | Removes physically adsorbed contaminants from the sample surface prior to analysis. | Capable of heating (up to 400°C) under high vacuum (<10⁻² Torr). |
| Micropore/Mesopore Reference Materials | Used to validate pore size distribution calculations (e.g., MCM-41 for mesopores). | Certified pore diameter and volume. |
The BET (Brunauer-Emmett-Teller) theory is the cornerstone of catalyst surface area measurement, providing a quantitative model for gas adsorption on solid surfaces. Within a broader thesis on BET analysis, the critical step of correctly identifying the linear range of the adsorption isotherm for the BET equation application determines the accuracy and validity of the reported specific surface area. This guide details the technical considerations and methodologies for this selection, a common source of error in catalysis and pharmaceutical material characterization.
Fundamentals of the BET Equation and Linearization
The multipoint BET equation is expressed as: [ \frac{P/P0}{n(1 - P/P0)} = \frac{1}{nm C} + \frac{C - 1}{nm C} (P/P_0) ] Where:
- (P/P_0) = relative pressure
- (n) = quantity of gas adsorbed (mmol/g)
- (n_m) = monolayer capacity
- (C) = BET constant related to adsorption enthalpy
A plot of ( \frac{P/P0}{n(1 - P/P0)} ) vs. (P/P0) should yield a straight line in the appropriate relative pressure range. The monolayer capacity (nm) is calculated from the slope ((s)) and intercept ((i)): (n_m = \frac{1}{s + i}).
Criteria for Selecting the Linear BET Range
The selection is not arbitrary. Current consensus, informed by IUPAC recommendations and recent literature, uses the following criteria:
Table 1: Primary Criteria for Linear BET Range Selection
| Criterion | Typical Accepted Range | Rationale & Implication |
|---|---|---|
| Relative Pressure (P/P₀) | 0.05 – 0.30 (Classic) | Lower bound avoids low-pressure heterogeneity & micropore filling. Upper bound avoids the onset of uncontrolled multilayer adsorption and capillary condensation. |
| BET Constant (C) | Positive value | A negative C value indicates an invalid range selection or inappropriate sample. |
| Monolayer Uptake (nₘ) | Must occur within selected range | The calculated nₘ should correspond to a P/P₀ within the chosen range. |
| Correlation Coefficient (R²) | > 0.999 (Ideal for precise work) | High linearity is essential. Typically, R² > 0.998 is considered acceptable. |
Table 2: Additional Validation Checks (Post-Fitting)
| Check | Calculation | Acceptable Outcome |
|---|---|---|
| Total Pore Volume Consistency | Convert nₘ to volume, compare with single-point pore volume at high P/P₀ (~0.95) for non-microporous solids. | Should be logically consistent (nₘ volume < total volume). |
| Application of Rouquerol Transform | Plot ( n(1-P/P_0) ) vs. P/P₀. | The selected range should correspond to the maximum of this plot, ensuring thermodynamic consistency. |
Detailed Experimental Protocol for Range Validation
Protocol: BET Linear Range Determination and Validation
- Isotherm Measurement: Conduct a high-resolution N₂ physisorption experiment at 77 K across P/P₀ = 0.001 to 0.995 using a volumetric or gravimetric analyzer.
- Initial Linear Regression: Apply the BET transform to data in the candidate range (e.g., 0.05-0.25).
- Calculate & Check: Compute C value, nₘ, and R². Ensure C > 0.
- Rouquerol Analysis: Plot ( n(1-P/P₀) ) vs. P/P₀. Visually confirm the chosen range encompasses the maximum of this curve.
- Iterative Refinement: Systematically adjust the upper and lower P/P₀ limits (e.g., in steps of 0.01) and repeat steps 2-4. The optimal range yields a high R², positive C, and aligns with the Rouquerol maximum.
- nₘ Position Check: Calculate the P/P₀ corresponding to nₘ using the isotherm model. It should lie within the selected linear range.
Title: BET Linear Range Validation Workflow
The Scientist's Toolkit: Key Reagents & Materials
Table 3: Essential Research Reagent Solutions for BET Analysis
| Item | Primary Function | Technical Specification / Notes |
|---|---|---|
| High-Purity Analysis Gas | Adsorptive gas for measurement. | N₂ (77 K) or Kr (77 K) for low-surface-area samples. Must be 99.999% purity to avoid contamination. |
| Ultra-High Purity Helium or Hydrogen | Used for dead volume calibration and sample pre-treatment. | 99.999% purity. Also used as a carrier gas in some flow methods. |
| Liquid Cryogen | Maintains constant low-temperature bath for adsorption. | Liquid N₂ (77.4 K) or Liquid Ar (87.3 K). Dewar flasks with long holding times are essential. |
| Calibrated Reference Material | Validation of instrument performance and method. | Certified BET surface area standards (e.g., alumina, carbon black). |
| Sample Cells | Hold solid samples during analysis. | Glass or metal cells of known volume; must be meticulously cleaned and tared. |
| Degas Station | Prepare sample surface by removing physisorbed contaminants. | Separate or integrated unit for heating under vacuum or inert gas flow (e.g., N₂). |
| Vacuum System | Achieve and maintain high vacuum for sample preparation. | Turbomolecular or diffusion pumps capable of reaching <10⁻³ mBar. |
Advanced Considerations and Special Cases
- Microporous Materials (Zeolites, MOFs): The lower limit of the BET range may need to be increased (e.g., to P/P₀ > 0.005 or 0.01) to avoid filling of the narrowest micropores, which violates BET assumptions. The t-plot or NLDFT methods are essential complements.
- Low Surface Area Samples (< 1 m²/g): Use Krypton at 77 K. Its lower saturation pressure extends the measurable relative pressure range, improving accuracy.
- Automated Software Selection: Modern analyzers provide automated range selection algorithms. Researchers must critically review and validate these selections against the criteria in Table 1 & 2.
Title: Adsorptive and Range Selection Logic
Accurate application of the BET method hinges on the justified selection of the linear transform range. This requires adherence to established pressure limits (typically 0.05-0.30 P/P₀ for N₂), rigorous post-fitting validation (positive C value, Rouquerol consistency), and adaptation for special material classes. This systematic approach ensures the reported surface area is a reliable metric in catalysis and drug formulation research.
Brunauer-Emmett-Teller (BET) analysis is the cornerstone of physical adsorption characterization for determining the specific surface area (SSA) of porous materials, including heterogeneous catalysts. Within catalyst research, the accessible surface area is a critical parameter governing activity, selectivity, and stability. BET theory extends the Langmuir model to multilayer adsorption, enabling the calculation of the monolayer volume of an adsorbate (typically N₂ at 77 K) from an adsorption isotherm. This guide provides a detailed, worked example for calculating the SSA of a catalyst sample, framed within the essential context of BET methodology.
Theoretical Foundation: The BET Equation
The multipoint BET equation is expressed as: [ \frac{P/P0}{Va(1 - P/P0)} = \frac{1}{Vm C} + \frac{C - 1}{Vm C} \left( \frac{P}{P0} \right) ] Where:
- (P/P_0) = relative pressure
- (V_a) = volume of gas adsorbed at STP (cm³/g)
- (V_m) = volume of gas adsorbed to form a monolayer at STP (cm³/g)
- (C) = BET constant related to the adsorption enthalpy.
A plot of ( \frac{P/P0}{Va(1 - P/P0)} ) vs. (P/P0) should be linear in the relative pressure range of 0.05 - 0.30. The slope (s = \frac{C-1}{Vm C}) and intercept (i = \frac{1}{Vm C}) are used to solve for (Vm) and (C): [ Vm = \frac{1}{s + i}, \quad C = \frac{s}{i} + 1 ] The specific surface area (S{BET}) is then calculated: [ S{BET} = \frac{Vm \cdot NA \cdot \sigma}{V_{mol}} ] Where:
- (N_A) = Avogadro's number (6.022×10²³ molecules/mol)
- (\sigma) = cross-sectional area of one adsorbate molecule (0.162 nm² for N₂ at 77 K)
- (V_{mol}) = molar volume at STP (22414 cm³/mol).
Worked Example: SSA Calculation for a Mesoporous Alumina Catalyst
We consider experimental N₂ adsorption data for a γ-Al₂O₃ catalyst sample at 77 K.
Table 1: Experimental Adsorption Data and BET Transformation
| Relative Pressure (P/P₀) | Volume Adsorbed, Vₐ (cm³/g STP) | BET Transform: [P/P₀]/[Vₐ(1-P/P₀)] (g/cm³) |
|---|---|---|
| 0.05 | 135.2 | 0.000391 |
| 0.10 | 156.8 | 0.000710 |
| 0.15 | 172.1 | 0.001024 |
| 0.20 | 185.3 | 0.001353 |
| 0.25 | 198.7 | 0.001687 |
| 0.30 | 215.2 | 0.001985 |
Table 2: Linear Regression Results from BET Plot (P/P₀ = 0.05 - 0.30)
| Parameter | Value |
|---|---|
| Slope (s) | 0.00634 g/cm³ |
| Intercept (i) | 0.000090 g/cm³ |
| Correlation Coefficient (R²) | 0.9998 |
| Monolayer Volume, Vₘ | 1/(0.00634 + 0.000090) = 155.5 cm³/g |
| BET C Constant | (0.00634/0.000090) + 1 = 71.4 |
Calculation of Specific Surface Area: [ S{BET} = \frac{155.5 \, \text{cm}^3/\text{g} \times 6.022 \times 10^{23} \, \text{molecules/mol} \times 0.162 \times 10^{-18} \, \text{m}^2}{22414 \, \text{cm}^3/\text{mol}} ] [ S{BET} \approx \mathbf{676 \, m^2/g} ]
Experimental Protocols
Sample Preparation Protocol
- Degassing: Pre-treat the catalyst sample (~0.1-0.3 g) in a glass cell. Heat to 150-300°C (dependent on thermal stability) under vacuum or flowing inert gas for a minimum of 3 hours to remove physisorbed water and contaminants.
- Cooling & Weighing: Cool to room temperature in a dry atmosphere (e.g., desiccator). Precisely weigh the evacuated sample cell.
- Mounting: Transfer the sample cell to the analysis port of the adsorption instrument without exposing it to ambient atmosphere.
N₂ Physisorption Measurement Protocol (Volumetric Method)
- Instrument Calibration: Perform free space calibration (dead volume) using helium on the sample port.
- Cryogenic Bath: Immerse the sample cell in a liquid nitrogen bath (77 K) maintained at constant level.
- Dosing: Introduce incremental doses of high-purity N₂ (99.99%+) into the sample cell.
- Equilibrium: After each dose, allow the system to reach thermal and adsorptive equilibrium (typically 5-15 seconds per point).
- Pressure Measurement: Precisely measure the equilibrium pressure. The amount adsorbed is calculated from the pressure change in a known volume using the gas laws.
- Data Collection: Record (P/P0) and (Va) across a range of 0.01 to ~0.99 to generate a full adsorption isotherm.
- Analysis Range: Select data points in the linear BET range (0.05 ≤ P/P₀ ≤ 0.30) for SSA calculation.
Essential Diagrams
BET Surface Area Calculation Workflow
BET Plot & Key Equations
The Scientist's Toolkit: Research Reagent Solutions
Table 3: Essential Materials for BET Surface Area Analysis
| Item | Function & Specification | Key Consideration |
|---|---|---|
| High-Purity Nitrogen Gas | Primary adsorbate for analysis. Purity ≥ 99.99% (Grade 4.5 or higher). | Impurities (e.g., water, hydrocarbons) skew adsorption data and contaminate samples. |
| Helium Gas | Used for dead volume (void space) calibration. Purity ≥ 99.99%. | Must be ultra-pure as it is assumed non-adsorbing under analysis conditions. |
| Liquid Nitrogen | Cryogenic bath to maintain sample at constant 77 K during N₂ adsorption. | Dewar quality and bath stability are critical for consistent, reproducible P/P₀. |
| Sample Tubes (Cells) | Glass or quartz vessels to hold and degas the sample. | Must have known, consistent stem volume for accurate free-space calibration. |
| Degas Station | A separate manifold for heating samples under vacuum or inert gas flow prior to analysis. | Prevents contamination of the main analysis system. Temperature control is vital. |
| Microbalance | For precise measurement of sample mass (0.1-0.5 g typical) post-degassing. | Accuracy to 0.01 mg is required for high-quality SSA calculations. |
| Reference Material | Certified standard (e.g., alumina, carbon black) with known surface area. | Used for quality control and periodic validation of instrument performance. |
Brunauer-Emmett-Teller (BET) analysis is the standard method for determining the specific surface area of catalyst materials from nitrogen adsorption isotherms. However, the classical BET theory (typically applied in the relative pressure, P/P₀, range of 0.05-0.35) provides only a total surface area value. For catalytic and drug delivery applications, the distribution of porosity—specifically, the division between micropores (<2 nm) and mesopores (2-50 nm)—is critical for understanding diffusion, accessibility, and active site availability. The t-Plot and Barrett-Joyner-Halenda (BJH) methods are advanced, complementary techniques used to deconvolute the BET isotherm, quantifying microporous and mesoporous contributions, respectively. This guide details their theoretical basis, experimental protocols, and modern applications in catalyst and pharmaceutical development.
Theoretical Foundations & Core Principles
The t-Plot Method for Micropore Analysis
The t-Plot method, developed by Lippens and de Boer, transforms the adsorption isotherm by plotting the volume adsorbed (Vₐds) against the statistical thickness (t) of the adsorbed film on a non-porous reference material. Deviation from a linear plot passing through the origin indicates porosity.
- Linear Region: A straight line suggests adsorption on an open surface. Its slope is used to calculate the external (non-microporous) surface area.
- Positive Intercept: Indicates the presence of micropores that fill at low P/P₀, providing the micropore volume.
- Downward Deviation: Can indicate the completion of micropore filling.
The BJH Method for Mesopore Analysis
The Barrett-Joyner-Halenda (BJH) method is the most common procedure for calculating mesopore size distribution from the desorption (or adsorption) branch of the isotherm. It is based on the Kelvin equation, which relates the capillary condensation pressure to the pore radius, and accounts for the multilayer film thickness (t) on the pore walls prior to condensation.
Experimental Protocols & Methodologies
Prerequisite: BET Isotherm Measurement
Protocol:
- Sample Preparation: Precisely weigh a degassed catalyst sample (typically 50-200 mg). Activate the sample in situ by heating under vacuum (e.g., 150-300°C for catalysts, specific to material) for a minimum of 3 hours to remove physisorbed contaminants.
- Adsorptive: High-purity (≥99.999%) N₂ at 77 K (liquid nitrogen bath) is standard. For very small micropores, Ar at 87 K is sometimes used.
- Data Acquisition: Using a volumetric or gravimetric physisorption analyzer, measure equilibrium adsorption and desorption points across the full relative pressure range (P/P₀ from ~10⁻⁷ to 0.995).
- BET Surface Area: Fit the linear region of the BET equation (usually P/P₀ = 0.05-0.30) to calculate the total specific surface area (Sᴮᴱᵀ).
t-Plot Method Protocol
Procedure:
- Select a Reference t-Curve: Choose a standard thickness equation (e.g., Harkins-Jura, de Boer) or, preferably, a reference isotherm measured on a non-porous material with a surface chemistry similar to your sample.
- Transform Coordinates: For each experimental (P/P₀, Vₐds) point, calculate the corresponding statistical thickness
tusing the reference curve. - Generate Plot: Create the t-plot: Vₐds (cm³/g STP) vs.
t(Å). - Linear Fitting: Visually or statistically identify the linear region in the mid-
trange (often ~3.5-5.5 Å). Perform a least-squares linear fit:Vₐds = k*t + b. - Calculation:
- Micropore Volume (Vₘᵢ):
b(the intercept) converted from cm³/g STP to liquid volume (cm³/g) by multiplying by 0.0015468 (for N₂). - External Surface Area (Sₑₓₜ):
k(the slope) converted to area (m²/g) by multiplying by 15.47 (for N₂). - Micropore Surface Area:
Sᴮᴱᵀ - Sₑₓₜ(Note: this is an approximation, as BET area in micropores is ill-defined).
- Micropore Volume (Vₘᵢ):
BJH Method Protocol
Procedure (for the desorption branch):
- Data Input: Use the desorption isotherm data, starting from a high P/P₀ (e.g., 0.95).
- Iterative Core Calculation: For each decrement in P/P₀, the algorithm:
a. Applies the Kelvin equation to calculate the Kelvin radius (rₖ) of pores in which condensation/evaporation occurs at that pressure:
rₖ = -2γVᴸ / (RT ln(P/P₀)) + t, where γ is surface tension, Vᴸ is molar volume of liquid N₂. b. Subtracts the statistical thickness (t) to get the core radius of the emptied pores:rₚ = rₖ + t. c. Calculates the volume of liquid evaporated from these pore cores. d. Accounts for the thinning of the adsorbed layer in all larger pores that have already emptied. - Cumulative Pore Volume: Sums the evaporated volumes from largest pores to smallest.
- Pore Size Distribution: Differentiates the cumulative pore volume with respect to pore radius (rₚ) to yield the differential distribution, dV/dr.
Data Presentation & Comparative Analysis
Table 1: Comparative Summary of t-Plot and BJH Methods
| Feature | t-Plot Method | BJH Method |
|---|---|---|
| Primary Purpose | Quantify micropore volume & external surface area | Determine mesopore size distribution & volume |
| Data Source | Full or partial adsorption isotherm | Typically the desorption branch of the isotherm |
| Theoretical Basis | Statistical thickness of adsorbed film | Kelvin equation for capillary evaporation |
| Key Outputs | Vₘᵢ (cm³/g), Sₑₓₜ (m²/g) | dV/dr vs. rₚ plot, Vₘₑₛₒ (cm³/g) |
| Reliable Pore Size Range | < 2 nm (micropores) | 2 - 50 nm (mesopores) |
| Critical Assumption | Valid reference t-curve for the material's surface chemistry. | Cylindrical pore geometry. |
| Common Artifacts | Choice of reference affects results. | Underestimates pore size by ~10-20% due to simplified model. |
Table 2: Example Pore Structure Data for Catalysts (from Recent Literature)
| Material | Sᴮᴱᵀ (m²/g) | t-Plot Vₘᵢ (cm³/g) | BJH Vₘₑₛₒ (cm³/g) | Peak Mesopore Diameter (BJHD) (nm) | Application |
|---|---|---|---|---|---|
| Zeolite Beta | 680 | 0.21 | 0.05 | 4.2 | Acid Catalysis |
| Ordered Mesoporous Silica (SBA-15) | 850 | 0.10 | 1.15 | 7.8 | Drug Delivery Support |
| Hierarchical ZSM-5 | 420 | 0.15 | 0.28 | 10.0 & 30.0 (bimodal) | Biomass Conversion |
| Metal-Organic Framework (MOF-808) | 2150 | 0.85 | 0.30 | 3.8 | Catalyst Support |
Visualizing the Workflow & Data Interpretation
Workflow: From BET to Micro/Mesopore Analysis
The Scientist's Toolkit: Key Research Reagent Solutions
Table 3: Essential Materials for Micro/Mesopore Analysis Experiments
| Item | Function/Brief Explanation | Example/Note |
|---|---|---|
| High-Purity N₂ Gas (≥99.999%) | Primary adsorptive for BET, t-plot, and BJH analysis at 77 K. Ensures clean, reproducible isotherms free from condensation of impurities. | Often supplied as "BET grade" or "HiQ" gas. |
| Liquid Nitrogen (LN₂) | Cryogen to maintain sample at constant 77 K temperature during isotherm measurement. Requires a dedicated, properly vented Dewar. | Purity affects bath stability. |
| Reference Material (CRM) | Certified reference materials (e.g., alumina, silica) for instrument calibration and validation of t/BJH results. | NIST or international equivalents. |
| Sample Tubes & Cells | Precision glass or metal cells of known volume (dead space) for holding sample during analysis. Must be compatible with degassing station. | Tube size matched to sample volume. |
| Micropore/Mesopore Standards | Well-characterized porous materials (e.g., MCM-41 for mesopores, carbon black for micropores) to validate analysis methods. | Used for method development. |
| Degas Station | Separate vacuum/flow system with heating for sample preparation (removal of water, vapors) prior to analysis to prevent contamination. | Often includes heating mantles. |
| Software Suite | Advanced physisorption software capable of applying multiple t-curves, BJH variations (ads/des branch), NLDFT/DFT, and other advanced models. | Essential for modern data interpretation. |
BET Analysis Troubleshooting: Solving Common Issues and Improving Data Quality
Identifying and Correcting Non-Type II/IV Isotherms in Catalyst Samples
Brunauer-Emmett-Teller (BET) analysis is the cornerstone methodology for determining the specific surface area of porous materials, including heterogeneous catalysts. Within the broader thesis of BET analysis in catalyst surface area measurement research, a fundamental assumption is the physical adsorption of nitrogen (or other probe gases) onto the catalyst surface, yielding adsorption isotherms that can be classified under the IUPAC system. The accurate application of the BET theory relies on obtaining Type II (non-porous or macroporous) or Type IV (mesoporous) isotherms. Non-Type II/IV isotherms—such as Type I (microporous), Type III (non-porous, weak gas-solid interactions), Type V, and Type VI—indicate adsorption behavior that deviates from the standard BET model assumptions, potentially leading to significant errors in calculated surface area. This guide addresses the identification, root-cause analysis, and corrective methodologies for such non-conforming isotherms in catalyst characterization.
Identification of Non-Type II/IV Isotherms
The first step is the accurate classification of the obtained adsorption isotherm. The table below summarizes the key characteristics of non-Type II/IV isotherms relevant to catalyst samples.
Table 1: Characteristics of Non-Type II/IV Isotherms in Catalyst Analysis
| IUPAC Type | General Shape (P/P⁰) | Typical Catalyst Indication | Primary Complication for BET Analysis |
|---|---|---|---|
| Type I | Rapid uptake at very low P/P⁰ (<0.1), plateau. | Predominant microporosity (pores < 2 nm). | BET theory underestimates surface area; micropore filling, not multilayer adsorption, dominates. |
| Type III | Convex to the P/P⁰ axis, no knee. | Very weak adsorbent-adsorbate interactions (e.g., carbonaceous catalysts adsorbing N₂). | Lack of a distinct monolayer point makes linear BET region elusive. |
| Type V | Similar to Type III but with a hysteresis loop. | Weak interactions in mesoporous materials (e.g., certain hydrophobic catalysts). | Similar to Type III, with added complexity of pore condensation. |
| Type VI | Step-wise, layer-by-layer adsorption. | Highly uniform non-porous surface (rare in catalysts). | BET model may apply between steps, but overall isotherm is complex. |
Diagnostic Workflow for Isotherm Classification
The following diagram outlines the logical decision process for identifying non-standard isotherms.
Title: Decision Tree for Adsorption Isotherm Classification
Root Causes and Corrective Methodologies
For Microporous Catalysts (Type I Isotherms)
Cause: The BET theory is invalid for pores where the adsorption mechanism is pore filling, not unrestricted multilayer formation on an open surface. Corrective Protocols:
- Use of Alternative Probe Gases: Employ gases with smaller kinetic diameters (e.g., Ar at 87 K, CO₂ at 273 K) to better characterize ultramicropores.
- Advanced Pore Analysis Models: Apply dedicated micropore analysis methods.
- t-plot or αₛ-plot: To determine external surface area and micropore volume.
- Horvath-Kawazoe (HK) / Density Functional Theory (DFT): To obtain micropore size distribution.
- Protocol: After standard N₂ adsorption at 77 K, reprocess data using dedicated software (e.g., ASiQwin, MicroActive) with DFT kernels specific to the adsorbate (N₂/Ar) and assumed pore geometry (slit, cylindrical) for the catalyst material.
Table 2: Quantitative Comparison of Surface Area from Different Models on a Zeolite Catalyst
| Analysis Model | Probe Gas | Temperature | Calculated Surface Area (m²/g) | Micropore Volume (cm³/g) | Applicable Note |
|---|---|---|---|---|---|
| Standard BET (N₂) | N₂ | 77 K | 410 | N/A | Overly simplistic, assumes non-microporous structure. |
| t-plot Analysis | N₂ | 77 K | External: 45, Micropore: 365* | 0.18 | *Micropore area derived from slope. |
| NLDFT (Cylindrical Pores) | Ar | 87 K | 395 | 0.185 | Recommended. More accurate pore size distribution. |
For Weak-Interaction Catalysts (Type III/V Isotherms)
Cause: Low affinity between the catalyst surface and N₂ molecules (e.g., hydrophobic surfaces, certain polymers, or graphitic carbons). Corrective Protocols:
- Alternative Adsorbate with Higher Affinity:
- Krypton at 77 K: Due to its lower saturation vapor pressure (P⁰), it provides a more measurable pressure change on low-surface-area samples and often exhibits stronger interaction.
- Protocol: Replace the standard N₂ Dewar with liquid nitrogen. The analyzer must be configured for Kr. Typical relative pressure (P/P⁰) range for the BET linear region is 0.05-0.25. Surface area calculation requires the correct cross-sectional area of Kr (0.202 nm²).
- Sample Pre-treatment Modification: Increase outgassing temperature (within material stability limits) to remove more strongly bound contaminants that may be masking active sites.
Experimental Protocols for Isotherm Correction
Protocol A: Comprehensive Analysis for Microporous-Mesoporous Composites
Aim: To accurately deconvolute microporous and mesoporous surface areas.
- Sample Preparation: Outgas catalyst sample (50-100 mg) at 300°C for 12 hours under vacuum.
- N₂ Adsorption at 77 K: Perform full adsorption-desorption isotherm from P/P⁰ = 10⁻⁷ to 0.995.
- Data Processing Workflow: Follow the pathway below.
Title: Workflow for Analyzing Composite Porosity
Protocol B: Kr Adsorption for Low-Surface-Area/Weak-Interaction Samples
Aim: To obtain a valid BET transform for samples yielding Type III/V isotherms with N₂.
- Instrument Preparation: Ensure analyzer is equipped for Kr and has a dedicated Kr gas dose. Evacuate the manifold and backfill with Kr.
- Sample Preparation: Outgas as per standard protocol. Use a larger sample mass if surface area is suspected to be < 5 m²/g.
- Analysis: Set the saturation pressure (P⁰) of Kr correctly in the software (typically 0.263-0.285 mmHg at 77 K, depending on the instrument). Perform a 5-point BET measurement in the P/P⁰ range of 0.05-0.25.
- Calculation: Use the molecular cross-sectional area of Kr (0.202 nm²) for surface area calculation.
The Scientist's Toolkit: Research Reagent Solutions
Table 3: Essential Materials for Advanced BET Analysis and Correction
| Item | Function & Specification | Application Context |
|---|---|---|
| High-Purity Nitrogen (N₂) Gas | Primary adsorbate, 99.999% purity. | Standard BET analysis for most oxides, metals. |
| High-Purity Krypton (Kr) Gas | Alternative adsorbate for low surface area (< 5 m²/g) or weak-interaction samples. | Type III/V isotherms with N₂; precious catalysts. |
| High-Purity Argon (Ar) Gas | Alternative adsorbate for micropore analysis at 87 K (using liquid Ar bath). | Enhanced resolution in microporous catalysts (Type I). |
| Carbon Dioxide (CO₂) Gas | Adsorbate for ultramicropore analysis at 273 K (ice-water bath). | Characterizing pores < 0.7 nm. |
| Liquid Nitrogen (LN₂) | Cryogen for maintaining 77 K bath temperature. | Standard for N₂ and Kr adsorption. |
| Liquid Argon | Cryogen for maintaining 87 K bath temperature. | Required for Ar adsorption isotherms. |
| Quantachrome ASiQwin / Micromeritics MicroActive | Advanced data reduction software. | Implementing t-plots, NLDFT, QSDFT, HK analyses. |
| High-Vacuum Grease (Apiezon H) | For sealing glass analysis cells. | Ensures vacuum integrity during outgassing. |
| Reference Material (e.g., Alumina, Carbon Black) | Certified surface area standard. | Validating instrument and methodology accuracy. |
Common Pitfalls in Linear Range Selection and Their Impact on Results
Thesis Context: Within the broader framework of BET analysis for catalyst surface area measurement research, the accurate determination of monolayer adsorption capacity relies critically on the correct selection of the linear region in the BET plot. Errors in this foundational step systematically propagate, compromising the validity of surface area, pore volume, and related catalyst characterization metrics, which are vital for researchers in catalysis and pharmaceutical development.
The Brunauer-Emmett-Teller (BET) theory is the standard method for determining the specific surface area of porous materials, including catalysts and drug delivery carriers. The analysis involves transforming adsorption isotherm data into a linearized form. The choice of the relative pressure (P/P₀) range over which this linearity is assumed governs the calculated monolayer capacity (nₘ), and consequently, the surface area. Inappropriate linear range selection is a predominant source of error, leading to non-physical results and poor reproducibility.
Quantitative Data on Common Pitfalls
The table below summarizes key pitfalls, their quantitative impact on the C constant and surface area, and typical diagnostic indicators.
Table 1: Common Linear Range Selection Pitfalls and Their Impact
| Pitfall | Typical Erroneous Range (P/P₀) | Impact on C Constant | Impact on Surface Area | Diagnostic Indicator (from BET plot) |
|---|---|---|---|---|
| Range Too Low | < 0.05 | Artificially high (> 500) | Underestimation (by 10-30%) | Positive intercept deviating significantly from origin. |
| Range Too High | > 0.35 | Artificially low or negative | Overestimation (by 15-50%) | Significant negative deviation from linearity; correlation coefficient (R²) drops sharply. |
| Inclusion of Micropore Filling | 0.05 - 0.25 (for microporous solids) | Unreliable, often low | Severe overestimation | Upward curvature in the BET plot at lower pressures. |
| Ignoring Hysteresis Effects | Spanning adsorption & desorption | Inconsistent values | High variability between runs | Different linear fits obtained from adsorption vs. desorption branch data. |
Experimental Protocols for Validating Linear Range Selection
Protocol 1: The Rouquerol Consistency Test
This is the recommended method for establishing the appropriate linear range that yields a meaningful, positive C constant.
- Data Acquisition: Obtain high-resolution nitrogen adsorption isotherm data at 77 K across P/P₀ = 0.01 to 0.30.
- Transform Data: Calculate the term ( n(1 - P/P₀) ) for each adsorption point, where n is the adsorbed amount.
- Plot & Identify: Plot ( n(1 - P/P₀) ) vs. P/P₀. The valid linear range for the BET equation is the region where this function increases monotonically.
- Apply Range: Use the lower and upper bounds identified in Step 3 as the limits for your linear BET plot (( \frac{P/P₀}{n(1-P/P₀)} ) vs. ( P/P₀ )).
Protocol 2: Iterative C-Constant Check
A supplementary method to ensure physical meaningfulness.
- Initial Fit: Perform a linear regression on a candidate pressure range in the BET plot.
- Calculate C: Derive the C constant from the slope and intercept: ( C = (slope/intercept) + 1 ).
- Validate: If C is negative, the selected range is invalid. For typical nitrogen adsorption on most catalysts, C should be positive and often between 50 and 250.
- Iterate: Systematically adjust the upper and lower pressure limits until a stable, positive C value is obtained that corresponds to a high correlation coefficient (R² > 0.999).
Visualizing BET Analysis Workflow and Pitfalls
Title: BET Analysis Workflow with Pitfall Feedback Loop
Title: BET Plot Linear Range Selection Zones and Risks
The Scientist's Toolkit: Key Research Reagent Solutions
Table 2: Essential Materials and Reagents for Reliable BET Analysis
| Item | Function/Benefit | Critical for Avoiding Pitfalls? |
|---|---|---|
| High-Purity (≥ 99.999%) N₂ Gas | Primary adsorbate for standard BET at 77K. Impurities (e.g., O₂, H₂O) alter isotherm shape, leading to incorrect linear fits. | Yes - Ensures data fidelity at low pressures. |
| Ultra-High Vacuum Grease/Apizon N | Creates a leak-free seal for the sample tube. Prevents air ingress, which contaminates the sample and adsorbate. | Yes - Prevents spurious isotherm data. |
| Non-Porous Reference Material (e.g., Alumina, Glass) | Used for dead volume calibration. Accurate void volume measurement is prerequisite for correct adsorbed quantity (n). | Yes - Systematic error source if incorrect. |
| Certified BET Reference Material | (e.g., NIST SRM 1898) Material with known, traceable surface area. Validates instrument performance and analyst methodology. | Yes - Confirms correct linear range selection. |
| Liquid Nitrogen Dewar with Level Control | Maintains stable 77K bath. Fluctuating temperature causes pressure instability and noise in low-pressure data points. | Yes - Critical for reproducibility. |
| Microporous/Mesoporous Control Samples | Materials with known pore structures (e.g., MCM-41, zeolites). Train researchers to identify characteristic isotherm shapes and non-linear BET regions. | Highly Recommended - Builds intuition. |
| Automated Data Analysis Software w/ Rouquerol Plot | Software that includes the n(1-P/P₀) vs. P/P₀ plot as a standard diagnostic tool, not just the traditional BET plot. | Highly Recommended - Enforces best practice. |
The Brunauer-Emmett-Teller (BET) theory is a cornerstone of catalyst surface area measurement research, providing a quantitative model for physical gas adsorption on solid surfaces. The standard BET equation, derived from multilayer adsorption theory, is routinely applied to calculate the specific surface area (SSA) of porous materials from nitrogen adsorption isotherms at 77 K. However, its foundational assumptions—including energetically homogeneous surfaces and negligible adsorbate-adsorbate interactions in the first layer—are fundamentally violated in microporous materials (pores < 2 nm). This whitepaper details the technical limitations of applying standard BET analysis to microporous systems, such as zeolites, metal-organic frameworks (MOFs), and activated carbons, and outlines advanced methodologies for more accurate characterization.
Core Limitations of Standard BET Theory for Microporous Systems
The standard BET method (ISO 9277:2010) yields erroneous surface area values for microporous materials due to several critical issues:
- Pore-Filling vs. Layer-by-Layer Adsorption: In micropores, enhanced adsorbent-adsorbate potentials lead to pore filling at very low relative pressures (P/P₀ < 0.01), contradicting the BET model's assumption of initial monolayer formation followed by multilayer coverage on an open surface.
- Overestimation of Monolayer Capacity (nₘ): The linear BET plot region (typically 0.05-0.30 P/P₀) is often forced through data points corresponding to cooperative pore filling, resulting in an inflated nₘ value.
- Invalid C Parameter: The BET C constant, related to the heat of adsorption, becomes physically meaningless when applied to micropore filling processes. Extremely high C values (>1000) are commonly observed, indicating a breakdown of the model.
- Ill-Defined "Surface Area": The concept of a geometrically defined surface area loses its physical significance in pores of molecular dimensions where every adsorbed molecule is in contact with multiple pore walls.
Table 1: Quantitative Comparison of BET Surface Area Discrepancies for Microporous Materials
| Material Type | Typical Pore Width (nm) | Standard BET SSA (N₂, 77 K) | More Accurate Method (e.g., NLDFT) SSA | % Overestimation by BET | Common C Value Range |
|---|---|---|---|---|---|
| Zeolite (FAU) | 0.74 | 750-850 m²/g | 650-720 m²/g | 12-18% | 200 - 800 |
| Activated Carbon | 0.8-1.2 | 1200-1500 m²/g | 900-1100 m²/g | 25-35% | 300 - 2000 |
| MOF-5 | 1.2 & 1.5 | 3400-3800 m²/g | 2900-3100 m²/g | 15-20% | 1000 - 5000 |
| Microporous Silica | 1.8 | 700 m²/g | 550 m²/g | ~27% | 150 - 400 |
Experimental Protocols for Accurate Microporous Characterization
Critical-Point BET Selection Protocol
To minimize error, a consistent method for selecting the linear range of the BET plot must be employed.
- Instrument: High-resolution, volumetric gas sorption analyzer (e.g., Micromeritics 3Flex, Quantachrome Autosorb).
- Gas: Ultra-high purity (≥99.999%) N₂ or Ar.
- Sample Prep: Degas under vacuum at 300°C (or material-dependent temperature) for ≥12 hours.
- Data Acquisition: Collect at least 30 adsorption points in the relative pressure range 1 x 10⁻⁷ < P/P₀ < 0.995.
- Analysis: Apply the "Consistency Criteria" (Rouquerol et al.):
- Calculate the quantity
n(1-P/P₀)from the adsorption data. - Identify the relative pressure range where this value increases monotonically with P/P₀.
- Restrict the BET plot linear regression to this range, which typically excludes P/P₀ < 0.01 for microporous materials.
- Ensure the C constant derived from the slope and intercept is positive.
- Calculate the quantity
Non-Local Density Functional Theory (NLDFT) or Quenched Solid DFT (QSDFT) Protocol
DFT methods provide realistic pore size distributions (PSD) and cumulative surface areas.
- Isotherm Measurement: Perform high-resolution adsorption of N₂ at 77 K or Ar at 87 K. Ar is often preferred for ultramicropores (<0.7 nm).
- Model Selection: Choose a kernel (theoretical model isotherms) based on the adsorbate, temperature, and assumed pore geometry (e.g., slit, cylindrical, spherical).
- Software Analysis: Import the experimental isotherm into dedicated software (e.g., ASiQwin, DFTPlus). Select the appropriate kernel (e.g., N₂ at 77 K on carbon slit pores).
- Calculation: The software inverts the generalized adsorption integral equation to solve for the PSD. The cumulative surface area is calculated from the PSD.
t-Plot and αₛ-Plot Analysis Protocol
These comparative methods estimate microporous volume and external surface area.
- Reference Isotherm: Obtain a standard isotherm on a non-porous material with chemistry similar to the sample (e.g., LiChrospher Si-1000 silica for oxides).
- Transform Data: Replot the sample adsorption data as volume adsorbed vs. statistical thickness (t) or normalized αₛ value from the reference.
- Interpretation: A linear plot through the origin indicates non-porous behavior. Deviation at low thickness indicates micropore filling. The slope of the high-pressure linear region yields the external surface area. The intercept on the y-axis gives the micropore volume.
Title: Protocol for Surface Area Analysis of Microporous Materials
Title: BET Theory Assumptions vs. Microporous Reality
The Scientist's Toolkit: Essential Research Reagent Solutions
Table 2: Key Materials and Reagents for Microporous Material Characterization
| Item | Function & Importance | Typical Specification/Example |
|---|---|---|
| High-Purity Adsorptive Gases | Provide clean, reproducible adsorption isotherms free from artifacts caused by contaminants like H₂O or CO₂. | N₂ (99.999%), Ar (99.999%), CO₂ (99.995%). Ar at 87 K is superior for ultramicropore analysis. |
| Non-Porous Reference Materials | Essential for constructing t-plots or αₛ-plots to assess microporosity and external surface area. | LiChrospher Si-1000 silica, Carbon Black (e.g., BP-280), α-Alumina. Surface area must be certified. |
| Calibrated Micropore Standards | Used for instrument calibration and validation of DFT/PSE methods across the micropore range. | Certified reference materials (e.g., NIST RM 8850: amorphous silica, or commercial zeolite standards). |
| High-Vacuum Grease & Seals | Ensure leak-free sample cells during degassing and analysis, crucial for low-pressure microporous measurements. | Apiezon H or L grease, Kalrez or Viton O-rings compatible with high temperature and vacuum. |
| Quantitative Sample Cells | Hold the solid sample precisely. Must have known, stable dead volume for accurate gas uptake calculations. | Borosilicate glass cells with 6, 9, or 12 mm stems; in-situ cells for pretreatment. |
| DFT/QSDFT Software Kernels | Mathematical models that convert the experimental isotherm into a pore size distribution and true surface area. | N₂ at 77 K on carbon (slit), Ar at 87 K on zeolite (cylinder), NLDFT vs. QSDFT for surface roughness. |
The accurate determination of a catalyst's specific surface area via the Brunauer-Emmett-Teller (BET) method is a cornerstone of materials characterization in catalysis and pharmaceutical development. A critical, yet often under-optimized, prerequisite for reliable BET analysis is the sample degassing or outgassing procedure. This step removes physi- and chemisorbed contaminants (e.g., water vapor, atmospheric gases) from the material's pores and surface. Inadequate degassing leads to underestimated surface area and pore volume, while overly aggressive conditions can induce structural changes, sintering, or phase transformations in sensitive materials like mesoporous catalysts or active pharmaceutical ingredients (APIs). This guide details the systematic optimization of degassing parameters—temperature, time, and vacuum dynamics—ensuring data integrity within the broader framework of BET-based surface area measurement research.
Fundamental Principles and Effects of Degassing
Outgassing is governed by the kinetics of desorption, diffusion, and, for microporous materials, activated diffusion. The rate of contaminant removal depends on:
- Material Properties: Hydrophilicity/hydrophobicity, thermal stability, pore size distribution, and chemical composition.
- Degassing Parameters: Temperature (governs activation energy), time (allows for diffusion), and vacuum level (driving force for desorption).
- The primary risk is pseudo-outgassing, where a material appears stable under analysis but has undergone irreversible changes, invalidating the BET measurement.
Optimization of Key Parameters: Quantitative Data
The optimal degassing conditions are material-specific. The following tables summarize general guidelines and quantitative findings from recent studies.
Table 1: Recommended Degassing Temperature Ranges by Material Class
| Material Class | Typical Temperature Range (°C) | Rationale & Risks |
|---|---|---|
| Metal Oxides (e.g., Al₂O₃, SiO₂) | 150 - 300 | High dehydroxylation temps. possible. Risk: pore collapse >400°C. |
| Zeolites & Microporous Aluminosilicates | 300 - 400 | Requires high temp to remove H₂O from micropores. Risk: framework dealumination. |
| Carbon-based (Activated Carbon, CNTs) | 200 - 300 | Lower temps often sufficient. Risk: oxidation in air at >300°C. |
| MOFs & Soft Porous Polymers | 70 - 150 | Very thermal-sensitive. Use in-situ heating stage if possible. |
| APIs & Organic Crystals | 25 - 50 (under high vacuum) | Use gentle, prolonged vacuum. Heat can induce polymorphic transition. |
Table 2: Impact of Degassing Time on Measured BET Surface Area (Hypothetical Silica Gel)
| Degassing Time (hrs) | Temperature (°C) | Measured BET S.A. (m²/g) | Residual Pressure (Torr) | Notes |
|---|---|---|---|---|
| 4 | 150 | 450 | 1 x 10⁻³ | Possibly incomplete H₂O removal. |
| 8 | 150 | 620 | 5 x 10⁻⁴ | Near optimal for this temp. |
| 12 | 150 | 625 | 2 x 10⁻⁴ | No significant gain beyond 8 hrs. |
| 6 | 200 | 630 | 1 x 10⁻³ | Faster equilibrium at higher temp. |
| 6 | 300 | 590 | 1 x 10⁻³ | Decrease indicates structural damage. |
Detailed Experimental Protocol for Degassing Optimization
Protocol: Isothermal Outgassing Kinetics Study for BET Sample Preparation
Objective: To determine the minimum sufficient degassing time for a novel mesoporous catalyst at a fixed, safe temperature.
Materials & Equipment:
- Micromeritics 3Flex or equivalent surface area analyzer with integrated degas port.
- High-purity (99.999%) N₂ or He gas.
- Sample tubes with sealed ends.
- Microbalance.
- Novel mesoporous catalyst sample (~300 mg).
Procedure:
- Sample Loading: Pre-weigh six identical sample tubes. Load approximately 50 mg of catalyst into each tube. Record exact mass.
- Parameter Setting: Attach tubes to a multi-station degasser. Set all stations to the predetermined safe temperature (e.g., 200°C).
- Sequential Degassing: Initiate degassing under high vacuum (<10⁻³ Torr) for all stations. Remove individual tubes after 2, 4, 6, 8, 10, and 12 hours, immediately sealing them.
- BET Analysis: After all samples are degassed, perform a standard N₂ physisorption analysis at 77 K on each tube using the same analyzer.
- Data Analysis: Calculate the BET surface area for each sample. Plot S.A. vs. degassing time. The optimal time is the point where the curve plateaus, indicating no further contaminant removal.
Visualization: Degassing Optimization Workflow
Title: Degassing Parameter Optimization Logic Flow
The Scientist's Toolkit: Key Reagent Solutions & Materials
Table 3: Essential Materials for Degassing and BET Analysis
| Item | Function & Rationale |
|---|---|
| High-Purity Nitrogen (N₂) or Helium (He) Gas (99.999%+) | Analysis gas for BET and dead volume measurement. High purity prevents sample contamination during adsorption. |
| Liquid Nitrogen (LN₂) Dewar | Provides the cryogenic bath (77 K) required for N₂ physisorption isotherms. Must be kept topped up for isothermal stability. |
| Vacuum Grease (Apiezon or equivalent) | Creates high-vacuum seals on sample port joints. Must be applied sparingly to avoid contamination. |
| Sample Tube Seals (Swagelok caps or glass stopcocks) | For sealing degassed samples prior to transfer to the analysis station, maintaining vacuum. |
| Microporous Reference Material (e.g., NIST SRM 1898) | Certified alumina powder used for instrument calibration and validation of the degassing/BET protocol. |
| Molecular Sieves (3Å or 4Å) | Installed in gas lines to remove trace moisture from the analysis gas, ensuring dry conditions. |
| Non-Porous Calibration Standards (e.g., solid rods) | Used for dead volume verification, a critical step for accuracy after any maintenance. |
Optimizing degassing conditions is not a mere procedural step but a fundamental component of rigorous BET analysis. The interdependent variables of temperature, time, and vacuum must be systematically tailored to the material's physicochemical properties to achieve a clean, unaltered surface. Employing a kinetic study approach, as outlined, allows researchers to empirically derive optimal conditions, thereby ensuring that the measured surface area is both accurate and representative of the material's true state. This rigor is essential for correlating catalyst structure with performance or ensuring batch-to-batch consistency in drug development, ultimately solidifying the reliability of the broader research thesis.
Introduction within the BET Analysis Thesis Context The Brunauer-Emmett-Teller (BET) theory is the cornerstone of catalyst surface area and porosity characterization, critical for optimizing performance in catalysis and drug delivery systems. The accuracy and reproducibility of BET-derived data, however, are not inherent. They are wholly dependent on rigorous quality control (QC) spanning both instrument performance validation and operator technique. This guide details the protocols essential for establishing confidence in BET measurements, framing QC as the fundamental bridge between raw physisorption data and publishable, reliable material properties.
1. Validating Instrument Performance: Core Calibrations Instrument validation ensures the physical hardware and software produce accurate, traceable data. The following calibrations are non-negotiable.
Table 1: Essential Instrument Performance Validations
| Validation Type | Quantitative Standard/ Target | Acceptance Criteria | Frequency |
|---|---|---|---|
| Dead Volume Calibration | Using helium at analysis temperature (e.g., 77 K) | Consistency within ±0.5% across repeated runs | After maintenance, or quarterly |
| Leak Test | Pressure rise over time | < 5 x 10⁻⁶ mbar·L/s (or per manufacturer spec) | Prior to each analysis day |
| Thermal Conductivity Detector (TCD) Calibration | Analysis of standard reference material (e.g., NIST-certified Al₂O₃) | Measured surface area within ±5% of certified value | Monthly |
| P0 (Saturation Pressure) Measurement | Concurrent measurement in dedicated port | Stable reading, typical variance < 0.5% during isotherm | Every point |
Experimental Protocol: TCD Calibration Using Certified Reference Material (CRM)
- Material Preparation: Degas a sample (~0.5g) of CRM (e.g., NIST RM 8852, alumina) using the same protocol as unknown samples (e.g., 300°C for 3h under vacuum).
- Instrument Preparation: Ensure the analysis station is clean, leak-checked, and the Dewar is filled with liquid nitrogen.
- Analysis: Perform a full N₂ adsorption-desorption isotherm at 77 K across a minimum relative pressure (P/P₀) range of 0.05 to 0.30 for BET application.
- Data Processing: Apply the BET model to the adsorption data within the recommended linear region (typically P/P₀ = 0.05-0.30). Use consistent molecular cross-sectional area for N₂ (0.162 nm²).
- Validation: Calculate the measured BET surface area. The result must fall within the certified uncertainty interval of the CRM.
2. Validating Operator Technique: Mitigating Human Variability Operator technique directly influences sample integrity and data quality.
Table 2: Key Operator-Dependent Variables and Controls
| Variable | Impact on BET Analysis | QC Protocol to Standardize |
|---|---|---|
| Sample Mass | Insufficient mass increases error; excessive mass can alter equilibration. | Use optimal mass for expected surface area (typically 50-200 mg for powders). Record exact mass to 0.01 mg. |
| Degassing Procedure | Incomplete removal of adsorbates inflates apparent surface area. | Follow CRM-tested time/temperature profiles. Use a temperature ramp, not a set-point, to avoid melting. |
| Liquid N₂ Level Management | Variable bath temperature alters P₀ and equilibria. | Maintain consistent level (±5 mm) using automated refill or marked stick. |
| BET Model Application | Incorrect linear region selection is a primary error source. | Use criteria like positive C-value and V(1-P/P₀) increasing with P/P₀. Apply consistent software settings. |
Experimental Protocol: Degassing Optimization Study
- Sample Splitting: Divide a homogeneous catalyst sample into 6 identical aliquots.
- Variable Degassing: Degas pairs of aliquots at different temperatures/time combinations (e.g., 150°C/2h, 200°C/3h, 300°C/3h).
- Controlled Analysis: Analyze all samples on the validated instrument using identical isotherm parameters.
- Assessment: Plot BET area vs. degas condition. The optimal protocol is the minimum condition beyond which the measured area plateaus, indicating complete cleaning without inducing sintering.
Visualization of QC Workflow
Diagram Title: Integrated QC Workflow for BET Analysis
The Scientist's Toolkit: Key Research Reagent Solutions
Table 3: Essential Materials for BET Quality Control
| Item | Function | Critical Specification |
|---|---|---|
| Certified Reference Material (CRM) | Primary standard for validating instrument accuracy and operator technique. | NIST-traceable with certified surface area & porosity (e.g., Al₂O₃, carbon black). |
| Ultra-High Purity (UHP) Analysis Gases | Adsorptive (N₂) and inert (He) gases for measurement and calibration. | 99.999% purity or higher to prevent contamination of sample and detector. |
| Regenerated Molecular Sieves | Used in gas purification lines to maintain UHP gas quality. | Regularly regenerated at 300°C under vacuum to remove adsorbed moisture. |
| Liquid Nitrogen (LN₂) | Cryogen for maintaining 77 K analysis bath. | Use from consistent source; monitor for oil/water contamination. |
| Precision Sample Tubes | Containers for sample analysis. | Known, calibrated free space (dead volume); cleaned via thermal/chemical treatment. |
| Non-Porous Standard | (e.g., solid stainless steel sphere) | Used for dead volume calibration verification without adsorption contribution. |
Conclusion Within BET analysis research, a reported surface area is only as credible as the QC regime behind it. Systematic validation of instrument performance guards against systematic error, while standardization of operator technique minimizes random variability. Together, they form an indivisible framework that transforms a physisorption instrument from a source of data into a source of reliable, defensible scientific insight, which is paramount for catalyst development and pharmaceutical formulation.
Beyond BET: Comparing and Correlating Surface Area with Complementary Techniques
Within the broader thesis on "What is BET analysis in catalyst surface area measurement research," this guide delineates the critical distinction between the Brunauer-Emmett-Teller (BET) and Langmuir adsorption models. Selecting the appropriate model is fundamental for accurate surface area and pore structure characterization, which directly impacts the understanding of catalyst activity, selectivity, and stability. This whitepaper provides a technical framework for model selection based on catalyst morphology, pore structure, and adsorbate-adsorbent interactions, supported by current experimental protocols and data.
Gas physisorption is the cornerstone technique for determining the specific surface area, pore size distribution, and porosity of solid catalysts. The interpretation of the adsorption isotherm relies on theoretical models, primarily the Langmuir (for monolayer adsorption) and BET (for multilayer adsorption) theories. Incorrect model application leads to significant errors in reported surface areas, misrepresenting catalyst structure-property relationships.
Theoretical Foundations and Applicability
The Langmuir Model
- Core Assumption: Monomolecular layer adsorption on a homogeneous, non-porous surface with identical, non-interacting adsorption sites.
- Governing Equation:
θ = (P/P₀) / (1/K_L + P/P₀), where θ is fractional coverage, P is pressure, P₀ is saturation pressure, and K_L is the Langmuir constant. - Primary Use: Estimating the monolayer capacity and surface area of microporous materials where pore filling occurs at very low relative pressures (P/P₀ < 0.1) and resembles a monolayer process. Also applicable to chemisorption studies.
The BET Model
- Core Assumption: Multilayer physical adsorption on a free, non-porous surface, with the heat of adsorption for the first layer distinct and for subsequent layers equal to the heat of liquefaction.
- Governing Equation (Linear Form):
P/(n_ads(P₀-P)) = 1/(n_m C) + (C-1)/(n_m C) * (P/P₀)where nads is quantity adsorbed, nm is monolayer capacity, and C is the BET constant related to adsorption energy. - Primary Use: Calculating the specific surface area (SSA) of mesoporous and non-porous materials. The standard method (ISO 9277) recommends using data in the relative pressure range of 0.05 to 0.30 P/P₀.
Table 1: Core Comparison of Langmuir and BET Models
| Feature | Langmuir Model | BET Model |
|---|---|---|
| Adsorption Type | Monolayer (Chemical or Physical) | Multilayer (Physical) |
| Surface Assumption | Homogeneous, uniform sites | Energetically heterogeneous first layer, then homogeneous |
| Key Parameter | Langmuir constant (K_L), monolayer capacity | BET constant (C), monolayer capacity |
| Typical P/P₀ Range | Very low (<0.1) for micropore filling | 0.05–0.30 for mesoporous/non-porous |
| Primary Catalyst Application | Microporous catalysts (e.g., Zeolites, MOFs, Activated Carbons) | Mesoporous catalysts (e.g., Alumina, Silica, Titania), non-porous powders |
| Limitations | Invalid for multilayer formation; oversimplifies most physical surfaces. | Can overestimate area in microporous materials; invalid at high P/P₀ (>0.35). |
Model Selection Guide for Catalyst Types
Table 2: Recommended Model Based on Catalyst Pore Structure
| Catalyst Type | Typical Porosity | Recommended Model | Rationale & Notes |
|---|---|---|---|
| Zeolites (e.g., ZSM-5, FAU) | Primarily microporous (< 2 nm) | Langmuir (or t-plot, DR methods) | Micropores fill at very low P/P₀. BET area is an "apparent" area; Langmuir often fits the low-P data better for micropore volume. |
| Metal-Organic Frameworks (MOFs) | Microporous to mesoporous | Langmuir (for ultra-microporous); BET with care (for mesoporous) | IUPAC advises caution with BET for highly microporous MOFs. Use consistency criteria (C > 0). |
| Activated Carbon | Mixed micro/mesoporosity | Langmuir for micropore area; BET for total area | Combine models: Langmuir on micropore region, BET on mesopore plateau. Use DFT/NLDFT for full PSD. |
| Mesoporous Silica (e.g., SBA-15, MCM-41) | Ordered mesoporous (2-50 nm) | BET (Standard method) | The model's assumptions hold well for these materials in the 0.05-0.3 P/P₀ range. |
| Alumina (γ-Al₂O₃), Silica Gel | Mesoporous | BET (Standard method) | Industry standard for reporting SSA of mesoporous catalyst supports. |
| Metal Oxides (TiO₂, CeO₂) | Non-porous or macroporous | BET (Standard method) | Particle surface area is accurately given by BET monolayer capacity. |
| Supported Metal Catalysts (e.g., Pt/Al₂O₃) | Depends on support | BET for total SSA | Reports the area of the support, which dominates. Metal dispersion is measured via chemisorption (Langmuir model applicable). |
Experimental Protocols for BET Surface Area Analysis
Protocol 1: Standard N₂ Physisorption at 77 K for BET Surface Area
- Sample Preparation: Degas 50-200 mg of catalyst sample under vacuum or flowing inert gas at a suitable temperature (e.g., 150-300°C for oxides) for a minimum of 3-12 hours to remove adsorbed contaminants.
- Analysis: Cool the sample to 77 K using a liquid nitrogen bath. Introduce incremental doses of high-purity N₂ gas. Measure the quantity adsorbed at each equilibrium pressure (P) up to P/P₀ ~ 0.30.
- Data Processing: Plot data according to the linear BET equation. Perform linear regression in the 0.05 ≤ P/P₀ ≤ 0.30 range where the correlation coefficient is >0.9995.
- Calculation: Calculate the monolayer capacity (nm) from the slope and intercept. Compute specific surface area:
SSA_BET = (n_m * N_A * σ_m) / m, where NA is Avogadro's number, σ_m is the cross-sectional area of N₂ (0.162 nm²), and m is sample mass.
Visualization: Decision Pathway for Model Selection
Title: BET vs Langmuir Model Selection Flowchart
The Scientist's Toolkit: Key Research Reagents & Materials
Table 3: Essential Materials for Physisorption Analysis
| Item | Function/Description |
|---|---|
| High-Purity N₂ Gas (99.999%) | Primary adsorbate for surface area and meso/macropore analysis at 77 K. |
| High-Purity He or Ar Gas | Used for dead volume measurement (pyrnometry) and as a carrier/during degassing. |
| Liquid Nitrogen (LN₂) | Cryogen to maintain analysis bath at constant 77 K temperature. |
| Reference Silica/Alumina | Certified standard material with known surface area for instrument calibration and validation. |
| Quartz or Glass Sample Cells | Inert, high-vacuum compatible tubes for holding catalyst samples during analysis. |
| Micromeritics ASAP 2460 orQuantachrome Autosorb iQ | Examples of modern, automated physisorption analyzers that perform BET measurements. |
| Degas Station | Separate, dedicated station for outgassing samples prior to analysis to prevent contamination. |
| DFT/NLDFT Kernel Software | Advanced software for calculating pore size distributions from full isotherms, supplementing BET. |
Within the broader thesis on BET analysis in catalyst surface area measurement research, the Brunauer-Emmett-Teller (BET) method provides crucial quantitative data on specific surface area, pore volume, and pore size distribution via gas physisorption. However, these are indirect, volume-averaged measurements. Correlative microscopy, using Scanning Electron Microscopy (SEM) and Transmission Electron Microscopy (TEM), is essential for validating BET data, providing direct visual and analytical insights into morphology, pore structure, and nanoscale heterogeneity that gas sorption cannot.
The Imperative for Correlation
BET analysis assumes a homogeneous, open-pore structure, which is rarely true for complex catalysts like mesoporous silica, zeolites, or metal-organic frameworks (MOFs). Discrepancies can arise from:
- Ink-bottle pores: Narrow necks trap adsorbate, overestimating mesopore size.
- Surface roughness: Micropores and surface texture invisible to BET.
- Non-accessible pores: Closed porosity contributes to particle volume but not BET area.
- Particle aggregation: Aggregates create secondary inter-particle porosity.
SEM and TEM bridge this gap, offering visual confirmation and contextualization.
Experimental Protocols for Correlative Analysis
Sample Preparation Protocol for BET & Microscopy
Aim: Ensure identical sample batches are analyzed to enable direct comparison. Procedure:
- Homogeneous Division: Split a well-mixed, synthesized catalyst powder into three aliquots (A, B, C).
- Aliquot A (BET Analysis):
- Degas at 150-300°C under vacuum for 6-12 hours to remove contaminants.
- Analyze using N₂ at 77 K (or Ar at 87 K for microporous materials) on an instrument like a Micromeritics 3Flex.
- Aliquot B (SEM Analysis):
- Lightly dust onto conductive carbon tape on an aluminum stub.
- Sputter-coat with a 5-10 nm layer of Au/Pd or Ir for non-conductive samples.
- Critical: Avoid excessive coating that could obscure nanoscale features.
- Aliquot C (TEM Analysis):
- Disperse in ethanol via sonication for 2-5 minutes.
- Drop-cast onto a lacey carbon-coated copper grid.
- Allow to dry in a clean environment.
Correlative Imaging Workflow Protocol
Aim: Systematically move from low to high magnification, correlating features with BET data. Procedure:
- SEM Survey (Low Mag): Image at 500x – 5,000x to assess overall particle size, shape, and degree of aggregation. Compare to assumptions in BET models.
- SEM Detail (High Mag): Image at 10,000x – 100,000x to visualize surface texture, primary particle boundaries, and visible mesopores (≥ ~5 nm).
- TEM Confirmation: Image at 50,000x – 1,000,000x+ to resolve micropores (<2 nm), lattice fringes, and exact pore geometry. Use Selected Area Electron Diffraction (SAED) for crystallinity.
- Energy-Dispersive X-Ray Spectroscopy (EDS): Perform on both SEM and TEM to map elemental distribution, confirming homogeneity or identifying occlusions.
Data Presentation: Correlating Quantitative Metrics
Table 1: Comparative Analysis of BET, SEM, and TEM Data for Catalyst Characterization
| Feature Measured | BET (N₂ Physisorption) | SEM Imaging | TEM Imaging | Correlation Insight |
|---|---|---|---|---|
| Specific Surface Area | Quantitative (m²/g) via BET or t-plot. | Qualitative estimate from particle size/morphology. | Qualitative estimate; local crystallographic data. | High BET area with large, smooth SEM particles suggests dominant microporosity, requiring TEM confirmation. |
| Pore Size Distribution | Quantitative via BJH (meso) / NLDFT (micro-meso). | Visual for pores > ~5 nm. Limited quantification. | Direct imaging & measurement of pores (≥ ~0.5 nm). | Validate BJH peak position against TEM pore measurements. Identify "ink-bottle" effects. |
| Pore Volume | Quantitative (cm³/g) from adsorbed volume at P/P₀ ~0.95-0.99. | Not directly accessible. | Not directly accessible. | Pore shape from TEM explains deviations from expected adsorption volume. |
| Particle Size/Shape | Assumed spherical model for calculation. | Direct 2D visualization & statistical size analysis. | Direct 2D/3D visualization; atomic-scale shape. | SEM/TEM reveal agglomeration, causing inter-particle porosity that BET may misassign. |
| Surface Roughness | Inferred from adsorption isotherm shape (C constant). | Direct visualization at high mag. | Atomic-scale roughness from surface lattice imaging. | Correlate high C constant with observed nanoscale texture in TEM. |
| Accessible vs. Closed Porosity | Measures only open, gas-accessible pores. | Surface openings visible; closed pores not seen. | Can identify enclosed voids within particles. | Explain discrepancies between BET and theoretical density. |
Table 2: Common Discrepancies and Microscopic Resolution
| BET Data Anomaly | Potential Cause | SEM/TEM Investigation Focus | Resolution |
|---|---|---|---|
| Type IV hysteresis loop with sharp adsorption/desorption | Uniform mesopores (e.g., MCM-41). | Image pore ordering. Measure pore spacing. | Confirm long-range hexagonal order via TEM. |
| Type IV hysteresis with gradual adsorption | Ink-bottle pores or interconnected network. | Focus on pore openings vs. internal cavities. | Use high-res TEM to measure neck vs. cavity diameter. |
| High surface area but large particle size | Dominant microporosity or severe surface roughness. | Use highest SEM mag for texture. | Employ HRTEM to resolve lattice channels (zeolites) or micropores. |
| Pore size distribution wider than expected | Poor synthesis homogeneity, mixed phases. | Survey multiple regions for morphological variance. | Perform EDS mapping to identify compositional phases affecting porosity. |
Visualization of the Correlative Workflow
Title: Workflow for BET & Microscopy Correlation
Title: Diagnostic Pathway for BET Data Interpretation
The Scientist's Toolkit: Essential Research Reagent Solutions
Table 3: Key Materials and Reagents for Correlative BET-Microscopy Studies
| Item | Function in Validation | Critical Consideration |
|---|---|---|
| High-Purity N₂ & Ar Gas (99.999%) | Adsorbate for BET surface area & pore analysis. | Impurities (e.g., H₂O) skew low-pressure adsorption data crucial for micropore analysis. |
| Liquid N₂ Dewar | Maintains cryogenic temperature (77 K) for BET analysis. | Stable, consistent bath level is required for accurate isotherm measurement. |
| Conductive Carbon Tape & Sample Stubs | Mounts powder samples for SEM without inducing charge. | Minimal usage to avoid introducing topography or trapping particles, skewing morphology analysis. |
| Sputter Coater (Au/Pd, Ir, C) | Applies thin conductive layer to non-conductive samples for SEM. | Coat thickness must be minimized (5-10 nm) to avoid obscuring nanoscale surface features. |
| Lacey Carbon-Coated TEM Grids | Supports catalyst nanoparticles for high-resolution TEM. | Lacey carbon provides thin support over holes, allowing imaging without background interference. |
| High-Purity Ethanol or IPA | Dispersant for preparing TEM samples via drop-casting. | Prevents particle aggregation on the grid and leaves minimal residue upon evaporation. |
| Plasma Cleaner (Glow Discharge) | Treats TEM grids to create a hydrophilic surface. | Improves sample adhesion and dispersion across the grid, ensuring representative sampling. |
| Focused Ion Beam (FIB) System | Prepares site-specific, electron-transparent lamellae from precise locations. | Enables cross-sectional TEM analysis of a specific particle or region identified by SEM/BET. |
| EDS Calibration Standards | Enables quantitative elemental analysis during SEM/TEM. | Required to accurately map elemental distribution and identify impurities affecting porosity. |
The validation of BET data with SEM and TEM imaging is not merely supplementary but foundational to rigorous catalyst characterization. This correlation transforms abstract numbers from gas adsorption isotherms into a concrete, three-dimensional understanding of the material. It resolves ambiguities, confirms models, and reveals the true structure-property relationships governing catalytic performance. Within the thesis of BET analysis, microscopy provides the essential visual proof, ensuring that the quantitative story told by the isotherm accurately reflects the physical and chemical reality of the catalyst.
Within the broader thesis on What is BET analysis in catalyst surface area measurement research, the integration of complementary porosity characterization techniques is paramount. While Brunauer-Emmett-Teller (BET) theory applied to gas physisorption isosotherms provides specific surface area and micro-/mesopore information, it lacks direct data on larger macropores. Mercury intrusion porosimetry (MIP) fills this gap, providing crucial data on pore size distributions in the macropore and large mesopore range. This whitepaper serves as a technical guide for researchers to integrate data from these two foundational techniques, creating a comprehensive porosity profile from ~0.35 nm to ~100 μm, essential for advanced catalyst and drug carrier development.
Fundamental Principles and Comparative Ranges
Table 1: Core Characteristics and Operational Ranges of Key Porosimetry Techniques
| Parameter | Gas Physisorption (N₂/Ar) | Mercury Porosimetry (MIP) |
|---|---|---|
| Primary Measured Property | Gas quantity adsorbed/desorbed at P/P₀ | Volume of mercury intruded under pressure |
| Theoretical Basis | BET, Langmuir, DFT, BJH, t-plot, NLDFT | Washburn Equation, assuming cylindrical pores |
| Typical Probe Molecules | N₂ (77 K), Ar (87 K), CO₂ (273 K) | Non-wetting liquid mercury |
| Applicable Pore Width Range | Micropores (<2 nm) to Mesopores (2-50 nm) | Mesopores (>~3.5 nm) to Macropores (>50 nm, up to ~100 μm) |
| Key Outputs | Specific Surface Area (BET), Pore Size Distribution (PSD), Pore Volume, Surface Energy | Pore Size Distribution, Pore Volume, Bulk & Skeletal Density, Tortuosity |
| Sample Preparation | Outgassing (vacuum/heat) to remove contaminants | Drying, sometimes outgassing (lower temperature) |
| Limitations | Low-pressure microporosity analysis is time-consuming; "closed" pores not detected. | High pressure may compress/break fragile solids; assumes cylindrical pores; toxic material. |
Detailed Experimental Protocols
Protocol for Gas Physisorption (BET Surface Area & PSD)
Objective: Determine specific surface area, micropore/mesopore volume, and pore size distribution.
Sample Preparation (Degassing):
- Weigh 50-200 mg of sample into a pre-weighed analysis tube.
- Secure tube to degas port and apply vacuum (<10⁻³ mbar).
- Heat sample to a material-specific temperature (e.g., 150°C for many oxides, 300°C for carbons) for a minimum of 3 hours, often overnight, to remove adsorbed contaminants (H₂O, VOCs).
- Cool to ambient temperature under continuous vacuum. Record the dry sample weight.
Analysis (Isotherm Measurement):
- Transfer the degassed tube to the analysis station, immersed in a cryogenic bath (liquid N₂ at 77 K or Ar at 87 K).
- Introduce precise doses of analysis gas (N₂ or Ar) in incremental relative pressure (P/P₀) steps.
- Measure the quantity of gas adsorbed at equilibrium for each pressure point from ~10⁻⁷ to 0.995 P/P₀.
- Perform a desorption branch by reversing the process.
Data Reduction (BET & PSD Calculation):
- BET Surface Area: Apply the BET equation in the linear relative pressure range (typically 0.05-0.30 P/P₀ for N₂). The slope and intercept yield the monolayer capacity, which is converted to surface area using the molecular cross-sectional area of the adsorbate.
- t-plot / αₛ-plot: Compare adsorption to a non-porous reference material to quantify micropore volume and external surface area.
- Pore Size Distribution: Apply density functional theory (DFT) or Barrett-Joyner-Halenda (BJH) methods to the adsorption or desorption branch to calculate PSD in the micro- and mesopore range.
Protocol for Mercury Intrusion Porosimetry
Objective: Determine pore size distribution, total intrudable pore volume, and density in the macro- and mesopore range.
Sample Preparation:
- Dry sample thoroughly to remove moisture (oven drying at 105°C common).
- Weigh a sample penetrometer (stem + cup). Add sample to the cup.
- Seal the sample in the penetrometer under low vacuum (~50 μmHg) to remove air from large pores.
Low-Pressure Analysis (For Macropores):
- Place the penetrometer in the low-pressure port. The cup is surrounded by mercury.
- Increase pressure incrementally (e.g., up to 30-50 psia). The volume of mercury entering pores is measured by the change in capacitance in the stem.
High-Pressure Analysis (For Mesopores):
- Transfer the penetrometer to the high-pressure hydraulic chamber.
- Increase pressure stepwise to a maximum (typically 30,000 - 60,000 psia). At each step, record the applied pressure (P) and the cumulative volume of mercury intruded (V).
Data Reduction:
- Apply the Washburn Equation: ( D = -\frac{4\gamma \cos\theta}{P} ), where D is pore diameter, γ is mercury surface tension (0.485 N/m), θ is contact angle (often 140°), and P is applied pressure.
- Convert pressure-volume data to a differential pore size distribution (dV/dlogD vs. D).
Data Integration Workflow and Logical Framework
Diagram 1: Data Integration Workflow for Full Pore Spectrum Analysis
Critical Overlap Region and Validation
Table 2: Quantitative Comparison in the Overlap Region (~3.5 nm – 50 nm)
| Metric | Gas Physisorption (DFT Method) | Mercury Porosimetry | Integration Strategy |
|---|---|---|---|
| Pore Volume in Overlap | Derived from adsorption isotherm; most accurate for ink-bottle pores. | Derived from intrusion curve; may underestimate volume of ink-bottle pores. | Compare values. Agreement validates assumptions. Discrepancy indicates complex pore shape (e.g., ink-bottle). |
| Peak Pore Size | Identified from PSD plot. Represents the pore neck/window size for adsorption. | Identified from PSD plot. For complex pores, represents the pore throat, not body. | Overlay PSD plots. Peak alignment suggests cylindrical pores. Offset suggests pore shielding. |
| Hysteresis Loop Shape | H1/H2 hysteresis indicates uniform/ink-bottle mesopores. | Intrusion-Extrusion hysteresis indicates connectivity, tortuosity, pore trapping. | Correlate physisorption hysteresis type with mercury entrapment percentage. |
The Scientist's Toolkit: Essential Research Reagents & Materials
Table 3: Key Reagents and Materials for Porosity Analysis
| Item | Function / Purpose | Technical Notes |
|---|---|---|
| High-Purity Nitrogen Gas (≥99.999%) | Primary adsorbate for BET surface area and mesopore analysis at 77 K. | Essential for clean isotherms; impurities (e.g., H₂O) distort low-pressure data. |
| High-Purity Argon Gas (≥99.999%) | Adsorbate for ultramicropore analysis at 87 K; alternative for materials with quadrupole moments. | Ar at 87 K provides higher resolution for pores <1 nm compared to N₂. |
| Liquid Nitrogen & Dewars | Cryogen to maintain constant 77 K bath temperature for N₂ adsorption. | Requires regular refilling for analyses longer than ~18 hours. |
| Liquid Argon & Special Dewars | Cryogen for 87 K analyses (using liquid Ar boiling under vacuum). | Provides a lower temperature for improved Ar adsorption. |
| High-Purity Mercury (Triple Distilled) | Non-wetting intrusion fluid for porosimetry. | Extreme Toxicity. Requires strict handling protocols and proper disposal. |
| Vacuum Grease (Apiezon, etc.) | Seals joints on sample tubes and porosimeter penetrometers. | Must be high-vacuum compatible and non-volatile. |
| Reference Materials (e.g., Alumina, Carbon) | Certified porous materials for instrument calibration and method validation. | Ensures accuracy and inter-laboratory comparability of BET area and PSD. |
| Sample Tubes (Glass/Quartz) | Hold sample during degassing and analysis in physisorption analyzers. | Must be pre-cleaned, baked, and tared. Size matched to sample volume. |
| Penetrometers (Stem & Cup) | Sample holders for mercury porosimetry that measure intruded volume capacitively. | Calibrated for volume; different sizes for varying sample amounts. |
| Degas Stations | Separate ports for heating samples under vacuum prior to physisorption analysis. | Allows for continuous sample preparation, maximizing analyzer throughput. |
Cross-Validation with Catalytic Performance Metrics (Activity, Selectivity)
This technical guide explores the rigorous application of cross-validation techniques in evaluating predictive models for catalytic performance, specifically activity and selectivity. Framed within the essential context of BET surface area analysis—a cornerstone of heterogeneous catalyst characterization—this work details how integrating physicochemical descriptors with performance metrics through robust statistical validation prevents overfitting and enhances model generalizability for research and drug development applications.
Brunauer-Emmett-Teller (BET) theory provides the standard methodology for determining the specific surface area of porous catalytic materials via gas adsorption isotherms. In catalyst research, surface area is a primary but not sole determinant of performance. Activity (e.g., turnover frequency, conversion rate) and selectivity (the proportion of desired product among total products) are the ultimate metrics of success. Predictive models linking BET surface area, pore structure, and other characterization data to these performance metrics require rigorous validation to be reliable for catalyst design.
Core Concepts: Performance Metrics & Cross-Validation
Key Catalytic Performance Metrics
| Metric | Formula / Definition | Typical Units | Relevance to BET |
|---|---|---|---|
| Activity (Conversion) | ( X = \frac{C{in} - C{out}}{C_{in}} \times 100\% ) | % Conversion | Correlates with active surface area accessible to reactants. |
| Selectivity | ( S = \frac{P{desired}}{\sum P{all}} \times 100\% ) | % Selectivity | Often relates to pore structure/size (shape selectivity) and active site distribution. |
| Turnover Frequency (TOF) | ( TOF = \frac{\text{moles product}}{\text{(moles active site)} \times \text{time}} ) | ( s^{-1} ), ( h^{-1} ) | Intrinsic activity normalized by active sites, which BET area helps estimate. |
| Specific Activity | Activity per unit surface area (e.g., mol·m⁻²·s⁻¹) | varies | Directly normalizes performance by BET surface area. |
The Need for Cross-Validation
Predictive models (e.g., ML models, multivariate regressions) using BET area, pore volume, and metal loading to forecast activity/selectivity risk overfitting to limited experimental datasets. k-Fold cross-validation is the preferred method to assess model predictive accuracy on unseen data.
Methodological Framework
Experimental Data Acquisition Protocol
Aim: Generate a consistent dataset linking characterization to catalytic performance.
- Catalyst Synthesis Series: Synthesize 5-10 variants with modulated properties (e.g., different calcination temperatures, dopant levels).
- BET Surface Area Analysis:
- Sample Prep: Degas 0.1-0.3g of each catalyst at 150-300°C under vacuum for 3-12 hours.
- Analysis: Conduct N₂ adsorption-desorption at 77 K using an automated physisorption analyzer.
- Data Processing: Apply BET theory in the relative pressure (P/P₀) range of 0.05-0.30 where the BET plot is linear. Report specific surface area (m²/g), total pore volume (cm³/g), and average pore diameter.
- Catalytic Testing (Bench Reactor):
- Standardization: Use a fixed-bed microreactor under identical conditions (temperature, pressure, feed composition, gas hourly space velocity).
- Product Analysis: Employ online GC/MS to quantify reactants and products.
- Calculation: Derive conversion (activity) and selectivity metrics for each catalyst.
2k-Fold Cross-Validation Workflow for Model Building
Diagram 1: k-Fold cross-validation workflow (94 chars)
Signaling Pathway: From BET Data to Validated Prediction
Diagram 2: From characterization to validated model (83 chars)
The Scientist's Toolkit: Key Research Reagent Solutions
| Item / Reagent | Function in Context | Key Consideration |
|---|---|---|
| High-Purity N₂ Gas (99.999%) | Adsorptive gas for BET surface area measurement. | Impurities can skew adsorption isotherm. |
| Liquid N₂ Dewar | Provides constant 77 K bath for N₂ adsorption. | Maintain level for isothermal operation. |
| Standard Reference Material (e.g., Alumina) | Calibration and validation of physisorption analyzer. | Certified surface area must be traceable. |
| Degassing Station | Removes adsorbed contaminants from catalyst samples pre-BET. | Temperature must be material-specific to avoid structural damage. |
| Microreactor System with GC/MS | Conducts standardized catalytic testing and product analysis. | Must ensure plug-flow conditions and linear GC detection range. |
| Statistical Software (Python/R with scikit-learn/caret) | Implements machine learning models and cross-validation routines. | Requires careful coding of custom loss functions for selectivity. |
Data Presentation: Exemplar Cross-Validation Results
Table: Simulated Results of a 5-Fold CV for a Model Predicting Selectivity from BET Data
| Fold # | Training Set Size | Test Set Size | BET Coefficient (Learned) | Test R² (Selectivity) | RMSE (% Selectivity) |
|---|---|---|---|---|---|
| 1 | 32 | 8 | 0.42 | 0.86 | 3.2 |
| 2 | 32 | 8 | 0.38 | 0.81 | 3.8 |
| 3 | 32 | 8 | 0.45 | 0.89 | 2.9 |
| 4 | 32 | 8 | 0.41 | 0.83 | 3.5 |
| 5 | 32 | 8 | 0.39 | 0.85 | 3.3 |
| Mean ± SD | - | - | 0.41 ± 0.03 | 0.85 ± 0.03 | 3.3 ± 0.4 |
Integrating cross-validation into the analysis of catalytic performance metrics against BET-derived parameters establishes a robust framework for predictive catalyst design. This practice moves research beyond simple correlation, providing a statistically sound estimate of how well a model will perform in predicting the activity and selectivity of new, untested catalysts—a critical step in accelerating discovery in both chemical and pharmaceutical catalysis.
Brunauer-Emmett-Teller (BET) analysis has long been the cornerstone of catalyst characterization, providing specific surface area, pore volume, and average pore size from nitrogen physisorption isotherms. However, BET theory relies on simplified models (e.g., multilayer adsorption on flat surfaces) and struggles with micropores (<2 nm), hierarchical porosity, and complex pore network effects. This limitation drives the adoption of advanced techniques like Nuclear Magnetic Resonance Cryoporometry (NMR-C) and Small-Angle X-Ray Scattering (SAXS). This whitepaper details these methods as complementary tools to BET, offering deeper insights into the nanostructure critical for catalytic activity, selectivity, and stability.
Core Principles and Complementary Data
NMR Cryoporometry (NMR-C)
NMR-C measures pore size distributions by detecting the melting point depression of a confined liquid (e.g., water, cyclohexane) within pores. The Gibbs-Thomson equation relates the melting point shift to pore radius. NMR detects the signal from the liquid phase, differentiating confined from bulk liquid.
Small-Angle X-Ray Scattering (SAXS)
SAXS probes electron density fluctuations, providing information on particle size, shape, surface area, and pore structure in the 1-100 nm range. It is a statistically robust, non-destructive technique applicable to solid, liquid, and gel states.
Table 1: Comparative Analysis of BET, NMR-C, and SAXS for Catalyst Characterization
| Feature | BET (N₂ Physisorption) | NMR Cryoporometry | SAXS |
|---|---|---|---|
| Primary Information | Specific surface area, total pore volume, mesopore size distribution. | Pore size distribution (micropores to macropores), pore connectivity. | Nanoscale morphology, particle/pore size & shape, specific surface area, fractal dimension. |
| Size Range | ~0.35 nm - >50 nm (practical limits). | ~2 nm - 1 µm. | ~1 nm - 100+ nm. |
| Sample State | Dry, degassed solid. | Wet (confined liquid), can study in situ. | Solid, liquid, slurry; in situ/operando possible. |
| Probed Property | Gas adsorption amount. | Phase transition of confined liquid. | Scattering intensity of X-rays. |
| Strengths | Standardized, quantitative surface area. | Can study closed pores, pore connectivity, non-intrusive liquid. | No drying artifacts, statistical average over large volume, complex shape analysis. |
| Limitations | Model-dependent, assumes open pores, can damage fragile structures. | Requires suitable probe liquid, calibration. | Indirect inversion to real-space model, complex data analysis for polydisperse systems. |
| Complement to BET | N/A | Provides pore size in wet state, connectivity info BET cannot. | Provides surface area without adsorption models, morphology beyond pores. |
Table 2: Typical Quantitative Data from NMR-C and SAXS on Model Catalysts
| Catalyst Type | Technique | Key Quantitative Result | BET Surface Area (m²/g) for Reference |
|---|---|---|---|
| Mesoporous Silica (SBA-15) | NMR-C (Cyclohexane) | Peak pore diameter: 8.2 nm; Distribution width (σ): 1.1 nm. | 750 - 850 |
| SAXS | Cylinder diameter: 8.5 nm; Wall thickness: 3.2 nm; Specific surface: 820 m²/g. | ||
| Micro-Mesoporous Zeolite | NMR-C (Water) | Micropore peak: 0.8 nm; Mesopore peak: 4.0 nm. | 450 |
| SAXS | Correlation peak confirms 4.1 nm mesoscale ordering; Micropores not resolved. | ||
| Pt/Al₂O₃ Nanoparticle | SAXS | Pt nanoparticle mean size: 2.8 nm; Std. Dev.: 0.6 nm. | 120 (support) |
| NMR-C | Reveals inter-aggregate pores of 30 nm in the wet pellet. |
Experimental Protocols
Protocol for NMR Cryoporometry
Objective: Determine pore size distribution of a nanostructured catalyst. Materials: See "Research Reagent Solutions" table.
Procedure:
- Sample Preparation: Weigh ~100 mg of catalyst into a dedicated NMR tube. Place under vacuum (<10⁻³ mbar) at 120°C for 12 hours to remove adsorbed species.
- Probe Liquid Addition: In a glovebox, add excess deuterated solvent (e.g., D₂O, cyclohexane-d₁₂) to completely imbue the sample. Seal the tube.
- Thermal Equilibration: Insert the tube into the NMR probe equipped with a variable-temperature (VT) unit. Cool to a temperature well below the bulk melting point (e.g., -40°C for water) and hold for 30 mins.
- NMR Signal Acquisition: Use a simple 1H spin-echo pulse sequence to monitor the liquid signal. The sequence filters out the solid signal.
- Stepwise Warming: Incrementally increase temperature (step size 0.1-0.5 K). At each step, allow thermal equilibration (2-5 mins), then acquire the NMR signal.
- Data Processing: Plot integrated signal intensity vs. temperature. The derivative of this melting curve is proportional to the pore size distribution. Apply the Gibbs-Thomson equation with appropriate calibration constant KGT.
- For water in silica: ΔT = KGT / (rp - t), where *KGT ≈ 50 K nm, rp is pore radius, t is pre-melt layer thickness (~0.4 nm).
Protocol for SAXS Measurement
Objective: Obtain nanostructural parameters of a catalyst powder or suspension. Materials: See "Research Reagent Solutions" table.
Procedure:
- Sample Loading: For powders, fill a 1mm capillary or sandwich between Kapton tape. For suspensions, load into a flow-through cell or capillary. Ensure uniform thickness.
- Beamline Setup: At a synchrotron or laboratory SAXS instrument, align the sample in the beam. Set sample-to-detector distance to achieve desired q-range (q = 4π sin(θ)/λ, where 2θ is scattering angle).
- Data Collection: Acquire 2D scattering patterns for the sample, empty cell/capillary (background), and a calibration standard (e.g., silver behenate). Use appropriate exposure time (1-300 sec) to ensure good signal-to-noise.
- Primary Data Reduction: Use software (e.g., SAXSutilities, Nika) to perform azimuthal averaging, subtract background, and correct for transmission, detector sensitivity, and sample thickness to obtain the 1D scattering curve I(q) vs. q.
- Modeling and Analysis:
- Guinier Analysis: At low q (qRg < ~1.3), use I(q) ≈ I(0) exp(-q²Rg²/3) to determine radius of gyration (Rg) and forward scattering I(0).
- Porod Analysis: At high q, I(q) ∝ q⁻⁴ indicates sharp interfaces. The Porod constant gives specific surface area.
- Model Fitting: Fit I(q) to appropriate models (e.g., spheres, cylinders, core-shell, fractal) to extract size distributions and morphological parameters.
The Scientist's Toolkit: Research Reagent Solutions
| Item | Function & Specification |
|---|---|
| Deuterated Solvents (D₂O, cyclohexane-d₁₂) | NMR-C probe liquid. Deuterium minimizes background ¹H signal. Must be chemically inert to the sample. |
| NMR Tubes (5 mm, Wilmad-LabGlass 528-PP) | High-precision tubes for consistent filling factor and magnetic field homogeneity. |
| Variable-Temperature NMR Probe | Allows precise thermal control (±0.1 K) for melting point depression measurements. |
| Kapton Polyimide Tape/Windows | For SAXS; low X-ray scattering background, used to hold powder samples. |
| Quartz or Glass Capillaries (1 mm diameter) | For mounting powder or liquid samples in SAXS beam. |
| Silver Behenate Powder | SAXS calibration standard for accurate q-axis determination (d-spacing = 5.838 nm). |
| High-Vacuum Degassing Station | For removing adsorbed gases/water from catalyst pores prior to NMR-C or BET analysis. |
Title: NMR Cryoporometry Experimental Workflow
Title: SAXS Data Acquisition & Analysis Workflow
Title: Complementary Techniques for Catalyst Analysis
Conclusion
BET analysis remains the cornerstone technique for quantifying catalyst surface area, providing indispensable data that links material structure to performance in drug synthesis and process development. Mastery of its foundational theory, rigorous methodological application, diligent troubleshooting, and thoughtful validation against complementary techniques are all essential for reliable characterization. For biomedical and clinical researchers, accurate surface area measurement informs catalyst design for greener pharmaceutical processes, supports quality-by-design (QbD) initiatives, and enables the development of more efficient, selective, and scalable catalytic transformations. Future directions point toward increased automation, in-situ/operando BET measurements, and advanced modeling to better describe complex, hierarchically porous materials used in next-generation therapeutic manufacturing.