BET Method for Surface Area Analysis: A Complete Guide for Pharmaceutical Researchers
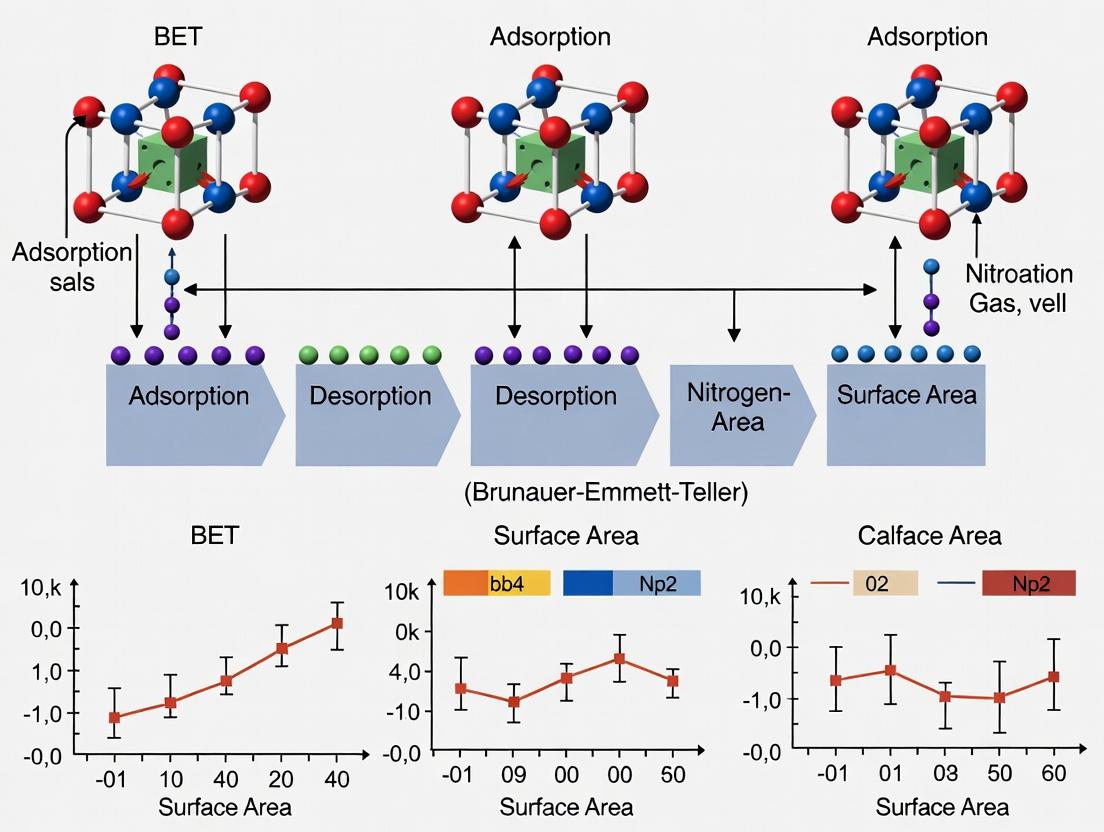
This comprehensive article explores the Brunauer-Emmett-Teller (BET) method for measuring the specific surface area of porous materials, with a focus on applications in pharmaceutical research and drug development.
BET Method for Surface Area Analysis: A Complete Guide for Pharmaceutical Researchers
Abstract
This comprehensive article explores the Brunauer-Emmett-Teller (BET) method for measuring the specific surface area of porous materials, with a focus on applications in pharmaceutical research and drug development. It covers the foundational principles of gas adsorption theory, detailed methodological protocols for accurate measurement, practical troubleshooting and optimization strategies for real-world samples, and a comparative analysis with complementary techniques. The content is tailored to help researchers, scientists, and development professionals select, execute, and validate BET surface area data to enhance drug formulation, catalyst design, and material characterization.
Understanding BET Theory: The Science Behind Surface Area Measurement
Surface area, specifically the specific surface area (SSA) of solid drug substances and excipients, is a pivotal physicochemical parameter that dictates critical quality attributes throughout the drug development lifecycle. Within the broader thesis of BET (Brunauer-Emmett-Teller) theory application for nanomaterial characterization in pharmaceutics, this article delineates its non-negotiable role. The BET method provides the definitive quantitative framework for measuring SSA, which directly influences dissolution kinetics, bioavailability, stability, and manufacturability of solid dosage forms. Mastery of SSA measurement and control is therefore fundamental to transitioning from candidate selection to a robust, efficacious commercial product.
Application Notes: The Impact of Surface Area on Key Pharmaceutical Properties
Table 1: Correlation Between Specific Surface Area and Drug Performance Metrics
| Drug Property / Process | Low SSA Impact | High SSA Impact | Typical SSA Range for Actives | Key Measurement Method |
|---|---|---|---|---|
| Dissolution Rate | Slower, potential for incomplete release. | Faster, enhanced initial release. | 1 - 100 m²/g (micronized/nano) | BET Gas Adsorption (N₂) |
| Oral Bioavailability | Reduced absorption, especially for BCS Class II/IV drugs. | Potentially increased Cₘₐₓ and AUC. | > 5 m²/g often targeted for poor solubility. | Derived from dissolution & BET data. |
| Chemical Stability | Lower reactivity, potentially more stable. | Higher susceptibility to degradation (hydrolysis, oxidation). | Critical for biologics & peptides. | BET + Accelerated Stability Studies |
| Flowability & Blend Uniformity | Generally better flow (coarse powders). | Poor flow, cohesion, potential for segregation. | Excipients: 0.5 - 3 m²/g; Actives: variable. | BET complemented by bulk/tap density. |
| Tablet Compaction | May require higher compression force. | Can enhance bonding but may cause capping. | Optimized via granulation to modify SSA. | BET on pre- & post-granulation material. |
Protocol: BET Surface Area Analysis for API Lot Release
1.0 Objective: To determine the specific surface area of an Active Pharmaceutical Ingredient (API) batch using multi-point BET analysis via nitrogen adsorption at 77 K.
2.0 Materials & Equipment (The Scientist's Toolkit)
Table 2: Essential Research Reagent Solutions & Materials
| Item | Function / Explanation |
|---|---|
| High-Purity Nitrogen (N₂) Gas | Adsorptive gas; its cross-sectional area (0.162 nm²) is the standard for BET calculations. |
| High-Purity Helium (He) Gas | Used for dead volume calibration and sample purging. |
| Ultra-High Vacuum Grease | Ensures a leak-free seal on the sample tube. |
| Liquid Nitrogen Dewar | Maintains a constant 77 K bath temperature for adsorption. |
| Certified Reference Material (e.g., alumina) | Validates instrument performance and methodology. |
| Sample Tubes with Stem | Hold the API sample during analysis; must be scrupulously clean. |
| Micromeritics 3Flex or Equivalent | Automated surface area and porosity analyzer. |
| Ultra-Micro Balance (≤ 0.001 mg accuracy) | For precise sample mass measurement. |
| Vacuum Degassing Station | Prepares the API surface by removing adsorbed contaminants. |
3.0 Experimental Methodology
3.1 Sample Preparation:
- Accurately weigh (to 0.01 mg) an appropriate mass of API (targeting a total surface area of 40-120 m² for the sample) into a clean, tared analysis tube.
- Attach the tube to the degassing station. Seal and apply a vacuum (≤ 10 µmHg) while heating to a predetermined, non-degrading temperature (e.g., 40°C) for a minimum of 12 hours.
- Back-fill the tube with inert gas, seal, and re-weigh to obtain the degassed sample mass.
3.2 Analysis Setup:
- Mount the degassed sample tube onto the analysis port.
- Immerse the sample tube in a liquid nitrogen bath (77 K) to establish the analysis temperature.
- Initiate the automated analysis sequence via the instrument software.
3.3 Data Acquisition (BET Multipoint Method):
- The instrument admits successive doses of N₂ gas onto the sample at 77 K.
- After each dose, the system reaches equilibrium pressure (P), and the quantity adsorbed (V) is measured.
- Data is collected across a relative pressure (P/P₀) range typically between 0.05 and 0.30.
3.4 Data Analysis & Reporting:
- Apply the BET equation to the adsorption data in the linear relative pressure region:
[P/(V(P₀-P))] = (1/(VₘC)) + ((C-1)/(VₘC))*(P/P₀)where V is volume adsorbed, Vₘ is monolayer volume, and C is the BET constant. - Plot
[P/(V(P₀-P))]vs.(P/P₀)and perform linear regression. - Calculate Vₘ from the slope and intercept.
- Calculate the specific surface area (SSA):
SSA = (Vₘ * N * A_cs) / (M * V_s), where N is Avogadro's number, Acs is the cross-sectional area of N₂ (0.162 nm²), M is the molar volume of gas, and Vs is the sample volume. - Report the SSA in m²/g with ± confidence interval, the correlation coefficient (R²) of the BET plot, and the C constant.
Visualizations
BET Surface Area Analysis Workflow
SSA Impact on Drug Product Attributes
The quantification of solid surface area is a cornerstone in materials science, catalysis, and pharmaceutical development. The Brunauer-Emmett-Teller (BET) theory, introduced in 1938, remains the standard method. Its development is rooted in earlier work by Irving Langmuir, establishing a direct historical and theoretical lineage from gas adsorption monolayer concepts to multilayer theory.
Table 1: Key Milestones in Gas Adsorption Theory Development
| Year | Scientist(s) | Contribution | Key Limitation Overcome |
|---|---|---|---|
| 1915-1918 | Irving Langmuir | Langmuir Isotherm: Monolayer adsorption theory for non-porous, uniform surfaces. | Described chemisorption/strong physisorption only. |
| 1938 | Stephen Brunauer, Paul Hugh Emmett, Edward Teller | BET Theory: Extended model to multilayer physical adsorption on non-porous solids. | Enabled surface area calculation from multilayer physisorption isotherms. |
| 1940s-1950s | Various | Standardization of BET method using N₂ at 77 K. | Established reproducible experimental protocol. |
| 1985 | IUPAC | Classification of six adsorption isotherm types. | Provided framework for pore structure analysis. |
| 2000s-Present | - | Development of DFT/NLDFT methods for pore size analysis; High-throughput analyzers; Standards for microporous materials. | Addresses limitations of classic BET for microporous and heterogeneous surfaces. |
Core Theoretical Principles & Data Interpretation
The BET equation is derived from kinetic principles of gas molecule adsorption and desorption on a free surface and atop already-adsorbed layers.
Equation: ( \frac{P}{Va(P0 - P)} = \frac{1}{Vm C} + \frac{C - 1}{Vm C} \cdot \frac{P}{P0} ) Where ( P ) = equilibrium pressure, ( P0 ) = saturation pressure, ( Va ) = adsorbed gas volume, ( Vm ) = monolayer capacity, ( C ) = BET constant related to adsorption heat.
Table 2: Standard BET Analysis Parameters for Common Probe Gases
| Probe Gas | Analysis Temperature (K) | Cross-sectional Area (Ų/molecule) | Typical Application | Recommended P/P₀ Range (BET linearity) |
|---|---|---|---|---|
| Nitrogen (N₂) | 77 (liquid N₂ bath) | 16.2 | General purpose, mesoporous materials | 0.05 - 0.30 |
| Krypton (Kr) | 77 (liquid N₂ bath) | 20.2 (common) / 21.0 (recent) | Very low surface area solids (< 1 m²/g) | 0.05 - 0.30 |
| Argon (Ar) | 87 (liquid Ar bath) or 77 | 14.2 (on carbon) / 16.2 (on oxide) | Microporous materials, alternative to N₂ | 0.05 - 0.30 |
| Carbon Dioxide (CO₂) | 273 (ice bath) | 17.0 (at 273K) | Ultramicroporous characterization (0.3-0.8 nm) | 0.001 - 0.03 |
Detailed Experimental Protocols
Protocol 3.1: Sample Preparation for BET Surface Area Analysis
Objective: To prepare a solid sample (e.g., active pharmaceutical ingredient - API) for accurate surface area measurement by removing adsorbed contaminants. Materials: BET analyzer, sample tube, degassing station, furnace, high-purity N₂ gas, vacuum pump, micrometrics sample tube, analytical balance. Procedure:
- Weighing: Accurately weigh an empty, clean sample tube. Add sufficient sample to achieve a total surface area between 5-200 m². Weigh again to determine exact sample mass.
- Degassing: Attach tube to degassing station. Heat sample to appropriate temperature (typically 100-300°C for APIs; below decomposition T) under vacuum or flowing inert gas for a minimum of 6 hours, or until outgassing rate is negligible.
- Cooling & Transfer: Isolate tube under vacuum. Cool to room temperature. Transfer to analysis port of BET instrument without exposure to atmosphere.
- Validation: Post-analysis, check the isotherm for hysteresis closure and low pressure uptake to confirm adequate degassing.
Protocol 3.2: Static Volumetric N₂ Adsorption Measurement at 77 K
Objective: To collect a high-resolution N₂ adsorption-desorption isotherm for surface area and pore size distribution calculation. Materials: Prepared sample tube, BET analyzer (e.g., Micromeritics 3Flex, Quantachrome Autosorb), liquid N₂ Dewar, high-purity (99.999%) N₂ and He gases, pressure transducers. Procedure:
- Dead Volume Calibration: With sample tube installed, immerse Dewar of liquid N₂. Perform a free space measurement using He gas.
- Dosing & Equilibration: Set instrument to collect 50-100 data points across P/P₀ range 10⁻⁵ to 0.995. The system doses precise volumes of N₂ and measures equilibrium pressure at each point.
- Adsorption Branch: Measure up to saturation pressure (P/P₀ ~0.995). Record equilibrium adsorbed quantity at each point.
- Desorption Branch: Gradually reduce pressure by evacuating the system, measuring desorbed quantity at each step.
- Data Output: Instrument software records P/P₀ vs. V_ads (cm³/g STP).
Data Analysis & Reporting Protocol
Protocol 4.1: BET Surface Area Calculation from N₂ Isotherm
Objective: To calculate the specific surface area from the adsorption isotherm data. Procedure:
- Select Linear Region: Identify the linear range in the BET transform plot (typically 0.05-0.30 P/P₀ for most non-porous/mesoporous materials).
- Perform Linear Regression: On the plot of ( \frac{P/P0}{Va(1-P/P0)} ) vs. ( P/P0 ). Slope = ( \frac{C-1}{Vm C} ), Intercept = ( \frac{1}{Vm C} ).
- Calculate Vm and C: ( Vm = \frac{1}{\text{slope} + \text{intercept}} ) ( C = \frac{\text{slope}}{\text{intercept}} + 1 )
- Calculate Surface Area: ( S{BET} = \frac{Vm \cdot NA \cdot \sigma}{V0 \cdot m} ) Where ( NA ) = Avogadro's number, ( \sigma ) = cross-sectional area of N₂ (16.2 x 10⁻²⁰ m²), ( V0 ) = molar volume at STP (22414 cm³/mol), ( m ) = sample mass (g).
Table 3: Critical Quality Checks for Valid BET Analysis
| Check | Criteria | Rationale |
|---|---|---|
| C-Value | Positive and typically between 50-200 for N₂. | Indicates adequate adsorbate-adsorbent interaction. |
| Linearity (R²) | R² > 0.9995 for BET transform in selected range. | Ensures theory applicability. |
| Pressure Range | 0.05 ≤ P/P₀ ≤ 0.30 (IUPAC recommendation). | Avoids capillary condensation and weak adsorption regions. |
| Monolayer Uptake | V_m should lie within the chosen P/P₀ range. | Confirms correct linear region selection. |
Visualizations
Title: Evolution of Surface Area Analysis Theory
Title: BET Surface Area Measurement Protocol
The Scientist's Toolkit: Key Research Reagent Solutions
Table 4: Essential Materials for BET Surface Area Analysis
| Item | Function | Specification/Notes |
|---|---|---|
| High-Purity Nitrogen (N₂) | Primary adsorbate gas for analysis. | 99.999% minimum purity, dry, to prevent contamination. |
| High-Purity Helium (He) | Used for dead volume (free space) calibration. | 99.999% purity, inert, non-adsorbing at 77K. |
| Liquid Nitrogen (LN₂) | Cryogen to maintain analysis temperature at 77 K. | Standard laboratory grade, ensure steady level during run. |
| BET Reference Material | Validation of instrument performance and method. | NIST-certified or similar (e.g., alumina, silica, carbon black). |
| Sample Tubes (with filler rods) | Hold sample during degassing and analysis. | Glass or metal, accurately calibrated for volume. |
| Degas Station | Removes adsorbed contaminants from sample surface. | Must provide controlled heat (ambient to 450°C) under vacuum/inert flow. |
| Microbalance | Accurately measure sample mass. | Capacity 0.1 mg sensitivity, critical for low-surface-area samples. |
The Brunauer-Emmett-Teller (BET) theory stands as a cornerstone in the characterization of porous and finely divided materials. Within the broader thesis on BET method validation and application, this article unpacks the core equation and its foundational assumptions. The method is indispensable for quantifying the specific surface area (SSA) of catalysts, adsorbents, pharmaceutical powders, and nanomaterials, directly influencing research in drug formulation, bioavailability, and quality control.
Deconstructing the BET Equation
The BET equation models multilayer physical adsorption of gas molecules (typically N₂ at 77 K) on a solid surface. Its linearized form is:
[ \frac{P/P0}{n(1 - P/P0)} = \frac{1}{nm C} + \frac{C - 1}{nm C} (P/P_0) ]
Where:
- (P): Equilibrium adsorption pressure
- (P_0): Saturation pressure of the adsorbate at analysis temperature
- (n): Quantity of gas adsorbed at relative pressure (P/P_0)
- (n_m): Monolayer capacity (amount of gas required to form a single molecular layer)
- (C): BET constant related to the adsorption energy of the first layer
From (nm), the specific surface area (S) is calculated: [ S = \frac{nm NA \sigma}{m} ] Where (NA) is Avogadro's number, (\sigma) is the cross-sectional area of one adsorbate molecule (0.162 nm² for N₂ at 77 K), and (m) is the sample mass.
Table 1: Key Variables in the BET Equation
| Variable | Symbol | Typical Units | Physical Meaning |
|---|---|---|---|
| Relative Pressure | (P/P_0) | Dimensionless | Driving force for adsorption. |
| Amount Adsorbed | (n) | cm³/g STP, mol/g | Total gas uptake at a given P/P₀. |
| Monolayer Capacity | (n_m) | cm³/g STP, mol/g | Core result; gas needed for monolayer coverage. |
| BET Constant | (C) | Dimensionless | Indicates adsorbent-adsorbate interaction strength. |
| Cross-sectional Area | (\sigma) | m², nm² | Area occupied by a single adsorbed molecule. |
| Specific Surface Area | (S) | m²/g | Final reported metric. |
Foundational Assumptions and Their Implications
The derivation of the BET equation relies on several physical assumptions, which also define its limits of validity.
Table 2: Core BET Assumptions and Practical Implications
| Assumption | Implication for Measurement | Common Violation & Effect |
|---|---|---|
| 1. Adsorption occurs on open, flat, homogeneous surfaces. | Simplifies energy distribution. | Real materials have roughness, pores, and chemical heterogeneity. This affects C value and linearity. |
| 2. No lateral interactions between adsorbed molecules. | Enables simple statistical derivation. | High C values (>300) may indicate significant interactions, questioning model fitness. |
| 3. The heat of adsorption for the first layer is constant and unique; for subsequent layers, it equals the heat of liquefaction. | Enables the multilayer model. | Microporous materials (pores < 2 nm) have enhanced adsorption energy in confined spaces, invalidating this. |
| 4. Adsorption/desorption is infinite at (P/P_0 = 1). | Mathematical boundary condition. | All real systems have a limit. Mesopores (2-50 nm) fill via capillary condensation, causing isotherm hysteresis. |
Diagram Title: BET Model Assumptions and Their Violations
The Scientist's Toolkit: Key Reagents & Materials
Table 3: Essential Research Reagent Solutions for BET Analysis
| Item | Function & Specification |
|---|---|
| High-Purity Analysis Gases | N₂ (99.999%+): Primary adsorbate for SSA. He (99.999%+): For dead volume calibration. N₂/He mixture (e.g., 30 mol%): For continuous flow (chemisorption) analyzers. |
| Calibration Standards | Certified reference materials (e.g., alumina, silica) with traceable SSA. Used for instrument validation and method qualification in regulated environments (e.g., pharma). |
| Sample Cells/Tubes | Glass or metal tubes of known volume. Must be scrupulously clean to prevent contamination affecting adsorption. |
| Degas Station | Separate unit or integral to analyzer. Provides controlled heating under vacuum or inert flow to remove surface contaminants (H₂O, VOCs) prior to analysis. |
| Liquid Coolant | Liquid Nitrogen (LN₂) at 77 K: Standard cryogen for N₂ adsorption. Liquid Argon (87 K): Alternative for microporous materials to improve resolution. |
| Regeneration Gas | Inert Gas (e.g., N₂, Ar): For cooling samples under inert atmosphere post-degas to prevent re-adsorption of contaminants. |
Experimental Protocol: BET Surface Area Measurement via Volumetric Method
Protocol Title: Static Volumetric Gas Adsorption for BET Surface Area Determination.
1. Principle: Precisely measure the amount of pure N₂ gas adsorbed onto a degassed solid sample at a series of controlled relative pressures (P/P₀) at 77 K. Construct an adsorption isotherm, apply the BET transform in the linear region (typically 0.05-0.30 P/P₀), and calculate the monolayer capacity (n_m) to derive SSA.
2. Materials & Equipment:
- Volumetric (Manometric) Gas Sorption Analyzer.
- Components listed in Table 3.
- Microbalance (for precise sample weighing).
- Sample preparation station.
3. Pre-Analysis Procedure: 1. Sample Preparation: Weigh an appropriate mass (targeting total surface area >5 m² for analyzer) into a clean, dry sample tube. 2. Sample Degassing: Attach tube to degas station. Apply vacuum (e.g., <10⁻³ mbar) and/or inert gas purge while heating to a material-specific temperature (e.g., 150°C for many oxides, 300°C for zeolites) for a defined duration (typically 2-12 hours). Critical: Temperature must not induce sample decomposition. 3. Cooling & Weighing: Cool sample under inert atmosphere (N₂ or He). Precisely weigh the degassed sample+tube assembly to determine degassed sample mass. 4. System Evacuation: Mount the sample tube onto the analyzer's designated port. The analyzer manifold and sample are evacuated to ultra-high vacuum (<10⁻⁶ mbar) to remove all traces of gas.
4. Analysis (Adsorption Isotherm) Workflow:
Diagram Title: BET Isotherm Data Collection Workflow
5. Post-Analysis & Data Processing Protocol: 1. BET Transform: For the adsorption branch data, plot (\frac{P/P0}{n(1-P/P0)}) vs. (P/P0) as per the linear BET equation. 2. Linearity Check: Identify the linear region, conventionally between 0.05 and 0.30 P/P₀. The correlation coefficient (R) should be >0.999. IUPAC recommends that the term (C(P/P0)) must be positive. 3. Calculate nm and C: Perform linear regression on points in the linear region. Intercept = (1/(nm C)), Slope = ((C-1)/(nm C)). Solve for (nm) and (C). 4. Calculate SSA: Apply the SSA equation using the cross-sectional area (\sigma) (0.162 nm² for N₂). Report result in m²/g with the used P/P₀ range and C value.
Table 4: Example BET Data Reduction from a Reference Silica
| Relative Pressure (P/P₀) | Quantity Adsorbed (cm³/g STP) | BET Transform Y-value |
|---|---|---|
| 0.050 | 36.5 | 0.00146 |
| 0.100 | 39.8 | 0.00281 |
| 0.150 | 42.5 | 0.00417 |
| 0.200 | 45.0 | 0.00556 |
| 0.250 | 47.8 | 0.00699 |
| 0.300 | 51.1 | 0.00840 |
Regression (0.05-0.30 P/P₀): Slope = 0.0267, Intercept = 0.00018, R² = 0.9999. Calculated n_m = 37.3 cm³/g STP, C = 149. SSA = (37.3 * 6.022e23 * 1.62e-19) / (Sample Mass g) = 364 m²/g.
The Brunauer-Emmett-Teller (BET) theory is the cornerstone of surface area and porosity characterization for solid materials. Within a broader thesis on BET method advancements, precise definition and application of key terms—monolayer capacity, cross-sectional area, and pore type classification—are critical for accurate data interpretation, particularly in pharmaceutical development where surface properties dictate drug adsorption, stability, and release kinetics.
Key Terms: Definitions and Quantitative Data
Monolayer Capacity (nₘ)
The monolayer capacity is the amount of adsorbate (typically nitrogen at 77 K) required to form a single, complete molecular layer on the surface of a solid. It is the fundamental derived quantity from the BET equation, from which the total surface area is calculated.
BET Equation:
1 / [n((P₀/P)-1)] = (1/(nₘC)) + ((C-1)/(nₘC))*(P/P₀)
Where: n = quantity adsorbed, P/P₀ = relative pressure, nₘ = monolayer capacity, C = BET constant.
Cross-Sectional Area (σ)
The average area occupied by a single adsorbate molecule in the completed monolayer. For nitrogen at 77 K, the universally accepted value is 0.162 nm². The choice of molecule and its assigned cross-sectional area significantly impacts the calculated surface area.
Pore Type Classification (IUPAC)
Pores are classified based on their internal width (diameter for cylindrical pores).
Table 1: IUPAC Pore Classification and Characterization Methods
| Pore Type | Pore Width (Diameter) | Primary Characterization Method | Typical Adsorption Isotherm Shape (N₂ at 77K) |
|---|---|---|---|
| Micropore | < 2 nm | Dubinin-Radushkevich, Horvath-Kawazoe, t-plot | Type I |
| Mesopore | 2 - 50 nm | Barrett-Joyner-Halenda (BJH), DFT, NLDFT | Type IV, Hysteresis loops |
| Macropore | > 50 nm | Mercury Intrusion Porosimetry (MIP) | Type II or III (near P/P₀ = 1) |
Table 2: Common Probe Molecules and Their Cross-Sectional Areas
| Adsorbate Gas | Analysis Temperature (K) | Cross-Sectional Area (σ, nm²) | Typical Application |
|---|---|---|---|
| Nitrogen (N₂) | 77 | 0.162 | Standard BET, mesoporosity |
| Argon (Ar) | 87 | 0.142 | Microporosity, DFT studies |
| Krypton (Kr) | 77 | 0.202 | Very low surface area materials (< 1 m²/g) |
| Carbon Dioxide (CO₂) | 273 | 0.187 | Ultramicropores (< 0.7 nm) |
Experimental Protocols
Protocol 3.1: Determination of BET Surface Area and Monolayer Capacity (Static Volumetric Method)
Purpose: To calculate the specific surface area of a mesoporous pharmaceutical excipient (e.g., silica).
Materials:
- Degassed solid sample (~0.2-0.5 g)
- BET Surface Area Analyzer (e.g., Micromeritics 3Flex, Quantachrome Nova)
- Liquid nitrogen Dewar
- High-purity (≥99.999%) N₂ gas
- He gas for free space measurement
Procedure:
- Sample Preparation: Weigh a clean, dry sample tube with sample. Degas the sample at an appropriate temperature (e.g., 150°C for silica) under vacuum for a minimum of 12 hours to remove physisorbed contaminants.
- Cool-down: Backfill the sample tube with helium, seal, and transfer to the analysis port. Immerse the sample in a liquid nitrogen bath (77 K) to establish cryogenic temperature.
- Free Space Measurement: Introduce a known amount of helium into the sample tube. Helium is not adsorbed at 77K and measures the dead volume (free space) of the system.
- Adsorption Analysis: Evacuate the helium. Introduce incremental doses of N₂ gas onto the sample at 77 K. Allow equilibrium after each dose (∆P < 0.01 torr/min). Measure the equilibrium pressure and quantity adsorbed.
- Data Collection: Continue until a relative pressure (P/P₀) of at least 0.3 is reached. For BET analysis, use data typically in the P/P₀ range of 0.05 - 0.30.
- BET Transformation: Plot
1 / [n((P₀/P)-1)]vs.P/P₀according to the BET equation. Perform linear regression. - Calculation:
- Slope (s) =
(C-1)/(nₘC) - Intercept (i) =
1/(nₘC) - Solve for nₘ:
nₘ = 1/(s + i) - Calculate Surface Area (S):
S = (nₘ * N_A * σ) / m, where N_A is Avogadro's number and m is sample mass.
- Slope (s) =
Protocol 3.2: Pore Size Distribution Analysis via BJH Method (Adsorption Branch)
Purpose: To determine mesopore size distribution from N₂ adsorption isotherm.
Procedure:
- Full Isotherm: Continue Protocol 3.1 to obtain a full adsorption-desorption isotherm up to P/P₀ ~0.99.
- Thickness Curve: Apply a statistical thickness curve (e.g., Harkins-Jura) to calculate the thickness t of the adsorbed film on the pore walls at each P/P₀.
- Core Radius: At a point during desorption (or adsorption), the core radius r_c is calculated from the Kelvin equation:
r_k = -2γV_m / (RT ln(P/P₀)), where γ is surface tension and Vm is molar volume of liquid N₂. The pore radius *rp = r_k + t*. - Incremental Pore Volume: Calculate the volume of liquid N₂ desorbed between two pressure steps. This volume is ascribed to pores with a radius defined by the Kelvin equation for that pressure step, corrected for the multilayer thickness on the walls of larger pores.
- Cumulative & Differential Plot: Generate a plot of cumulative pore volume vs. pore width and the differential pore size distribution (dV/dlog(w) vs. width).
Visualizations
Diagram 1: BET Analysis Workflow
Diagram 2: Pore Classification & Analysis Pathways
The Scientist's Toolkit: Research Reagent Solutions
Table 3: Essential Materials for BET Surface Area and Porosity Analysis
| Item | Function / Description | Example Product/Catalog |
|---|---|---|
| High-Purity N₂ Gas (Grade 5.0 or better) | Primary adsorbate for standard BET and mesopore analysis. Impurities (e.g., H₂O, CO₂) distort isotherms. | Available from industrial gas suppliers (Airgas, Linde). |
| Liquid Nitrogen | Cryogen to maintain sample at 77 K during analysis. Requires proper Dewar for handling and transfer. | Standard laboratory supply. |
| High-Purity He Gas | Used for dead volume (free space) measurement and sample transfer. | Available from industrial gas suppliers. |
| Reference Material (Certified BET Standard) | Calibrates instrument and validates protocol. Often non-porous alumina or silica with known surface area. | NIST SRM 1898, NIST SRM 2000. |
| Sample Tubes with Fill Rods | Hold the solid sample during degassing and analysis. Fill rods minimize dead volume for low-surface-area samples. | Manufacturer-specific (Micromeritics P/N 512-53801-01). |
| Degassing Station | Separate vacuum system with heating to prepare samples by removing adsorbed species prior to analysis. | Micromeritics VacPrep, Anton Paar FlowPrep. |
| Cold Trap (Optional) | Protects vacuum pump and manifold from condensable vapors during sample degassing. | Used with liquid nitrogen or Peltier coolers. |
| Microbalance | Precisely weighs small sample masses (0.05-0.5 g) for accurate specific surface area calculation. | Mettler Toledo XP6, Sartorius Cubis. |
Within the broader research on the Brunauer-Emmett-Teller (BET) method for surface area measurement, the selection of an appropriate probe gas is paramount. This application note details the physicochemical rationale for the standardization of nitrogen at 77K as the primary probe gas for physisorption-based surface area analysis. We provide a comparative analysis of alternative gases, detailed experimental protocols for BET surface area measurement, and a discussion on applications, particularly in pharmaceutical development where surface area is a critical quality attribute (CQA) for active pharmaceutical ingredients (APIs) and excipients.
The BET theory requires an inert gas that undergoes physical adsorption (physisorption) on a solid surface under controlled conditions. The choice of probe gas directly influences the measured surface area value, reproducibility, and instrument design. Standardization enables reliable comparison of data across laboratories and industries, which is essential for material characterization in catalysis, nanotechnology, and pharmaceutical sciences.
Quantitative Comparison of Common Probe Gasses
The table below summarizes key properties of gases considered for BET surface area analysis.
Table 1: Comparative Properties of Probe Gasses for BET Analysis
| Probe Gas | Common Analysis Temperature (K) | Cross-Sectional Area (Ų/molecule) | Saturation Pressure (P₀) Range (Torr) | Relative Cost & Safety | Key Advantages & Limitations |
|---|---|---|---|---|---|
| Nitrogen (N₂) | 77 (LN₂ bath) | 16.2 | ~760 | Low, inert | Standard. Ideal isotherm shape, widely available, established databases. Limited for ultra-low surface area. |
| Argon (Ar) | 77 (LN₂ bath) 87 (LAr bath) | 14.2 (77K on non-porous) ~13.8 (87K) | ~215 (87K) | Low, inert | Useful for microporous materials, avoids quadrupole moment issues of N₂. Requires proper P₀ measurement. |
| Krypton (Kr) | 77 (LN₂ bath) | 20.2 (common value) | ~2.5 | High, inert | For low surface area (< 1 m²/g). Higher sensitivity due to low P₀. Cross-sectional area is substrate-dependent. |
| Carbon Dioxide (CO₂) | 273 (ice bath) | 17.0 (at 273K) | ~26,000 | Low, asphyxiant | Used for ultramicroporosity characterization. Higher temperature avoids diffusion limitations. |
The Rationale for Nitrogen at 77K as the Standard
- Optimal Isotherm Shape: At 77K, N₂ provides a Type II (non-porous/macroporous) or Type IV (mesoporous) isotherm with a well-defined monolayer formation point (Point B), which is crucial for accurate BET analysis.
- Practicality: Liquid nitrogen (LN₂) is readily available, relatively inexpensive, and provides a stable, reproducible temperature of 77K.
- Well-Defined Properties: The cross-sectional area of the N₂ molecule (16.2 Ų) is empirically established and widely accepted. Its saturation pressure (P₀) is near ambient at 77K, allowing for easy and accurate measurement.
- Extensive Databases: Decades of use have resulted in vast libraries of reference isotherms for diverse materials, enabling comparative studies.
Detailed Protocol: BET Surface Area Measurement via N₂ at 77K
Title: Determination of Specific Surface Area of a Pharmaceutical API using Static Volumetric N₂ Physisorption at 77K.
Principle: A known amount of gas (N₂) is dosed onto a degassed sample at 77K. The quantity adsorbed at equilibrium is measured at a series of relative pressures (P/P₀). The BET equation is applied to the linear region of the isotherm (typically 0.05-0.30 P/P₀) to calculate the monolayer adsorbed volume, which is converted to surface area.
Materials & Equipment (The Scientist's Toolkit):
Table 2: Essential Research Reagent Solutions and Materials
| Item | Function/Description |
|---|---|
| High-Purity Nitrogen Gas | (>99.99% purity). The primary probe gas for adsorption. |
| Liquid Nitrogen (LN₂) | Cryogen to maintain sample analysis station at constant 77K. |
| Helium Gas | (>99.99% purity). Used for dead space volume (void volume) measurement and as a carrier gas in some systems. |
| Sample Tubes (with rods) | Typically made of borosilicate glass or stainless steel. Must be clean, dry, and of known tare weight. |
| Micromeritics ASAP 2460 or equivalent | Automated surface area and porosity analyzer. |
| High-Vacuum System | Capable of achieving at least 10⁻³ Torr for sample degassing. |
| Analytical Balance | Capable of weighing to ±0.01 mg. |
| Degas Station | Separate or integrated station for sample preparation. |
| Sample Saver or Filler Rod | Reduces the dead volume in the sample tube, improving measurement accuracy for low-surface-area samples. |
Pre-Treatment (Degassing) Protocol:
- Weighing: Accurately weigh a clean, dry sample tube. Add an appropriate mass of sample (target total adsorption volume > 5 cm³/g STP). Re-weigh to determine exact sample mass.
- Loading: Secure the sample tube onto the degas port of the analyzer or a separate degas station.
- Heating: Apply a controlled heating ramp (typically 10°C/min) under vacuum to a predefined degas temperature. Critical: The temperature must be below the sample's melting/decomposition point and be validated (e.g., 100°C for many APIs, 300°C for stable oxides). Consult material-specific literature.
- Hold: Maintain the temperature and vacuum (typically <10 µmHg) for a specified duration (often 2-12 hours) to remove physically adsorbed contaminants (water, vapors).
- Cooling & Backfill: After degassing, allow the sample to cool to ambient temperature under continued vacuum. Isolate and backfill the sample tube with inert gas (He or N₂).
- Transfer: Carefully transfer the sealed sample tube to the analysis port of the instrument.
Analysis Protocol:
- Installation: Install the sample tube onto the analysis port. Immerse the sample tube in a Dewar filled with LN₂ to maintain 77K throughout the analysis.
- Evacuation: Evacuate the sample tube to remove the backfill gas.
- Free Space Measurement: Introduce a known amount of helium into the sample tube. As He is not adsorbed at 77K, its expansion provides a measurement of the system's "dead volume" (void space).
- Adsorption Analysis: Evacuate the He. The instrument then performs a series of N₂ dose-equilibration-pressure measurement steps. Small, incremental doses of N₂ are introduced. The system pressure is monitored until equilibrium is reached (pressure change < a predefined threshold per unit time). The amount adsorbed is calculated from the pressure change using gas laws.
- Data Collection: This process is repeated across a predefined relative pressure (P/P₀) range, typically from ~10⁻⁵ up to 0.995, generating the adsorption branch of the isotherm.
- Desorption (Optional): For porosity analysis, the process is reversed by slowly removing N₂ to generate the desorption branch.
Data Analysis Protocol (BET Surface Area):
- Extract equilibrium adsorption data (Volume adsorbed at STP, V, vs. P/P₀).
- Apply the BET equation in its linear form:
(P/P₀) / [V(1 - P/P₀)] = 1/(V_m * C) + (C - 1)/(V_m * C) * (P/P₀)where V_m is the monolayer volume and C is the BET constant. - Plot
(P/P₀) / [V(1 - P/P₀)]vs.P/P₀for the linear region (typically 0.05-0.30 P/P₀). - Determine the slope
s = (C - 1)/(V_m * C)and intercepti = 1/(V_m * C)from linear regression. - Calculate
V_m = 1 / (s + i). - Calculate the specific surface area (S):
S = (V_m * N_A * σ) / (m * V_{molar})whereN_Ais Avogadro's number,σis the cross-sectional area of N₂ (16.2 x 10⁻²⁰ m²),mis the sample mass (g), andV_{molar}is the molar volume at STP (22414 cm³/mol).
Visualizing the BET Workflow and Gas Selection Logic
Diagram Title: BET Surface Area Analysis Workflow & Gas Selection
Diagram Title: Logic for N₂ at 77K as the Standard Probe Gas
1.0 Introduction: Context Within BET Method Research
The Brunauer-Emmett-Teller (BET) theory is the cornerstone of specific surface area (SSA) analysis for porous materials in catalysis, drug formulation, and nanomaterials. However, its application is governed by stringent assumptions: multilayer adsorption of inert gases (typically N₂ at 77 K) on energetically homogeneous surfaces with no lateral interactions. This research note, part of a broader thesis on advancing surface area metrology, details the quantitative and qualitative conditions where these assumptions fail, leading to significant analytical error.
2.0 Quantitative Limitations: Data Summary
Table 1: Common Material Classes and BET Application Limits
| Material Class / Condition | Typical Pore Size / Feature | Key Limitation & Error Magnitude | Recommended Diagnostic |
|---|---|---|---|
| Microporous Materials (Zeolites, MOFs) | < 2 nm | Micropore filling violates the BET multilayer model. Overestimates SSA by 20-100%. | Use t-plot or NLDFT methods. Check linear region of BET plot (n=1). |
| Mesoporous Materials with High Adsorbate-Affinity | 2-50 nm | Strong fluid-wall interactions cause premature capillary condensation. Underestimates SSA by 10-30%. | Analyze adsorption branch with BJH/KJS; review adsorbate choice. |
| Non-Porous or Macroporous Low-Energy Surfaces | > 50 nm | Weak adsorbate-surface interaction leads to poor monolayer formation. C-values < 20 indicate unreliability. | Use adsorbates with higher affinity (Kr at 77 K). |
| Chemically Heterogeneous Surfaces (Functionalized APIs) | N/A | Energetic heterogeneity invalidates constant heat of adsorption. C-value is an average, SSA error variable. | Perform isosteric heat of adsorption analysis. |
| Flexible or "Breathing" Frameworks | Variable | Hysteresis and pore opening alter the adsorption mechanism. SSA is path-dependent. | Model entire adsorption/desorption isotherm. |
Table 2: BET Validity Criteria from IUPAC Recommendations (2015)
| Criterion | Valid Range | Interpretation of Deviation |
|---|---|---|
| Applied Relative Pressure (P/P₀) Range | 0.05 - 0.30 (often narrower) | Extension beyond indicates inappropriate fitting. |
| BET Transform Plot Correlation (R²) | > 0.9995 | Lower R² suggests poor linearity, model misfit. |
| C Constant from BET Plot | Positive and "Reasonably High" | Negative C indicates misapplication; very low C (<20) suggests weak adsorption. |
| Monolayer Capacity (nₘ) Intercept | Must be positive | Negative intercept is physically meaningless, indicates failure. |
3.0 Experimental Protocols for Diagnosing BET Theory Failure
Protocol 3.1: Assessing BET Plot Linearity and Validity Range
Objective: To determine the appropriate relative pressure range for BET analysis and identify deviations from linearity. Materials: High-resolution volumetric or gravimetric sorption analyzer, high-purity (99.999%) adsorbate gas (N₂, Ar, Kr), sample cell, degassing station. Procedure:
- Pre-treat sample per relevant standard (e.g., ISO 9277:2022).
- Collect a high-resolution adsorption isotherm (≥ 30 data points) for N₂ at 77 K from P/P₀ = 1e-7 to 0.995.
- Transform data into the BET equation linear form: ( \frac{P/P₀}{n(1-P/P₀)} = \frac{1}{nm C} + \frac{C-1}{nm C}(P/P_0) )
- Plot ( \frac{P/P₀}{n(1-P/P₀)} ) vs. ( P/P_0 ).
- Systematically vary the selected pressure range (e.g., 0.05-0.15, 0.05-0.20, 0.05-0.25, 0.05-0.30). For each range, calculate the correlation coefficient (R²), the intercept, and the C constant.
- Diagnostic: The valid range is the one yielding a linear plot (R² > 0.9995) with a positive intercept. The calculated nₘ (monolayer capacity) should remain stable across adjacent, valid ranges.
Protocol 3.2: Comparative Analysis Using Alternative Adsorbates
Objective: To detect surface energy heterogeneity and micropore effects by comparing isotherms from different probe gases. Materials: Sorption analyzer capable of cryogenic (77 K, 87 K) and/or temperature-controlled measurements, N₂, Ar (87 K), CO₂ (273 K). Procedure:
- Using the same pre-treated sample aliquot, perform three adsorption experiments: a. Standard N₂ isotherm at 77 K. b. Ar isotherm at 87 K (Ar boiling point). c. CO₂ isotherm at 273 K (ice bath).
- Apply the BET method to the N₂ and Ar isotherms within their respective valid ranges (from Protocol 3.1).
- For CO₂, apply a Dubinin-Radushkevich or NLDFT model suited for micropore analysis at 273 K.
- Diagnostic: A >20% discrepancy between the SSA from N₂ and Ar suggests significant surface energy heterogeneity. A significantly higher SSA from CO₂ vs. N₂ indicates predominant microporosity inaccessible to N₂ at 77 K.
4.0 Visualizing BET Theory Breakdown and Diagnostic Pathways
Diagram 1: Diagnostic Flowchart for BET Applicability (100 chars)
5.0 The Scientist's Toolkit: Research Reagent Solutions
Table 3: Essential Materials for Advanced Surface Area Analysis
| Item | Function/Benefit | Application Note |
|---|---|---|
| High-Purity N₂ Gas (99.999%) | Standard BET adsorbate. Impurities (e.g., H₂O) skew low-pressure data. | Essential for all BET measurements. Use with molecular sieve traps. |
| High-Purity Kr Gas (99.995%) | Low saturation pressure (P₀) enhances sensitivity for low-SSA materials (< 1 m²/g). | Critical for drug substance (API) and non-porous material analysis. |
| Ar Gas (99.999%) & Liquid Argon | Ar at 87 K (saturated with solid) avoids quadrupole moment of N₂, probing surface energy differently. | Diagnosing surface heterogeneity; standard for microporosity analysis. |
| CO₂ (99.99%) & Ice Bath (273 K) | Higher temperature and kinetic energy allow CO₂ to access ultramicropores (< 0.7 nm). | Complementary analysis for carbonaceous materials, MOFs, zeolites. |
| Reference Material (e.g., Alumina) | Certified surface area standard for instrument validation and method calibration. | Mandatory for QC, ensuring inter-laboratory reproducibility (ISO 17025). |
| Non-Porous Silica (e.g., LiChrospher) | Used to generate reference "t-curves" for t-plot analysis, deconvoluting micro/mesoporosity. | Required for accurate micropore volume and external surface area determination. |
| Automated Degassing Station | Provides controlled, reproducible sample pretreatment (temperature, vacuum, time). | Eliminates pre-adsorbed contaminants, a major source of error. |
Step-by-Step BET Protocol & Pharmaceutical Use Cases
Within the context of advancing BET (Brunauer-Emmett-Teller) method research for surface area and porosity analysis, the selection of analytical equipment is paramount. The core distinction lies between volumetric (or manometric) and gravimetric adsorption analyzers. This application note details their principles, comparative protocols, and specific applications in pharmaceutical development, where precise surface area measurement of active pharmaceutical ingredients (APIs) and excipients is critical for bioavailability and stability.
Core Principles & Comparative Analysis
Volumetric Analyzers determine gas adsorption by precisely measuring pressure changes in a calibrated volume system. A known quantity of adsorbate gas is dosed, and the amount adsorbed is calculated from the pressure drop using gas laws.
Gravimetric Analyzers directly measure the mass change of the sample during gas adsorption using a highly sensitive microbalance. The amount adsorbed is measured gravimetrically, often accounting for buoyancy effects.
Table 1: Quantitative Comparison of Volumetric vs. Gravimetric Analyzers for BET Surface Area Measurement
| Parameter | Volumetric Analyzer | Gravimetric Analyzer |
|---|---|---|
| Primary Measurement | Pressure & Volume (Gas Laws) | Mass Change (Microbalance) |
| Typical Resolution | ~0.01 m²/g | ~0.001 m²/g (with superior balance) |
| Sample Mass Range | 50 mg - 2 g | 10 mg - 1 g (smaller typical) |
| Degas Temperature | Up to 450°C | Usually ≤ 150°C (balance limit) |
| Buoyancy Correction | Required, via void volume calibration | Required, more complex |
| Adsorbate Flexibility | High (N₂, Ar, Kr, CO₂) | High, but vapor compatibility crucial |
| Key Advantage | Robust, high-temperature analysis, industry standard for BET | Direct mass measurement, superior for vapor studies |
| Key Limitation | Indirect measurement, dead volume critical | Sensitive to vibrations, lower temp limit |
Application Protocols
Protocol 1: Standard BET Surface Area Analysis of a Mesoporous API using a Volumetric Analyzer
Objective: To determine the specific surface area of a model API (e.g., Mesoporous Silica) using N₂ adsorption at 77 K via a volumetric system.
Research Reagent Solutions & Essential Materials:
- Analyte Gas (N₂, 99.999% purity): Primary adsorbate for BET analysis at 77 K.
- Degassing Station: For sample pre-treatment to remove physisorbed contaminants.
- Liquid Nitrogen Dewar: To maintain cryogenic (77 K) analysis temperature.
- High-Vacuum System: To achieve and maintain necessary vacuum (<10⁻³ mbar) for analysis.
- Reference Cells & Calibration Rods: For precise system volume calibration.
- Ultra-High Purity Helium (He, 99.999%): For free space (void volume) measurement.
Procedure:
- Sample Preparation: Accurately weigh (~100-200 mg) sample into a pre-tared analysis tube.
- Sample Degassing: Secure tube to degas port. Heat sample to 150°C under vacuum (<10⁻² mbar) for a minimum of 6 hours to remove adsorbed moisture and volatiles.
- Cool & Backfill: Isolate sample under vacuum, cool to ambient, and backfill with dry helium.
- Sample Tube Transfer: Transfer the sealed sample tube to the analysis port of the volumetric analyzer.
- System Evacuation: Evacuate the sample and manifold to ultra-high vacuum (<10⁻³ mbar).
- Free Space Measurement: Immerse sample cell in liquid N₂. Admit small doses of He and measure equilibrium pressure to calculate the cell's cold free space volume.
- Adsorption Isotherm: Evacuate He. Begin N₂ adsorption analysis by dosing precise gas quantities and recording equilibrium P/P₀. Collect data across the relative pressure range 0.05 to 0.30 for BET analysis and up to 0.99 for full isotherm.
- Data Processing: Use instrument software to apply BET equation to the 0.05-0.30 P/P₀ data range, ensuring a positive C constant and a linear fit with a correlation coefficient >0.9999.
Protocol 2: Water Vapor Sorption Analysis of a Hydrophilic Polymer using a Gravimetric Analyzer
Objective: To measure the water adsorption isotherm of a polymer at 25°C to inform excipient stability and hydration state.
Research Reagent Solutions & Essential Materials:
- Vapor Generation System: Precise control of relative humidity (RH) via mass flow controllers or pressure variation.
- Microbalance (≤ 0.1 µg resolution): Core component for mass measurement.
- Temperature-Controlled Water Bath: Maintains precise analyzer temperature (±0.1°C).
- Buoyancy Calibration Weights: For accurate system buoyancy correction.
- High-Purity Nitrogen Carrier Gas: For generating dry and RH-controlled atmospheres.
Procedure:
- Sample & Tare Preparation: Load sample (~20-50 mg) into a pan on the microbalance hang-down wire. Load a counterweight tare on the reference side.
- System Stabilization: Seal the analysis chamber. Evacuate or purge with dry N₂. Stabilize system at 25.0°C and 0% RH until a stable baseline mass is achieved (drift <0.001 mg/min).
- Buoyancy Correction Run: Perform a blank buoyancy calibration run using inert weights under identical temperature and pressure conditions.
- Sorption Cycle: Program a dynamic vapor sorption (DVS) method. Typically, stepwise increments of 10% RH from 0% to 90% RH, holding at each step until equilibrium (dm/dt < 0.01%/min over 10 min).
- Desorption Cycle: Reverse the RH steps from 90% down to 0% to assess hysteresis.
- Data Processing: Software corrects raw mass data for buoyancy using the calibration file. Plot equilibrium mass uptake vs. %RH to generate the adsorption/desorption isotherm. Surface area can be estimated if a monolayer is evident.
Visualization of Method Selection & Workflow
BET Analyzer Selection Decision Tree
Volumetric vs. Gravimetric Core Pathways
Within the broader thesis on advancing the Brunauer-Emmett-Teller (BET) method for accurate surface area analysis of porous pharmaceuticals, meticulous sample preparation is the most critical, yet often overlooked, determinant of success. The pre-adsorption protocol, specifically the outgassing (or degassing) step, directly dictates data quality by removing physisorbed contaminants without altering the material's intrinsic porous structure. This application note details contemporary, evidence-based best practices for outgassing temperature, time, and protocols, targeting researchers in drug development where material integrity is paramount.
Fundamental Principles and Impact on BET Analysis
Outgassing prepares a solid sample for surface area analysis by removing adsorbed species (e.g., water vapor, solvents, atmospheric gases) from its pores and surface. Inadequate outgassing leads to underestimated surface area and pore volume, while excessive conditions can induce sintering, phase changes, or chemical decomposition, resulting in structural collapse and erroneous data. The core objective is to achieve a "clean" and stable surface under high vacuum or flowing inert gas, representative of the material's true state.
Quantitative Guidelines: Temperature and Duration
The optimal outgassing temperature is intrinsically linked to a material's thermal stability and the nature of the adsorbates. The following table synthesizes current recommendations from instrument manufacturers and peer-reviewed literature.
Table 1: Recommended Outgassing Parameters for Common Pharmaceutical Materials
| Material Class | Typical Recommended Temperature Range (°C) | Typical Recommended Time (hours) | Critical Notes & Rationale |
|---|---|---|---|
| Metal-Organic Frameworks (MOFs) | 80 - 150 | 6 - 24 | Temperature MUST remain below framework collapse/decomposition point (TGA analysis is essential). Use gentle heating rates (1-5°C/min). |
| Mesoporous Silica (e.g., MCM-41, SBA-15) | 200 - 300 | 6 - 12 | High temperatures required to remove chemisorbed water from silanol groups. Stability is generally high. |
| Active Pharmaceutical Ingredients (APIs) / Organic Crystals | 25 - 50 (Ambient) | 8 - 24 | Use ultra-gentle, vacuum-only degassing at ambient temperature to prevent polymorphic transition or melting. |
| Carbonaceous Materials (Activated Carbon, Graphite) | 250 - 350 | 8 - 12 | Robust materials; high temperatures needed to desorb strong contaminants. Verify absence of oxidation under flowing gas. |
| Polymer-Based Carriers | 25 - 80 (Below Tg) | 10 - 24 | Temperature must be kept significantly below the glass transition temperature (Tg) to prevent structural relaxation and pore collapse. |
| Metal Oxides (e.g., Alumina, Titania) | 150 - 250 | 6 - 10 | Standard pretreatment for inorganic oxides. Time varies with specific surface area. |
General Protocol: A common safe-start protocol for unknown but thermally sensitive materials is degassing at 80°C for 12 hours under dynamic vacuum. The ultimate criterion is a stable, low outgassing rate (e.g., pressure rise < 5 μbar/min upon valve closure to sample).
Detailed Experimental Protocols
Protocol A: Standard Outgassing for Thermally Stable Porous Materials
Objective: To prepare mesoporous silica or stable metal oxides for BET surface area and BJH pore size distribution analysis.
Materials & Equipment:
- BET Surface Area and Porosimetry Analyzer with degassing port.
- Sample tube with sealed-end bulb.
- Microbalance (accuracy ±0.01 mg).
- Furnace or heating mantle with programmable controller.
- High-vacuum system (capable of <10^-3 mbar).
- Liquid nitrogen for cold trap.
Procedure:
- Weighing: Accurately weigh the clean, empty sample tube. Add 50-200 mg of sample. Re-weigh to determine exact sample mass.
- Mounting: Secure the sample tube to the degassing station. Attach a cold trap filled with liquid nitrogen between the sample and vacuum pump to capture volatiles.
- Initial Evacuation: Apply gentle vacuum at room temperature for 30 minutes to remove loosely bound adsorbates.
- Heating: Program the heater to ramp to the target temperature (e.g., 250°C for silica) at a rate of 3°C per minute.
- Isothermal Hold: Maintain the target temperature under continuous dynamic vacuum for 6-12 hours.
- Cool-down & Backfill: After the hold period, turn off the heater and allow the sample to cool to ambient temperature under continuous vacuum. Once cool, backfill the sample tube with ultra-pure, dry helium or nitrogen gas.
- Sealing: Immediately cap the sample tube to prevent re-adsorption. It is now ready for analysis.
Protocol B: Mild Degassing for Thermally Labile Pharmaceutical Solids
Objective: To prepare a moisture-sensitive API or polymer carrier without inducing phase changes.
Procedure:
- Weighing: Follow Step 1 from Protocol A.
- Mounting: Attach the sample tube to the degassing station with a cold trap.
- Extended Ambient Degassing: Apply a high vacuum (<10^-3 mbar) at room temperature (25-40°C) for a minimum of 18 hours. No active heating is applied.
- Stability Test: Isolate the sample from the pump by closing a valve. Monitor the pressure rise over 5 minutes. A rate below 2-5 μbar/min indicates sufficient degassing.
- Completion: If the rate is acceptable, proceed to cool-down and backfill as in Protocol A (Steps 6-7). If not, continue degassing.
Visualization of the Decision Workflow
Title: Decision Workflow for Selecting Outgassing Protocol
The Scientist's Toolkit: Key Research Reagent Solutions
Table 2: Essential Materials for Sample Preparation
| Item | Function in Outgassing/BET Preparation |
|---|---|
| High-Purity Sample Tubes (with bulbs) | Contain the sample during degassing and analysis; the bulb design minimizes dead volume. |
| Ultra-High Purity (UHP) Nitrogen or Helium Gas (99.999%) | Used for backfilling degassed samples to prevent re-adsorption prior to analysis. |
| Liquid Nitrogen Cold Trap | Protects the vacuum pump and captures condensable vapors (water, solvents) during degassing. |
| Temperature-Programmable Degas Station | Provides controlled, reproducible heating under vacuum or inert gas flow. |
| Microbalance (±0.01 mg) | Enables accurate sample mass measurement, critical for final surface area calculation (m²/g). |
| Vacuum Grease (High-Temp, Low-Vapor) | Ensures airtight seals on joints; must withstand degassing temperature without outgassing itself. |
| TGA/DSC Instrument | Critical pre-screening tool to determine material thermal stability and safe outgassing temperature limits. |
| Glass Wool or Plugs | Used to prevent sample particulates from being entrained into the analysis manifold during degassing. |
The determination of specific surface area (SSA) via the Brunauer-Emmett-Teller (BET) method is a cornerstone of material characterization in pharmaceutical development, impacting critical attributes from drug carrier performance to catalyst efficiency and powder flow. This application note, framed within a broader thesis on BET methodology, details the experimental protocols for data collection during the adsorption isotherm measurement—the foundational step from which all subsequent analysis derives. The precision of this phase dictates the validity of the final SSA calculation.
Core Protocol: The Physisorption Isotherm Experiment
Objective: To measure the volume of nitrogen gas adsorbed by a solid sample across a defined range of relative pressures (P/P₀) at cryogenic temperature (typically 77.35 K using liquid nitrogen).
Detailed Methodology:
A. Pre-Measurement Sample Preparation (Activation)
- Weighing: Accurately weigh a clean, dry sample tube with the solid sample. The optimal sample mass depends on the expected SSA (see Table 1).
- Degassing: Mount the sample tube on a degassing station.
- Apply vacuum and heat (temperature and duration are material-specific) to remove physically adsorbed contaminants (e.g., water vapor, atmospheric gases).
- Common protocol for molecular sieves or metal-organic frameworks: 150-300°C under vacuum for 6-12 hours.
- For thermally sensitive pharmaceuticals: Use ambient to 50°C under vacuum for 4-8 hours.
- Outgassing Verification: Monitor pressure rise upon isolating the sample (leak test) to confirm complete removal of adsorbed species.
B. Isotherm Data Collection
- Cooling: Transfer the degassed sample to the analysis station and immerse in a cryogenic bath (liquid N₂).
- Dosing & Equilibrium: The analyzer introduces controlled doses of high-purity N₂ gas into the sample cell.
- Pressure Measurement: After each dose, the system monitors pressure until equilibrium is established (change < a predefined threshold over time).
- Adsorbed Quantity Calculation: The volume of gas adsorbed is calculated using manometric (volumetric) or gravimetric principles from the equilibrium pressure.
- Incremental Pressure Increase: The relative pressure (P/P₀) is incrementally increased from high vacuum (≈10⁻⁵) to near saturation (≈0.99-0.995) to collect the adsorption branch. A subsequent stepwise decrease yields the desorption branch.
Critical Measurement Points & Data Quality Indicators:
- Monolayer Completion (Point B): The inflection point on the isotherm where the monolayer is statistically filled.
- Hysteresis Loop: The disparity between adsorption and desorption branches indicates mesoporosity (2-50 nm pores). Its shape informs pore geometry (e.g., ink-bottle, slit-like).
- Saturation Plateau: At high P/P₀, micropores (<2 nm) and mesopores are filled via capillary condensation.
Data Presentation: Key Parameters & Quality Criteria
Table 1: Recommended Sample Mass Based on Expected Surface Area
| Expected BET Surface Area (m²/g) | Recommended Sample Mass (g) | Rationale |
|---|---|---|
| > 100 (e.g., MOFs, activated carbon) | 0.05 - 0.10 | Avoids excessive total adsorption, maintains instrument sensitivity. |
| 10 - 100 (e.g., catalysts, silica) | 0.10 - 0.30 | Balances signal strength with manageable dead volume. |
| 1 - 10 (e.g., some APIs, coarse powders) | 0.50 - 1.00 | Ensures measurable adsorption volume relative to system volume. |
| < 1 (e.g., dense ceramics) | ≥ 2.00 | Maximizes the absolute amount of gas adsorbed for reliable detection. |
Table 2: Critical Isotherm Data Quality Checklist
| Parameter | Target/Checkpoint | Purpose & Consequence of Deviation |
|---|---|---|
| Degassing Temperature | Must be below sample decomposition temp. | Prevents chemical alteration; incomplete degassing leads to underestimated adsorption. |
| Equilibrium Time | Must be sufficient for each point (typically 5-60s). | Non-equilibrium data invalidates the assumption underlying the BET theory. |
| Number of Data Points | 5-8 points in the BET linear range (0.05-0.30 P/P₀). | Fewer points reduce regression reliability; points outside range violate BET assumptions. |
| C-Constant (from BET plot) | Positive value (typically 50-250). | Negative or very low C suggests inappropriate sample or analysis range, invalidating result. |
| Saturation Pressure (P₀) | Measured continuously near the sample. | Accurate P₀ is critical for correct P/P₀ calculation; use of fixed value introduces error. |
The Scientist's Toolkit: Essential Materials & Reagents
Table 3: Key Research Reagent Solutions & Materials
| Item | Function & Criticality |
|---|---|
| High-Purity (≥99.999%) N₂ Gas | The adsorbate. Impurities (e.g., hydrocarbons, H₂O) competitively adsorb, skewing isotherm data. |
| High-Purity He Gas | Used for free space (dead volume) measurement. Impurities affect volume calibration. |
| Liquid Nitrogen (LN₂) | Provides constant 77K bath for N₂ physisorption. Level must be maintained for stable temperature. |
| Vacuum Grease (Apiezon type) | Seals joints on sample tubes and manifolds. Must be low-volatility to prevent outgassing interference. |
| Quantachrome or Micromeritics Sample Tubes | Calibrated glass cells of known tare weight and volume. Must be scrupulously clean. |
| Non-Porous Reference Material (e.g., Alumina) | Used for system calibration and periodic validation of instrument performance. |
| Glass Wool or Plugs | To contain fine powder samples during degassing, preventing entrainment. |
Visualizing the BET Isotherm Workflow & Analysis Logic
Diagram Title: BET Isotherm Data Collection & Analysis Workflow
Diagram Title: Logic Flow for Validating BET Analysis from Isotherm Data
Within a comprehensive thesis on the Brunauer-Emmett-Teller (BET) method for surface area measurement, the correct linearization of adsorption isotherm data and subsequent calculation form the critical, interpretative core. The BET equation transforms raw physisorption data into the monolayer adsorbed gas volume (Vm) and the material-specific surface area. Misapplication at this stage, particularly regarding the selection of the linear pressure range, is a prevalent source of error that undermines the validity of the entire analysis. These application notes provide definitive protocols for the accurate linearization and calculation procedure, ensuring data integrity for researchers in material science and pharmaceutical development.
Theoretical Framework: The BET Linearization
The multi-layer adsorption theory is expressed in its linearized form as: [ \frac{P/P0}{n(1 - P/P0)} = \frac{1}{nm C} + \frac{C - 1}{nm C} (P/P_0) ] Where:
- (P): Equilibrium pressure
- (P_0): Saturation pressure of adsorbate at experimental temperature
- (n): Quantity of gas adsorbed at (P)
- (n_m): Monolayer capacity
- (C): BET constant related to adsorption enthalpy
A plot of ( \frac{P/P0}{n(1 - P/P0)} ) versus (P/P0) should yield a straight line in the appropriate relative pressure range. The slope ((s)) and intercept ((i)) are used to calculate (nm) and (C). [ nm = \frac{1}{s + i}, \quad C = \frac{s}{i} + 1 ] The total specific surface area ((S{BET})) is then: [ S{BET} = \frac{nm NA \sigma}{m} ] Where (NA) is Avogadro's number, (\sigma) is the cross-sectional area of the adsorbate molecule (0.162 nm² for N₂ at 77 K), and (m) is the sample mass.
Critical Protocol: Establishing the Valid Linear Range
The IUPAC and ISO standards dictate that the BET plot is only valid for data points where the term (n(1-P/P0)) continuously increases with (P/P0). The recommended linear relative pressure ((P/P_0)) range is typically 0.05 to 0.30. However, this must be validated for each material.
Detailed Experimental Methodology
Procedure:
- Data Acquisition: Obtain at least 5-7 adsorption data points in the (P/P_0) range of 0.01 to 0.30 using a calibrated volumetric or gravimetric sorption analyzer.
- Initial Transformation: For each data point ((P/P0), (n)), calculate the y-coordinate for the BET plot: (y = \frac{P/P0}{n(1 - P/P_0)}).
- Iterative Linear Regression: a. Start with data points in the range 0.05-0.30. b. Perform a least-squares linear regression. Calculate the correlation coefficient (R²), slope ((s)), and intercept ((i)). c. Verify that the calculated (C) value is positive. d. Apply the "Roquerol Criteria": i. The quantity (n(1-P/P0)) must increase monotonically with (P/P0) over the selected points. ii. The monolayer capacity (n_m) calculated must correspond to a point on the isotherm within the selected range. e. If criteria fail, systematically narrow the upper limit (e.g., to 0.25, then 0.20) and repeat regression until all criteria are satisfied.
- Calculation: Using the final validated slope and intercept, calculate (nm), (C), and ultimately (S{BET}).
Quantifiable Criteria for Linearity Validity
Table 1: Summary of BET Linearization Validation Criteria and Outcomes
| Criterion | Optimal/Valid Condition | Consequence of Deviation |
|---|---|---|
| Relative Pressure Range | 0.05 ≤ P/P₀ ≤ 0.30 (Guideline) | Range must be narrowed per Roquerol criteria. |
| Correlation Coefficient (R²) | > 0.9995 for high accuracy | Lower R² indicates poor fit, invalid range, or microporosity. |
| BET Constant (C) | Positive value, typically 50-200 for mesoporous materials. | Negative intercept/C indicates invalid range or micropore filling. |
| Monotonic Increase | (n(1-P/P_0)) must always increase with P/P₀ over selected range. | Failure indicates the upper pressure limit is too high. |
Visualization: BET Analysis Workflow
Title: BET Surface Area Calculation and Validation Workflow
The Scientist's Toolkit: Essential Research Reagents & Materials
Table 2: Key Reagents and Materials for BET Surface Area Analysis
| Item | Function & Specification |
|---|---|
| High-Purity Adsorbate Gas | Typically N₂ (99.999%+) or Kr for low surface area samples. Provides the molecular probe for adsorption measurement. |
| UHP Helium or Hydrogen | Used for dead-volume calibration and sample preconditioning (purge gas). Must be 99.999% pure. |
| Reference Material | Certified standard (e.g., alumina, carbon black) with known surface area. Used for instrument and method validation. |
| Sample Tubes with Rods | Precision glassware for holding sample. Must be scrupulously clean and degassed to prevent contamination. |
| Liquid Nitrogen Dewar | Maintains a constant 77 K bath temperature for N₂ adsorption. Requires a stable, level holder. |
| Microbalance (Gravimetric) | For precise sample mass measurement pre- and post-degassing (if using gravimetric method). |
| Temperature Sensor | Accurately monitors the liquid nitrogen bath temperature for precise P₀ determination. |
| Regenerable Desiccant | Protects the analyzer manifold from moisture contamination during analysis and sample transfer. |
Within the context of a broader thesis on BET method for surface area measurement research, this application note details its critical role in pharmaceutical development. Precise surface area and porosity data are essential for predicting and controlling the performance, stability, and manufacturability of drug products.
Application Note 1: API Characterization and Polymorph Control
The specific surface area of an Active Pharmaceutical Ingredient (API) directly influences dissolution rate, a key determinant of bioavailability. BET analysis is indispensable for characterizing different polymorphic and morphological forms generated during crystallization and milling processes.
Table 1: BET Surface Area Data for API Polymorphs
| API Lot & Processing Method | Polymorph Form | BET Surface Area (m²/g) | Average Pore Diameter (nm) |
|---|---|---|---|
| Crystallization Batch A | Form I | 0.45 ± 0.03 | Non-porous |
| Crystallization Batch B | Form II | 0.68 ± 0.05 | Non-porous |
| Jet-Milled API (from Form I) | Form I | 4.32 ± 0.15 | Non-porous |
| Spray-Dried Dispersion | Amorphous | 8.91 ± 0.20 | 18.5 |
Protocol 1: BET Analysis of API Polymorphs
- Sample Preparation: Accurately weigh 500-1000 mg of API into a clean, pre-tared analysis tube. Use a larger sample mass for low-surface-area crystals.
- Degassing: Seal the tube and degas the sample using a Smart VacPrep or equivalent. Apply a vacuum at 25°C for 1 hour, then ramp to 40°C (or below polymorph transition temp) for a minimum of 6 hours to remove physisorbed contaminants.
- Analysis: Transfer the tube to a surface area analyzer (e.g., Micromeritics 3Flex, Anton Paar NovaTouch). Immerse the sample cell in a liquid nitrogen bath (77 K).
- Data Collection: Perform a 5-point BET analysis with nitrogen adsorbate across a relative pressure (P/P₀) range of 0.05 to 0.30.
- Calculation: Use the instrument software to apply the BET equation to the adsorption isotherm data, reporting surface area in m²/g. Perform t-plot or DFT methods to assess microporosity.
BET Workflow for API Analysis
The Scientist's Toolkit: API Characterization
| Item | Function |
|---|---|
| High-Resolution BET Analyzer | Measures low-pressure gas adsorption with high accuracy for precise surface area calculation. |
| Smart VacPrep Degasser | Removes adsorbed volatiles without altering sample morphology via controlled temperature and vacuum. |
| 9 mm Large-Rod Sample Tubes | Accommodates larger sample masses for low-surface-area crystalline APIs to improve signal-to-noise. |
| Ultra-High Purity (UHP) N₂ & He Gases | UHP N₂ is the adsorbate; UHP He is used for dead volume calibration. Impurities skew results. |
| Liquid Nitrogen Dewar & Level Sensor | Maintains constant 77 K temperature for cryogenic adsorption measurements. |
Application Note 2: Excipient Screening for Tablet Formulation
The functionality of direct compression excipients like microcrystalline cellulose (MCC) and silica is governed by surface area and porosity, affecting compaction, flow, and API-excipient interactions.
Table 2: BET Data for Common Tablet Excipients
| Excipient (Brand) | Grade | BET Surface Area (m²/g) | Total Pore Volume (cm³/g) | Primary Function |
|---|---|---|---|---|
| Microcrystalline Cellulose | PH-101 | 1.1 ± 0.1 | 0.004 | Diluent/Binder |
| Microcrystalline Cellulose | PH-200 | 0.9 ± 0.1 | 0.003 | Diluent (Improved Flow) |
| Colloidal Silicon Dioxide | Aerosil 200 | 200 ± 25 | 0.35 | Glidant/Anti-caking |
| Lactose Monohydrate | Inhalac 230 | 0.4 ± 0.05 | 0.001 | Diluent/Filler |
| Magnesium Stearate | Non-bovine | 5.8 ± 0.5 | 0.02 | Lubricant |
Protocol 2: Porosity Analysis of Excipient Blends
- Sample Preparation: Gently blend API with key excipients (e.g., MCC, silica) for 10 minutes in a turbula mixer. Weigh 300-600 mg of the blend into an analysis tube.
- Degassing: Degas at 40°C for 4 hours under vacuum to remove moisture without inducing polymorphic changes in any component.
- Full Isotherm Analysis: Perform a full N₂ adsorption-desorption isotherm from P/P₀ ~0.01 to 0.99.
- Hysteresis Analysis: Examine the adsorption-desorption hysteresis loop to identify pore shape (ink-bottle, slit-shaped).
- DFT/BJH Calculation: Apply Density Functional Theory (DFT) or Barrett-Joyner-Halenda (BJH) models to the desorption branch to calculate pore size distribution from 1-100 nm.
Excipient Properties Affect Final Product
Application Note 3: Inhalation Powder Aerodynamic Performance
For Dry Powder Inhalers (DPIs), the aerodynamic performance of carrier-based formulations (e.g., lactose with API) is controlled by surface adhesion forces, which correlate with carrier surface area and nano-roughness.
Table 3: BET Data vs. Performance of Inhalation Lactose
| Lactose Carrier Grade | BET Surface Area (m²/g) | Fines Content (%) | Emitted Dose (% label claim) | Fine Particle Fraction (<5 µm) |
|---|---|---|---|---|
| Inhalac 70 (Base) | 0.3 | 0.5 | 78.2 ± 2.1 | 21.5 ± 1.8 |
| Inhalac 70 (Sieve Classified) | 0.4 | 2.5 | 85.5 ± 1.5 | 32.8 ± 2.0 |
| Engineered Porous Lactose | 12.5 | <0.1 | 92.1 ± 1.0 | 48.5 ± 1.5 |
Protocol 3: Surface Area Analysis of DPI Formulations
- Sample Handling: Use a glovebox under controlled humidity (RH <20%) to handle hygroscopic inhalation powders. Weigh 200-400 mg carefully.
- Low-Temperature Degassing: Degas at 25°C for 12 hours to avoid sintering lactose or altering the API-carrier interface. Use a low outgassing rate.
- Low-Pressure Multipoint BET: Perform a 7-point BET analysis in the P/P₀ range 0.01-0.20. Use Kr adsorption for very low surface areas (<1 m²/g) if necessary.
- Complementary Morphology: Analyze the same sample via mercury porosimetry (for larger inter-particle voids) or atomic force microscopy (AFM) to correlate BET data with nano-roughness.
- Correlation: Plot Fine Particle Fraction (FPF) data from next-generation impactor (NGI) studies versus BET surface area to establish a predictive relationship.
Surface Area Drives DPI Performance
The accurate characterization of porous materials is foundational to their advanced application. The Brunauer-Emmett-Teller (BET) method for surface area measurement provides the critical quantitative framework for evaluating the performance of Metal-Organic Frameworks (MOFs) and mesoporous silica. Within a thesis on BET method development, this article details specific applications where precise surface area and pore volume data directly correlate to functional efficacy in drug delivery and catalysis. These application notes and protocols are designed for researchers leveraging BET data to engineer next-generation functional materials.
Application Notes
MOFs for Targeted Drug Delivery
The ultra-high surface area (often > 2000 m²/g) and tunable pore chemistry of MOFs, as quantified by BET analysis, make them ideal for high-capacity, stimuli-responsive drug carriers. BET isotherms can differentiate between micropores (for drug hosting) and mesopores (for larger biomolecule transport), guiding material selection.
Mesoporous Silica Nanoparticles (MSNs) for Controlled Release
Ordered mesoporous silica (e.g., MCM-41, SBA-15) exhibits well-defined pore sizes (2-10 nm) and high surface areas (∼1000 m²/g), enabling controlled drug loading and release kinetics. BET surface area and Barrett-Joyner-Halenda (BJH) pore size distribution are mandatory quality control metrics for batch consistency in pharmaceutical development.
MOFs and Mesoporous Materials as Catalyst Supports
High surface area maximizes active site dispersion, while pore architecture dictates reactant/product diffusion. BET analysis correlates material properties with catalytic turnover frequency (TOF) and stability. Shape-selective catalysis is particularly dependent on precise pore size measurements derived from BET and related methods.
Table 1: Quantitative Comparison of Representative Materials
| Material | Typical BET Surface Area (m²/g) | Typical Pore Volume (cm³/g) | Primary Pore Size (nm) | Key Application Example |
|---|---|---|---|---|
| MOF-5 (IRMOF-1) | 3000 - 3800 | 1.0 - 1.3 | ~1.2 (Micro) | High-capacity drug loading (e.g., Ibuprofen) |
| ZIF-8 | 1300 - 1800 | 0.6 - 0.7 | ~0.34 (Micro) | pH-responsive drug delivery (e.g., Doxorubicin) |
| UiO-66 | 1000 - 1500 | 0.4 - 0.6 | ~0.6 (Micro) | Anticancer pro-drug activation |
| MCM-41 | 800 - 1200 | 0.8 - 1.2 | 2 - 4 (Meso) | Sustained small-molecule release |
| SBA-15 | 600 - 1000 | 0.8 - 1.2 | 5 - 10 (Meso) | Macromolecular (e.g., protein/antibody) delivery |
| Pt@MOF-199 Catalyst | 900 - 1200 (after loading) | 0.4 - 0.5 | 0.9 (Micro) | Benzene oxidation to phenol |
| Pd@SBA-15 Catalyst | 500 - 700 (after loading) | 0.7 - 1.0 | 6 - 8 (Meso) | Heck cross-coupling reactions |
Experimental Protocols
Protocol 1: Drug Loading and In Vitro Release from Mesoporous Silica (MCM-41)
Objective: To load a model drug (e.g., Ibuprofen) into MCM-41 and characterize its release profile in simulated physiological buffers.
Materials: See "Research Reagent Solutions" table.
Method:
- Activation of Carrier: Degas 100 mg of MCM-41 at 120°C under vacuum for 12 hours to remove adsorbed species. Record pre-loading BET surface area.
- Drug Loading: Prepare a 30 mg/mL solution of Ibuprofen in hexane. Incubate the activated MCM-41 with the drug solution (10 mL) at room temperature for 24 hours with gentle shaking.
- Washing & Drying: Separate the particles by centrifugation (10,000 rpm, 10 min). Wash the pellet twice with 5 mL of fresh hexane to remove surface-adsorbed drug. Dry the resulting drug-loaded MSNs (MSN-IBU) under vacuum overnight.
- Loading Efficiency: Determine drug loading by Thermogravimetric Analysis (TGA) or by quantifying the concentration of drug remaining in the supernatant via UV-Vis spectroscopy.
- In Vitro Release Study: a. Suspend 20 mg of MSN-IBU in 50 mL of Phosphate Buffered Saline (PBS, pH 7.4) in a jacketed vessel at 37°C with constant stirring. b. At predetermined time intervals (0.25, 0.5, 1, 2, 4, 6, 8, 24 h), withdraw 1 mL of release medium and filter through a 0.22 µm syringe filter. c. Analyze the filtrate by HPLC or UV-Vis to determine drug concentration. Replenish the vessel with 1 mL of fresh pre-warmed PBS after each sampling. d. Plot cumulative drug release (%) vs. time.
Validation: Post-loading BET analysis should show a significant reduction in surface area and pore volume, confirming successful pore occupation.
Protocol 2: Synthesis and Catalytic Testing of a Pd@SBA-15 Heterogeneous Catalyst
Objective: To impregnate SBA-15 with Palladium nanoparticles and evaluate its performance in a model Suzuki-Miyaura cross-coupling reaction.
Materials: See "Research Reagent Solutions" table.
Method:
- Wet Impregnation: a. Dissolve 0.1 mmol of Palladium(II) acetate in 20 mL of acetone. b. Add 1.0 g of calcined SBA-15 (BET surface area pre-characterized) to the solution. Stir at room temperature for 6 hours. c. Remove solvent by rotary evaporation. d. Reduce the Pd²⁺ to Pd⁰ by calcining in a 5% H₂/Ar gas stream at 300°C for 2 hours. The final material is Pd@SBA-15.
- Catalyst Characterization: Perform BET analysis on Pd@SBA-15. Compare surface area, pore volume, and pore size distribution to the parent SBA-15 to assess pore blocking.
- Catalytic Reaction (Suzuki-Miyaura Coupling): a. In a round-bottom flask, combine iodobenzene (1.0 mmol), phenylboronic acid (1.5 mmol), potassium carbonate (2.0 mmol), and 20 mg of Pd@SBA-15 catalyst. b. Add a 3:1 mixture of ethanol/water (10 mL) as solvent. c. Heat the reaction mixture to 80°C with stirring under an inert atmosphere (N₂ or Ar) for 4 hours. d. Monitor reaction progress by thin-layer chromatography (TLC) or GC-MS.
- Work-up and Analysis: a. Cool the reaction mixture. Separate the catalyst by centrifugation. b. Extract the product (biphenyl) with ethyl acetate (3 x 10 mL). c. Dry the combined organic layers over anhydrous MgSO₄, filter, and concentrate. d. Calculate yield by gravimetric analysis or via HPLC using a calibration curve. e. Test catalyst recyclability by recovering, washing, drying, and reusing it in subsequent runs.
Diagrams
Title: MOF-based drug delivery workflow
Title: Mesoporous silica synthesis & characterization
The Scientist's Toolkit
Table 2: Essential Research Reagent Solutions & Materials
| Item | Function/Explanation | Example Vendor/Cat. No. (Representative) |
|---|---|---|
| MOF Precursors | Metal clusters and organic linkers for constructing framework. | e.g., Zinc nitrate hexahydrate (Zn source for MOF-5), 2-Methylimidazole (linker for ZIF-8) |
| Silica Source | Precursor for mesoporous silica synthesis via sol-gel. | Tetraethyl orthosilicate (TEOS) |
| Structure-Directing Agent (Template) | Forms micelles to template mesopores during synthesis. | Cetyltrimethylammonium bromide (CTAB for MCM-41), Pluronic P123 (for SBA-15) |
| Model Drug Compounds | For loading and release studies. | Ibuprofen, Doxorubicin hydrochloride, Fluorescein isothiocyanate (FITC) for tagging |
| Metal Precursors for Catalysis | Source of catalytic active sites for impregnation. | Palladium(II) acetate, Chloroplatinic acid hexahydrate |
| Degassing Station | For sample preparation prior to BET analysis. Removes adsorbed gases/vapors. | Micromeritics VacPrep 061 |
| Surface Area & Porosimetry Analyzer | Instrument for performing BET surface area and BJH pore size analysis. | Micromeritics ASAP 2020, Quantachrome NovaTouch |
| Simulated Physiological Buffers | For in vitro drug release studies under biomimetic conditions. | Phosphate Buffered Saline (PBS, pH 7.4), Simulated Gastric Fluid (SGF, pH 1.2) |
Solving Common BET Problems and Optimizing Data Quality
The Brunauer-Emmett-Teller (BET) theory is the cornerstone of surface area analysis for porous materials. A core thesis in advanced BET research posits that accurate measurement depends on recognizing and interpreting deviations from ideal Type II/IV isotherms. Non-ideal behaviors—hysteresis loops, low-pressure hooks, and instability—are not mere artifacts; they are critical diagnostic features revealing pore network effects, adsorbate-adsorbent interactions, and material stability. This application note provides protocols for identifying, characterizing, and responding to these features to enhance data reliability in pharmaceutical and material science research.
Quantitative Classification of Non-Ideal Isotherms
Table 1: Characteristics and Implications of Non-Ideal Isotherms
| Feature | Typical Pressure Range (P/P₀) | Primary Physical Origin | Impact on BET Analysis | Common Material Examples |
|---|---|---|---|---|
| Hysteresis Loop | 0.40 - 0.98 | Capillary condensation in mesopores (2-50 nm). Dependent on pore shape & connectivity. | Invalidation of the adsorption branch for surface area calculation. Pore size distribution analysis required. | Mesoporous silica (SBA-15), activated carbons, catalysts. |
| Low-Pressure Hook | < 0.01 | High-energy adsorption sites (e.g., defects, functional groups, unsaturated metals). Microporosity (<2 nm). | Overestimation of monolayer capacity (nₘ) if included. Requires careful lower limit selection. | Metal-organic frameworks (MOFs), zeolites, functionalized polymers. |
| Adsorption-Desorption Instability | Variable, often mid-range | Physical degradation, swelling, or irreversible chemical adsorption. | Non-reproducible data. Surface area values are method-dependent and unreliable. | Hydrogels, some layered materials, reactive metal surfaces. |
| Type II with No Plateau | > 0.90 | Weak adsorbent-adsorbate interactions or very large external surface area. | Difficulty determining total uptake. May indicate significant macroporosity. | Non-porous nanoparticles, some carbon blacks. |
Table 2: IUPAC Hysteresis Loop Classification (Updated)
| Hysteresis Type | Shape Description | Associated Pore Structure | Remarks |
|---|---|---|---|
| H1 | Narrow, steep adsorption/desorption branches with near-vertical, parallel sides. | Aggregates of uniform spheres in regular array, open cylindrical pores. | Often considered "ideal" mesopore hysteresis. |
| H2 | Broad, sloping desorption branch with a sharp陡 drop. | "Ink-bottle" pores with narrow necks, complex pore networks. | Desorption branch governed by pore neck blocking. |
| H3 | No plateau at high P/P₀, sloping adsorption branch. | Slit-shaped pores from plate-like particles, non-rigid aggregates. | Common in clays and some carbons. |
| H4 | Low-pressure hysteresis, horizontal branches. | Narrow slit-like micro/mesopores. | Associated with microporous carbons. |
| H5 | Low-pressure hysteresis combined with high-P/P₀ loop. | Partially open, complex pore structures (e.g., some zeolites). | Indicates heterogeneity in pore accessibility. |
Experimental Protocols
Protocol 3.1: Systematic Isotherm Analysis for Hysteresis
Objective: To correctly acquire and analyze adsorption-desorption isotherms with hysteresis. Materials: Surface area analyzer (e.g., Micromeritics 3Flex, Quantachrome Autosorb), high-purity N₂ or Ar (adsorbate), sample cell, degassing station. Procedure:
- Sample Preparation: Precisely weigh 50-200 mg of dry sample. Load into a clean, tared analysis tube.
- Outgassing: Degas sample under vacuum (or flowing gas) at a material-specific temperature (e.g., 150°C for silica, 300°C for carbons) for a minimum of 12 hours. Verify stability to prevent degradation.
- Analysis Parameters:
- Set bath temperature to 77 K (liquid N₂) or 87 K (liquid Ar).
- Define pressure points: 40-60 points with higher density in the hysteresis region (P/P₀ = 0.40-0.98).
- Set equilibration time to 10-30 seconds per point, ensuring <0.01% pressure change tolerance.
- Data Acquisition: Run full adsorption-desorption cycle. Include a repeat point at P/P₀ ~0.30 to check for reversibility.
- Analysis:
- Plot adsorption and desorption branches.
- DO NOT use the desorption branch for BET surface area calculation on mesoporous materials.
- Use adsorption branch for BET (in appropriate linear region, typically P/P₀ 0.05-0.30).
- Use the full desorption branch (or adsorption branch per specific methods like BJH or NLDFT) for pore size distribution.
Protocol 3.2: Diagnosing Low-Pressure Hooks and Instability
Objective: To distinguish between microporosity and artifacts. Materials: Ultra-high-resolution surface area analyzer capable of measuring P/P₀ < 10⁻⁵, He gas for void volume, molecular sieve for gas drying. Procedure:
- Ultra-Low-Pressure Isotherm:
- After standard degassing, perform a dedicated analysis in the range P/P₀ = 10⁻⁷ to 0.1 using at least 30 data points.
- Use Kr at 77 K for low-surface-area samples (<1 m²/g).
- Repeated Isotherm Analysis:
- Perform three consecutive adsorption-desorption cycles on the same sample without intermediate degassing.
- Note any shifts in the isotherm position or loop shape.
- Diagnosis:
- True Micropore Filling: Hook is reproducible across cycles, points lie on a smooth curve.
- Instrument Artifact/Moisture: Hook is inconsistent, or data is scattered at very low pressures.
- Instability: Consecutive isotherms show decreasing adsorption capacity or widening hysteresis.
The Scientist's Toolkit: Research Reagent Solutions
Table 3: Essential Materials for BET Analysis of Non-Ideal Systems
| Item | Function & Rationale |
|---|---|
| High-Purity (≥99.999%) N₂ Gas | Primary adsorbate for standard BET analysis at 77 K. Impurities (e.g., O₂, H₂O) skew low-pressure data and cause hooks. |
| Liquid Nitrogen Dewar (High Capacity) | Maintains constant 77 K bath temperature for isotherm duration. Fluctuations cause data instability. |
| Quantachrome Soot Reference Material | Certified surface area standard for validating instrument performance, especially in the BET linear region. |
| Micromeritics ASAP 2020 HP Porosimeter | Instrument capable of high-pressure (up to 500 mmHg) and low-pressure (10⁻⁴ mmHg) measurements for full-range analysis. |
| Vacuum Degassing Station (e.g., VacPrep) | For sample preparation; removal of physisorbed contaminants is critical for obtaining the true material isotherm. |
| Cryogen-Free Cooler (e.g., PolyScience) | Provides stable temperature control without liquid nitrogen, allowing for analysis at non-standard temperatures (e.g., Ar at 87 K). |
| NLDFT/DFT Software Kernel | Advanced model for pore size distribution from adsorption data, critical for interpreting hysteresis in complex networks. |
Visualization of Decision Pathways
Title: Decision Flowchart for Non-Ideal Isotherm Analysis
Title: Protocol for Full Isotherm Analysis Workflow
Application Notes
Within a broader thesis on BET method for surface area measurement research, a critical but often underestimated challenge is the sample preparation stage, specifically outgassing (degassing). For thermally sensitive or volatile compounds—common in pharmaceutical development (e.g., APIs, excipients, MOFs, polymers)—inappropriate outgassing can lead to chemical decomposition, phase changes, melting, or sublimation. This irreversibly alters the material's surface, rendering subsequent BET analysis invalid for the intended native material. The core pitfall is applying standard high-temperature/vacuum protocols (e.g., 150-300°C for several hours) to such samples. Best practices involve a paradigm shift towards minimizing thermal and desorptive stress while ensuring the removal of physisorbed contaminants.
Quantitative data from recent studies highlight the severity of this issue and the efficacy of alternative approaches:
Table 1: Impact of Outgassing Conditions on BET Surface Area of Sensitive Materials
| Material Class | Standard Protocol (Typical) | Resultant BET SSA | Low-T/Controlled Protocol | Resultant BET SSA | Key Observation |
|---|---|---|---|---|---|
| Pharmaceutical API (Hydrate) | 120°C, 6h, High Vacuum | 0.8 ± 0.2 m²/g | 25°C, 24h, Ultra-dry N₂ flow | 3.5 ± 0.4 m²/g | Dehydration & amorphization under standard protocol. |
| Metal-Organic Framework (ZIF-8) | 150°C, 10h | 1300 m²/g | 80°C, 12h, Dynamic Vacuum | 1650 m²/g | Partial framework collapse at 150°C. |
| Polymer Microspheres (PMMA) | 80°C, 8h | 12.5 m²/g | 40°C, 48h | 25.1 m²/g | Tg ~85°C; Softening and pore collapse at 80°C. |
| Volatile Organic Salt | 100°C, 5h | Not measurable | Room Temp, 72h, P₀ = 10⁻⁴ mbar | 4.2 m²/g | Sublimation under high-temperature vacuum. |
Table 2: Comparison of Outgassing Method Efficacies for Sensitive Compounds
| Method | Typical Temperature Range | Pressure/Flow | Best For | Major Risk |
|---|---|---|---|---|
| High-Temp Vacuum | 100-300°C | <10⁻³ mbar | Stable oxides, carbons. | Decomposition, sintering, pore collapse. |
| Low-Temp Vacuum | 25-70°C | <10⁻³ mbar | Hydrated salts, some organics. | Incomplete contaminant removal. |
| Flow-Purge (Inert Gas) | 25-100°C | Continuous dry N₂/He | Most volatiles, hydrates. | Channeling (poor gas-sample contact). |
| Controlled-Ramp (CR) | RT-Target (≤1°C/min) | Dynamic vacuum | Unknown stability, MOFs. | Time-intensive. |
| Analysis Gas Sorption | 25-40°C | N₂ (77K) adsorbs/desorbs | Extremely fragile solids. | May not remove strongly bound H₂O. |
Experimental Protocols
Protocol 1: Low-Temperature, Extended-Duration Outgassing for a Heat-Sensitive API Objective: To remove adsorbed atmospheric moisture and volatiles from a crystalline hydrate API without inducing dehydration or amorphization prior to BET analysis. Materials: See "The Scientist's Toolkit" below. Procedure:
- Sample Loading: Accurately weigh (to 0.01 mg) a clean, pre-tared sample tube stem. Load 150-250 mg of the API powder. Attach the tube to the degas port manifold.
- System Purge: With the manifold isolation valve closed, open the purge gas (Ultra-dry N₂) regulator to establish a gentle flow (~5 cm³/min) through the manifold.
- Gentle Evacuation: Slowly open the manifold isolation valve to the vacuum pump. The N₂ flow prevents rapid outgassing and powder fluidization. Achieve a dynamic pressure of ~0.1 mbar.
- Primary Degas: Maintain the dynamic vacuum (0.1-0.5 mbar) with continuous, slight N₂ bleed for 24 hours. Keep the sample station temperature at 25.0 ± 0.5°C using the recirculating chiller.
- Secondary Dry: After 24h, close the N₂ bleed and apply full vacuum (<10⁻³ mbar) for a final 2 hours at 25°C.
- Isolation: Close the manifold isolation valve. The sample is now ready for BET analysis. Transfer to the analysis station immediately, or the tube may be back-filled with dry N₂ and sealed with a removable transport cap.
Protocol 2: Controlled Ramp Outgassing for a Microporous MOF Objective: To activate a moisture-laden ZIF-8 sample by removing guest molecules from the pores while avoiding hydrolytic or thermal framework collapse. Materials: See "The Scientist's Toolkit." Procedure:
- Initial Setup: Load 80-120 mg of as-synthesized ZIF-8 into a sample tube. Attach to a degas station equipped with a programmable temperature oven and a turbomolecular pump.
- Ambient Start: Begin with a dynamic vacuum (<10⁻² mbar) at room temperature (25°C) for 2 hours to remove loosely bound surface species.
- Programmed Ramp: Set the oven to increase temperature from 25°C to the target activation temperature (e.g., 80°C for ZIF-8) at a rate of 0.5°C per minute. Maintain dynamic vacuum (<10⁻³ mbar).
- Hold at Target: Once the target temperature is reached, hold for 10-12 hours.
- Controlled Cool-down: Program the oven to cool to analysis temperature (e.g., 35°C) at 1°C/min under continued vacuum.
- Final Isolation: After temperature equilibration, isolate the sample under vacuum. The sample is now activated for porosity analysis.
Mandatory Visualization
Decision Workflow for Outgassing Sensitive Samples
Low-T Outgassing Protocol Steps
The Scientist's Toolkit: Research Reagent Solutions
| Item | Function & Rationale |
|---|---|
| Ultra-High Purity (UHP) Nitrogen Gas (>99.999%) | Inert purge gas for flow-purge outgassing; prevents oxidative degradation and allows gentle contaminant removal. |
| Recirculating Chiller | Provides precise temperature control (±0.1°C) for sample station during low-temperature outgassing protocols. |
| Turbomolecular Pump Stand | Achieves high vacuum (<10⁻⁶ mbar) at lower temperatures, essential for volatile compound outgassing. |
| Programmable Temperature Oven | Enables controlled ramp rates (e.g., 0.5°C/min) for gentle thermal activation in Controlled Ramp protocols. |
| Heated Analysis Gas Delivery Lines | Prevents condensation of vapors (e.g., water, solvents) in transfer lines during outgassing and analysis. |
| In-situ Microbalance | Allows continuous mass monitoring during outgassing to track decomposition, sublimation, or desorption endpoints. |
| Removable Transport Caps | Seal degassed samples under inert atmosphere for safe transfer between degas and analysis stations. |
| Moisture Trap (Molecular Sieve) | Placed in the purge gas line to ensure gas dryness, preventing re-adsorption of water during outgassing. |
Selecting the Right Relative Pressure (P/Po) Range for Linear Fit
The Brunauer-Emmett-Teller (BET) method remains the cornerstone for specific surface area (SSA) determination of porous materials in pharmaceutical development, where surface area directly influences drug dissolution, stability, and carrier efficiency. A central, often subjective, step in the BET theory application is the selection of the linear region within the BET plot. This selection critically dictates the accuracy and reproducibility of the calculated monolayer capacity (nₘ) and, consequently, the SSA. This application note, framed within a broader thesis on advancing BET methodology for nanomedicines, provides a structured, evidence-based protocol for selecting the optimal relative pressure (P/Po) range for a valid linear fit, ensuring compliance with ICH Q2(R1) guidelines for analytical method validation in pharmaceutical applications.
Theoretical Considerations & Current Guidelines
The BET equation is linearized as: [ \frac{P/Po}{n(1-P/Po)} = \frac{1}{nm C} + \frac{C-1}{nm C}(P/Po) ] where n is the quantity adsorbed, nₘ is the monolayer capacity, and C is the BET constant. A linear fit is performed on this plot to derive nₘ. However, the theory assumes multilayer physical adsorption on a free surface, and deviations occur at low pressures (inadequate monolayer coverage) and high pressures (onset of capillary condensation). Recent consensus, particularly from IUPAC (2015) and ISO 9277:2022, emphasizes that the selected range must yield a positive C value and a positive y-intercept, and the product nₘ(C-1) must be positive.
Critical Quantitative Data Ranges
The following table synthesizes current recommended P/Po ranges based on material type and the corresponding validity criteria.
Table 1: Recommended P/Po Ranges and Validity Criteria for BET Linear Region Selection
| Material Type (Pharma Relevant) | Typical Recommended P/Po Range | Minimum Data Points (ISO 9277) | Key Validity Criterion (from linear fit) | Typical Acceptable C Value Range |
|---|---|---|---|---|
| Mesoporous Silica (e.g., SBA-15) | 0.05 - 0.30 | 5 | Intercept > 0; R² > 0.9995 | 50 - 300 |
| Microporous Active Pharmaceutical Ingredient (API) | 0.005 - 0.10 | 5 | 1 ≤ n*(1-P/Po) ≤ 2 (Rouquerol transform) | 20 - 150 |
| Metal-Organic Framework (MOF) | 0.005 - 0.08 | 6 | Ensure no micropore filling distortion | >100 |
| Nanoparticle Suspension (dried) | 0.05 - 0.25 | 4 | Positive C value; monolayer completion | 30 - 100 |
| Low-Surface-Area Excipient (e.g., Lactose) | 0.10 - 0.30 | 4 | Check consistency across multiple ranges | >20 |
Detailed Experimental Protocol
Protocol: Systematic Identification of Optimal BET Linear Range
Objective: To determine the optimal P/Po range for a valid BET linear fit from N₂ physisorption isotherm data at 77 K.
Materials & Equipment:
- High-purity (≥99.999%) nitrogen and helium gases.
- Degassing station (e.g., vacuum, heating).
- Surface area and porosity analyzer (e.g., Micromeritics 3Flex, Anton Paar NovaTouch).
- Data analysis software (e.g., Micromeritics MicroActive, Anton Paar ASiQwin, self-coded scripts).
Pre-Analysis Steps:
- Sample Preparation: Precisely weigh (20-100 mg) a representative sample into a clean, pre-tared analysis tube.
- Sample Degassing: Subject the sample to vacuum (<10 μmHg) with heating (temperature and duration material-specific, e.g., 120°C for 12 hours for most APIs) to remove adsorbed contaminants. Record the final degassed sample mass.
- Data Acquisition: Collect a full adsorption isotherm (P/Po = 0.00 to 0.99) using a standardized volumetric or gravimetric method. Ensure the data includes at least 30-40 equidistant points below P/Po = 0.35.
Core Iterative Analysis Workflow:
- Initial Plot Generation: Calculate and plot the BET transform, y = (P/Po)/[n(1-P/Po)], versus P/Po for the entire low-pressure region (<0.35).
- Preliminary Range Selection: Visually identify the region that appears most linear.
- Iterative Linear Fitting: a. Perform a least-squares linear regression on the initially selected data points. b. Calculate the key output parameters: slope, y-intercept, correlation coefficient (R²), nₘ, and C value. c. Apply Validity Checks Sequentially: i. Is the C value positive? ii. Is the y-intercept positive? iii. Does the term nₘ(C-1) yield a positive value? iv. Does the calculated nₘ, when applied to the isotherm, correspond to a point near the knee of the Type II/IV isotherm?
- Rouquerol Consistency Test: Calculate the transformed function n(1-P/Po)* for each point in the candidate range. This function should increase with P/Po. The upper limit of the valid range is the point preceding the maximum of this function.
- Range Adjustment & Re-evaluation: If any check fails, systematically adjust the upper and lower P/Po limits (e.g., exclude the highest point if capillary condensation is suspected, or include a lower point if the intercept is negative). Re-run the fit and checks.
- Final Selection: The optimal range is the widest P/Po window that satisfies all validity checks and yields a stable, reproducible nₘ value (±2% variation across adjacent plausible ranges).
BET Range Selection Decision Workflow
The Scientist's Toolkit: Key Research Reagent Solutions
Table 2: Essential Materials for BET Surface Area Analysis in Pharmaceutical Research
| Item | Function & Rationale |
|---|---|
| Nitrogen Gas, 99.999% (Grade 5.0) | The standard adsorptive gas. High purity is critical to prevent contamination of the sample surface and ensure accurate pressure measurements. |
| Helium Gas, 99.999% (Grade 5.0) | Used for dead volume (void space) calibration in volumetric analyzers and often for sample pretreatment purging. |
| Standard Reference Material (e.g., NIST RM 8852, alumina) | Certified surface area material for instrument calibration and method validation to ensure data traceability and inter-lab comparability. |
| 9 mm Glass (or Quartz) Analysis Tubes with Rods | Sample holders. Must be clean, dry, and of known tare weight. Quartz is preferred for high-temperature degassing. |
| Micromeritics Smart VacPrep Degasser | Automated system for reproducible, controlled outgassing of samples prior to analysis, ensuring removal of atmospheric contaminants. |
| Anton Paar Autosorb iQ Station | Automated gas sorption analyzer enabling high-throughput, precise measurements of adsorption/desorption isotherms. |
| Quantachrome NovaTouch Software | Advanced data analysis suite for performing BET range selection, t-plot, DFT, and NLDFT analyses with validity checks. |
| Silica Gel & Molecular Sieve Desiccant | Used in gas purification trains and for storing degassed samples to prevent re-adsorption of moisture before analysis. |
Addressing Low Surface Area Challenges (< 1 m²/g)
Within the broader thesis on the BET (Brunauer-Emmett-Teller) method for surface area characterization, a significant challenge arises when analyzing materials with very low specific surface areas (< 1 m²/g). Such materials, common in pharmaceutical development (e.g., certain APIs, excipients), geology, and metallurgy, push the BET method to its practical limits. This application note details the challenges, refined protocols, and specialized techniques for obtaining accurate and reproducible data for low surface area materials.
Core Challenges in Low Surface Area Measurement
Accurate BET analysis for low surface area materials is confounded by several factors:
- Low Gas Adsorption: The signal-to-noise ratio becomes very poor.
- Bulk Gas Effects: Non-ideal gas behavior and thermal transpiration effects become significant relative to the minuscule amount adsorbed.
- Outgassing Sensitivity: The small measurable signal can be easily overwhelmed by residual contaminants.
- Dead Volume Errors: Small errors in the measurement of the sample cell's void volume (dead volume) lead to large percentage errors in the calculated surface area.
Quantitative impact of these challenges is summarized below:
Table 1: Impact of Common Error Sources on Low Surface Area Measurements
| Error Source | Typical Magnitude for High SSA Materials | Impact on Sample with SSA = 0.5 m²/g | Resultant Uncertainty in SSA |
|---|---|---|---|
| Dead Volume Measurement | ± 0.05 cm³ | High | Can exceed ± 20% |
| Thermophysical Data (e.g., Non-ideality) | Negligible | Significant | Up to ± 5-10% |
| Balance Buoyancy Correction | Routine | Critical | Up to ± 15% if ignored |
| Weighing Error (0.1 mg) | < 0.1% | High | ~± 1-2% |
| Outgassing Residuals | < 0.5% of signal | Can be > signal | Catastrophic (>100%) |
Experimental Protocols
Protocol 1: Enhanced Sample Preparation and Outgassing
Objective: To remove adsorbates without sintering or altering the sample surface.
- Sample Mass: Use a large sample mass, typically 2-5 grams, to maximize the total adsorbed amount.
- Sample Cell: Use a dedicated, matched analysis cell with precisely calibrated stem volume. Pre-treat the cell under the same conditions as the sample.
- Outgassing Conditions: Employ a gradual temperature ramp (1-2°C/min) to the final outgassing temperature. Hold under dynamic vacuum (<10⁻³ mbar) for a minimum of 12 hours, often extending to 24-48 hours for very dense materials.
- Cooling: Cool to analysis temperature (typically 77 K for N₂) under continued vacuum. Do not backfill with inert gas before cooling, to prevent re-contamination.
- Blank Correction: Perform an identical outgassing and analysis cycle on an empty, cleaned sample cell to generate a system blank isotherm for subtraction.
Protocol 2: High-Precision Low-Pressure Manometric (Volumetric) Analysis
Objective: To measure the miniscule amount of gas adsorbed with maximal accuracy.
- Adsorbate Gas: Use Krypton at 77 K instead of Nitrogen. Its lower saturated vapor pressure (P₀ ~ 1.6 torr) provides a much higher relative pressure (P/P₀) for a given absolute adsorbed amount, improving resolution.
- Pressure Transducers: Utilize multiple, dedicated high-accuracy transducers for different pressure ranges. A specialized 0.1 torr full-scale transducer is mandatory for the critical low-pressure region (P/P₀ < 0.05).
- Equilibration Time: Extend equilibrium criteria significantly. Use a dynamic equilibrium condition of < 0.01% pressure change over 5 minutes per dose.
- Dosing Strategy: Implement a continuous or quasi-continuous dosing mode, where very small, incremental doses of gas are introduced, rather than large bulk doses.
- Dead Volume Calibration: Perform helium dead volume measurements at analysis temperature after the adsorption analysis, using the same cell configuration, to account for any thermal or physical changes.
Protocol 3: Static Gravimetric Method as a Complementary Technique
Objective: To provide an independent surface area measurement, circumventing dead volume errors.
- Instrumentation: Use a high-resolution microbalance (sensitivity ≤ 0.1 µg) in a controlled gas environment.
- Buoyancy Correction: Perform an exhaustive buoyancy correction profile using helium and/or the analysis gas across the entire pressure range.
- Saturation Pressure Measurement: Directly measure the saturation pressure (P₀) of the adsorbate in situ using a separate, dedicated transducer in the balance chamber.
- Analysis: Calculate the mass change due to adsorption, convert to a volumetric amount, and apply the BET theory.
Diagram: Workflow for Low Surface Area Analysis
The Scientist's Toolkit
Table 2: Essential Research Reagent Solutions & Materials
| Item | Function in Low SSA Analysis |
|---|---|
| High-Purity Krypton Gas (≥ 99.999%) | Primary adsorbate for 77 K measurements. Lower vapor pressure enhances low-pressure measurement accuracy. |
| High-Purity Helium Gas (≥ 99.9999%) | Used for dead volume calibration. Ultra-high purity minimizes adsorption on the sample during this step. |
| Large-Volume, Calibrated Analysis Cells | Dedicated sample cells with precisely known stem volume to maximize sample mass and minimize dead volume error. |
| High-Accuracy Microbalance (0.1 µg) | Essential for gravimetric analysis and for precise sample weighing in volumetric methods. |
| Ultra-High Vacuum (UHV) Grease/Seals | Ensures system integrity during prolonged outgassing and prevents micro-leaks that ruin low-pressure data. |
| Reference Material (e.g., Dense Alumina, 0.1-0.5 m²/g) | Certified low-SSA standard for daily validation of instrument performance and protocol accuracy. |
| Liquid Nitrogen Dewar with Stable Level Control | Maintains a constant 77 K bath temperature. Fluctuations introduce significant noise in the delicate measurement. |
| Specialized Low-Pressure Transducers (0-1 Torr FS) | Critical for accurately measuring the low absolute pressures defining the BET region for Kr analysis. |
Within the broader thesis on the BET method for surface area measurement, a critical limitation is its inadequate treatment of microporous materials. The BET theory assumes multilayer adsorption on open surfaces, but in micropores (<2 nm), adsorption is dominated by pore-filling mechanisms, leading to overestimated surface areas. This application note details the complementary use of the t-plot method and Density Functional Theory (DFT) to correctly analyze microporous materials, providing accurate surface area, micropore volume, and external surface area data essential for catalysis and drug delivery system development.
Theoretical Foundation & Complementary Roles
The t-plot and DFT methods address BET's shortcomings from different angles. The t-plot is a classical, model-free method for deducing microporosity, while DFT provides a rigorous, microscopic model of fluid-solid interactions.
| Method | Theoretical Basis | Primary Outputs | Key Advantage | Key Limitation |
|---|---|---|---|---|
| BET | Gas multilayer adsorption on open surfaces. | Total specific surface area (SSA). | Simple, standardized, excellent for mesoporous materials. | Fails for microporous materials; overestimates SSA. |
| t-Plot | Comparison of sample adsorption to a non-porous reference. | Micropore volume, external SSA. | Empirically separates micro- and mesoporosity; model-free. | Requires a correct reference thickness curve; less detailed pore size info. |
| DFT | Statistical mechanics of fluid in pores of defined geometry. | Micropore volume, pore size distribution (PSD), SSA. | Provides detailed PSD; physically rigorous for micropores. | Computationally intensive; requires assumed pore geometry (e.g., slit, cylinder). |
Application Notes & Quantitative Data
The following data, synthesized from recent literature, illustrates the complementary analysis of a microporous Metal-Organic Framework (MOF) and a mesoporous/microporous activated carbon.
Table 1: Comparative Analysis of a Microporous MOF (Simulated N₂ at 77K)
| Material | BET SSA (m²/g) | t-Plot External SSA (m²/g) | t-Plot Micropore Vol (cm³/g) | DFT Micropore Vol (cm³/g) | Primary Pore Size (DFT, nm) |
|---|---|---|---|---|---|
| ZIF-8 | 1630 | 45 | 0.66 | 0.65 | 1.1 |
| Table 2: Analysis of Hierarchical Activated Carbon (Experimental CO₂ at 273K) | |||||
| Material | BET SSA (m²/g) | t-Plot External SSA (m²/g) | t-Plot Micropore Vol (cm³/g) | DFT Ultramicropore Vol (<0.7nm, cm³/g) | DFT Supermicropore Vol (0.7-2nm, cm³/g) |
| :--- | :--- | :--- | :--- | :--- | :--- |
| AC-H | 1250 | 280 | 0.48 | 0.18 | 0.31 |
Experimental Protocols
Protocol 1: t-Plot Analysis for Micropore Volume Determination
Objective: To determine the micropore volume and external surface area of a microporous adsorbent from nitrogen physisorption data at 77K.
Materials: See "Scientist's Toolkit" below.
Procedure:
- Perform Physisorption: Acquire a full N₂ adsorption-desorption isotherm (relative pressure P/P₀ from 10⁻⁷ to 0.99) on a degassed sample.
- Select Reference Data: Choose an appropriate standard isotherm (e.g., carbon black for carbons, hydroxylated silica for oxides, or the Harkins & Jura thickness equation). Critical Step: The reference material should have a surface chemistry similar to your sample.
- Transform Data: For each equilibrium pressure point, calculate the statistical adsorbed layer thickness, t (Å), using the reference equation. Example: t (Å) = [13.99 / (0.034 - log(P/P₀))]^0.5 (Harkins-Jura).
- Construct t-Plot: Plot the adsorbed volume (cm³/g STP) versus t.
- Linear Region Analysis: Identify the linear region at higher t values (typically > ~4-5Å), which corresponds to adsorption on non-microporous surfaces.
- Extract Parameters:
- Fit this linear region: V_ads = m * t + b.
- External Surface Area (Sext): Calculate as Sext (m²/g) = m * 0.0015468 (conversion factor using liquid N₂ density).
- Micropore Volume (Vmicro): Calculate as the y-intercept, b, converted to liquid volume: Vmicro (cm³/g) = b * 0.0015468.
Protocol 2: DFT Pore Size Distribution Analysis
Objective: To obtain a quantitative pore size distribution for micro- and mesopores from the same physisorption isotherm.
Procedure:
- Isotherm Acquisition: As in Protocol 1, Step 1. High-resolution data in the low-pressure region (P/P₀ < 0.1) is crucial for micropore analysis.
- Model Selection: In the DFT software, select a kernel (set of theoretical isotherms) matching your adsorbate (N₂, Ar, CO₂), temperature (77K, 87K, 273K), and assumed pore geometry (e.g., slit pores for carbons, cylindrical for MCM-41, spherical for some zeolites).
- Regularization: Apply a suitable regularization condition (e.g., NLDFT, QSDFT) to stabilize the solution. QSDFT (quenched solid DFT) is preferred for heterogeneous surfaces.
- Inversion & Calculation: The software inverts the experimental isotherm by fitting it as a sum of the theoretical kernel isotherms. It outputs the pore size distribution (PSD) and the cumulative pore volume.
- Integration: From the PSD, integrate the volume in the micropore region (<2 nm) to obtain the DFT micropore volume. Compare this value to the t-plot result for consistency.
The Scientist's Toolkit: Research Reagent Solutions
| Item | Function in Analysis |
|---|---|
| High-Purity N₂ (99.999%) Gas | Primary adsorbate for physisorption at 77K; standard for total surface area and mesopore analysis. |
| High-Purity Ar (99.999%) Gas | Alternative adsorbate for 77K or 87K analysis; lacks quadrupole moment, giving cleaner data for DFT on non-polar surfaces. |
| High-Purity CO₂ (99.995%) Gas | Adsorbate for analysis at 273K (ice bath); ideal for characterizing ultramicropores (<0.7 nm) due to faster diffusion. |
| Liquid Nitrogen (LN₂) | Cryogen (77K) for maintaining analysis bath temperature for N₂/Ar adsorption. |
| Liquid Argon | Cryogen (87K) for Ar adsorption, providing a wider relative pressure range for micropore analysis. |
| Microporous Reference Material (e.g., Zeolite Y) | Certified material for validating instrument performance and DFT kernel in the micropore range. |
| Non-Porous Reference Material (e.g., carbon black) | Required for generating or validating the standard t-curve used in t-plot analysis. |
| DFT/QSDFT Software Kernel | Set of theoretical model isotherms for specific adsorbate/temperature/geometry combinations; the core of DFT analysis. |
Visualized Workflows
Workflow for Complementary Pore Structure Analysis
Interpreting Combined t-Plot and DFT Data
Application Notes
Within the framework of BET surface area analysis for advanced material and drug development research, transitioning from exploratory R&D to high-throughput (HTP) or quality control (QC) environments necessitates stringent parameter optimization. The core objective shifts from comprehensive characterization to rapid, reproducible, and reliable pass/fail assessments. This protocol details the optimization of BET analysis parameters for HTP/QC applications, focusing on throughput, precision, and alignment with ICH Q2(R1) guidelines where applicable.
The critical optimized parameters fall into three categories: sample preparation, instrument configuration, and data analysis criteria. The following table summarizes the optimized quantitative parameters compared to standard research-grade analysis.
Table 1: Comparative Analysis of BET Method Parameters
| Parameter Category | Standard Research Method | Optimized HTP/QC Protocol | Justification for HTP/QC |
|---|---|---|---|
| Sample Mass | Variable, targeting total pore volume ~0.1-0.3 cm³/g | Fixed mass (±2%) based on target material | Eliminates weighing time variance, ensures consistent signal. |
| Outgassing Temperature | Ramped to maximum safe temperature, held for 6-12 hours | Fixed at a validated, material-specific temperature, held for 2 hours | Reduces preparation time; sufficient for QC release of known materials. |
| Outgassing Pressure | < 10 µmHg | < 50 µmHg | Acceptable for most QC purposes, achieved faster. |
| Analysis P/P₀ Range | 0.05-0.30 (5+ points) | Narrowed, validated range (e.g., 0.08-0.22, 3 points) | Reduces analysis time; focuses on linear BET region for known materials. |
| Equilibration Time | 10-15 seconds per point | 5-8 seconds per point | Increases throughput with minimal precision loss on stable materials. |
| Acceptance Criteria (Surface Area) | Full report, R² > 0.9999 | Pass/Fail vs. specification range (e.g., 100 ± 5 m²/g) | Enables rapid decision-making. |
| System Suitability Test (SST) | Daily or per sample series | Per analysis batch (e.g., every 6 samples) using certified reference material | Ensures ongoing instrument performance within 2% of CRM value. |
| Throughput (samples/day) | 4-8 | 12-20 | Maximizes asset utilization. |
Experimental Protocols
Protocol 1: Method Development and Validation for HTP/QC Objective: To establish and validate a fixed-parameter BET method for a specific material (e.g., a mesoporous drug carrier).
- Exploratory Analysis: Perform 5 full BET analyses (per standard research method) on representative samples to determine the average specific surface area (SSA), optimal outgassing temperature, and linear BET range.
- Parameter Reduction: Fix sample mass to the average used. Set outgassing to the determined temperature for 2 hours. Select three P/P₀ points within the most stable linear region.
- Precision Study: Analyze 6 independently prepared samples using the reduced HTP method. Calculate the relative standard deviation (RSD). For QC, RSD should be ≤ 2.0%.
- Method Correlation: Perform a linear regression comparing SSA results from the HTP method (y) against the full research method (x) for 10 different batch samples. The correlation coefficient (R) must be >0.995.
- Robustness Testing: Deliberately introduce minor variations (±5°C outgas, ±0.5 sec equilibration) to confirm the method's resilience.
Protocol 2: Daily HTP/QC Operation with SST Objective: To execute routine, high-confidence surface area measurement in a QC environment.
- Sample Preparation: Weigh pre-determined fixed mass of samples (n=12) into clean, labeled analysis tubes.
- System Suitability Test (SST): Load a tube containing a certified reference material (e.g., NIST RM 8852, alumina powder).
- Batch Loading: Load the 12 sample tubes.
- Automated Analysis: Initiate automated sequence with the following fixed parameters:
- Outgassing: 150°C, 2 hours, <50 µmHg.
- Analysis: 3-point BET at P/P₀ = 0.08, 0.15, 0.22; 5 sec equilibration.
- Data Reduction: Automatic C constant check (typically 50-250). Automatic calculation of SSA.
- QC Review: The SST result must be within 2% of the certified value for the entire batch to be valid. Review sample SSA values against pre-defined specification limits (e.g., 250 ± 10 m²/g). Report as Pass/Fail.
Mandatory Visualizations
HTP QC BET Method Development Workflow
Automated HTP QC BET Analysis Sequence
The Scientist's Toolkit
| Research Reagent / Material | Function in HTP/QC BET Analysis |
|---|---|
| Certified Reference Material (CRM) | e.g., NIST alumina or carbon black. Used for daily System Suitability Testing (SST) to verify instrument accuracy and precision before sample batch analysis. |
| Pre-weighed, Tared Analysis Tubes | Minimizes sample handling and weighing time, critical for maximizing throughput and reducing operator error. |
| High-Purity (≥99.999%) Analysis Gases | Ultra-pure N₂ (adsorbate) and He (carrier) are essential for reproducible physisorption, preventing contamination of samples and the analyzer. |
| Automated Degas Station | Allows for simultaneous, programmable outgassing of multiple samples (e.g., 12) while the analyzer is running, creating a continuous workflow. |
| Multi-Port Analysis Station | Enables sequential, unattended analysis of a large batch of samples (e.g., 12-16) after degassing, crucial for HTP operations. |
| Validated Data Reduction Software | Software that automatically applies the fixed BET range, calculates SSA and C constant, and flags results outside pre-set limits or with poor linearity. |
Validating BET Data and Comparing with Alternative Techniques
The BET (Brunauer-Emmett-Teller) method for surface area analysis of pharmaceutical materials, such as active pharmaceutical ingredients (APIs) and excipients, is a critical characterization tool. Its application in drug development necessitates strict adherence to regulatory guidelines to ensure data reproducibility, reliability, and compliance. The International Council for Harmonisation (ICH) Q2(R2) Guideline on Validation of Analytical Procedures and the United States Pharmacopeia (USP) general chapters <846> and <1225> provide the foundational framework. This application note details protocols for BET method validation and operation within this regulatory context.
Key Regulatory Requirements: ICH Q2(R2) and USP
The ICH Q2(R2) guideline outlines validation characteristics for analytical procedures. While BET is a physical test, the principles of validation are applicable to ensure the quality of measurements. USP <846> "Surface Area Determination" provides general methodology, and <1225> "Validation of Compendial Procedures" aligns with ICH.
Table 1: Applicable Validation Characteristics for BET Method (ICH Q2(R2))
| Validation Characteristic | Objective for BET Analysis | Typical Acceptance Criteria |
|---|---|---|
| Specificity | Ability to distinguish analyte from interfering substances (e.g., moisture). | No significant adsorption from impurities; linear BET plot (r² > 0.999) in the relative pressure (P/P₀) range 0.05-0.30. |
| Accuracy/Trueness | Closeness of agreement between accepted reference value and value found. | Measured surface area of certified reference material (e.g., NIST 1898) within ±5% of certified value. |
| Precision - Repeatability - Intermediate Precision | Degree of agreement among independent test results under stipulated conditions. | RSD ≤ 3% for 6 replicates of same sample. RSD ≤ 5% across different days, analysts, or instruments. |
| Range | Interval between upper and lower levels of analyte for which suitable precision/accuracy is demonstrated. | Demonstrated for the specific surface area range relevant to the sample (e.g., 0.1 m²/g to 200 m²/g). |
| Robustness | Capacity to remain unaffected by small, deliberate variations in method parameters. | Surface area result remains within pre-defined limits when varying degas time/temperature, analysis gas, etc. |
Table 2: Key USP Chapter Considerations
| USP Chapter | Title | Relevance to BET Method |
|---|---|---|
| <846> | Surface Area Determination | Specifies general principles, apparatus, calibration, and procedure for multipoint BET analysis. |
| <1225> | Validation of Compendial Procedures | Classifies BET as a Category III procedure (limit test for a physico-chemical property), requiring validation of accuracy, precision, and robustness. |
| <41> | Balances | Governs weighing accuracy for sample mass determination. |
| <643> | Total Organic Carbon | May be relevant for cleaning verification of BET sample tubes. |
Detailed Experimental Protocols
Protocol 3.1: System Suitability and Qualification
Objective: To verify instrument performance prior to sample analysis using a traceable reference material. Materials: Certified surface area reference material (e.g., alumina or carbon black), high-purity nitrogen (or krypton for low surface area), liquid nitrogen. Procedure:
- Degas: Load ~200 mg of reference material into a clean, tared sample tube. Degas at 300°C for 3 hours under vacuum (or inert gas flow).
- Weigh: Precisely weigh the degassed sample tube to determine net sample mass.
- Analysis: Mount tube on analysis port. Immerse in liquid nitrogen bath. Execute a 5-point BET analysis in the relative pressure (P/P₀) range of 0.05 to 0.30.
- Calculation & Acceptance: Software calculates surface area via BET equation. The mean result from three consecutive runs must be within ±5% of the certified value.
Protocol 3.2: Method Validation for a Specific API (Precision – Repeatability)
Objective: To establish the repeatability (intra-assay precision) of the BET method for a specific API batch. Materials: Single batch of API, validated analytical balance, BET instrument qualified per Protocol 3.1. Procedure:
- Prepare six independent samples from a homogeneous API batch using a sample splitter.
- For each sample, follow a standardized sample preparation SOP (e.g., degas at 40°C for 12 hours under vacuum to remove moisture without sintering).
- Analyze each sample sequentially using the same validated instrument method.
- Record the surface area (m²/g) for each of the six determinations.
- Calculate the mean, standard deviation, and relative standard deviation (RSD). Acceptance: RSD ≤ 3%.
Protocol 3.3: Robustness Testing – Variation in Degas Temperature
Objective: To assess the method's robustness to a small change in a critical sample preparation parameter. Materials: Single API sample, BET instrument. Procedure:
- Prepare four sample tubes with identical mass of API (±1%).
- Degas two tubes at the nominal condition (e.g., 40°C). Degas the other two at a modified condition (e.g., 45°C). Hold degas time and vacuum constant.
- Analyze all four tubes in random order.
- Compare the mean surface area results for the two conditions. Acceptance: The difference between means should be less than the method's intermediate precision standard deviation.
Visualization: BET Workflow and Regulatory Logic
Title: BET Analysis Workflow with Quality Control Gates
Title: Integrating Regulatory Compliance into BET Research Thesis
The Scientist's Toolkit: Key Research Reagent Solutions
Table 3: Essential Materials for Compliant BET Analysis
| Item / Reagent Solution | Function / Purpose | Key Compliance/Quality Consideration |
|---|---|---|
| Certified Surface Area Reference Material (e.g., NIST 1898) | Calibration and system suitability testing; establishes traceability and accuracy. | Must have a valid certificate of analysis (CoA) with stated uncertainty. Used per Protocol 3.1. |
| Ultra-High Purity (UHP) Analysis Gases (N₂, Kr, He) | Adsorptive (N₂/Kr) and inert carrier/dilution (He) gas. Purity prevents contamination. | ≥ 99.999% purity. Use of non-certified gases can introduce error and invalidate results. |
| Certified, Tared Sample Tubes | Hold sample during degassing and analysis. | Must be chemically clean and precisely tared. Tare weight certification ensures accurate sample mass calculation. |
| Pharmaceutical-Grade Liquid Nitrogen | Provides constant temperature bath (77 K) for adsorption. | Consistent purity and supply critical for maintaining stable analysis conditions. |
| Validated Microbalance | Accurately measures sample mass (often 50-500 mg). | Must be calibrated per USP <41> with appropriate tolerance (e.g., 0.01 mg). |
| Stable, Homogeneous API/Excipient Samples | The test material. | Must be representative of the batch and stored under controlled conditions to prevent surface property alteration (e.g., hydration). |
| Data Integrity Software | Collects, processes, and archives raw data and results. | Must be compliant with 21 CFR Part 11, featuring audit trails, electronic signatures, and secure storage. |
Cross-Validation with Mercury Porosimetry for Pore Volume and Size
Context within BET Method Thesis: This work supplements primary research employing the Brunauer-Emmett-Teller (BET) method for specific surface area analysis by providing complementary macro- and meso-pore structural data. While BET excels at quantifying surface area from gas adsorption in pores typically below 2 nm, mercury porosimetry interrogates a broader pore size range (from ~3 nm to ~400 μm) via intrusion. Cross-validating results from these techniques creates a more holistic model of porous material architecture, which is critical for applications in catalysis, pharmaceutical formulation, and drug delivery system development.
Application Notes
Mercury porosimetry operates on the principle of forcing a non-wetting liquid (mercury) into a material's pores under controlled pressure. The Washburn equation governs the relationship between applied pressure and pore diameter:
d = -(4γ cosθ)/P, where d is pore diameter, γ is mercury surface tension, θ is the contact angle, and P is applied pressure.
Key Advantages for Cross-Validation with BET:
- Extended Range: Directly measures pore sizes spanning mesopores (2-50 nm) and macropores (>50 nm), regions where gas adsorption can be limited.
- Volume Distribution: Provides absolute pore volume and a volume-based size distribution, contrasting with BET's area-based analysis.
- Network Effects: The intrusion-extrusion hysteresis reveals information about pore connectivity, ink-bottle pores, and network percolation effects not discernible from BET isotherms.
Limitations and Considerations:
- Material Compression: High pressures can compress or fracture soft materials (e.g., some pharmaceuticals), distorting data.
- Assumed Constants: The Washburn equation relies on assumed values for surface tension and contact angle, which can vary with material chemistry.
- Pore Accessibility: Only pores accessible from the external surface and connected by throats larger than the calculated diameter are measured.
Table 1: Comparison of Porosity Characterization Techniques
| Parameter | Mercury Porosimetry | Gas Adsorption (BET/BJH) |
|---|---|---|
| Typical Pore Range | ~3 nm - 400 μm | ~0.35 nm - ~100 nm |
| Primary Measured Property | Intruded Volume vs. Pressure | Adsorbed Gas Volume vs. Relative Pressure |
| Key Output | Pore volume distribution | Surface area, micropore/mesopore volume |
| Probing Mechanism | Intrusion of non-wetting liquid | Physisorption of gas molecules |
| Sample Stress | High (Compressive) | Negligible |
| Assumptions Required | Cylindrical pores, constant γ & θ | Adsorbate cross-section, pore model (e.g., BJH) |
Table 2: Exemplar Cross-Validation Data for Pharmaceutical Excipient (Microcrystalline Cellulose)
| Analysis Method | Total Pore Volume (cm³/g) | Median Pore Diameter (Volume-weighted) | Specific Surface Area (m²/g) |
|---|---|---|---|
| Mercury Porosimetry | 1.15 | 22.5 μm | 0.8 (calculated from data) |
| Nitrogen Adsorption (BET) | 0.012 (up to 100 nm) | 18.2 nm (BJH model) | 1.2 |
Experimental Protocols
Protocol 1: Standard Mercury Porosimetry Analysis
Objective: To determine the pore size distribution and total pore volume of a solid sample via mercury intrusion.
Materials & Equipment:
- Mercury porosimeter (e.g., Micromeritics AutoPore, Quantachrome Poremaster)
- High-purity mercury
- Sample penetrometer (powder cup or solid dilatometer)
- Analytical balance (0.1 mg sensitivity)
- Drying oven or vacuum desiccator
Procedure:
- Sample Preparation:
- Weigh an empty, clean sample penetrometer (stem + cup). Record weight (W_empty).
- Fill the sample cup with a representative sample. Typical sample mass is 0.1-0.5 g, sufficient to fill the cup volume by ~1/3 to 1/2.
- Degas the loaded sample under vacuum (e.g., < 50 μmHg) at a mild temperature (e.g., 40°C) for a minimum of 60 minutes to remove moisture and adsorbed volatiles.
- Cool to ambient temperature, then re-weigh the penetrometer with the degassed sample. Record weight (Wloaded). Calculate sample mass: Msample = Wloaded - Wempty.
Low-Pressure Analysis:
- Place the penetrometer into the low-pressure port of the porosimeter.
- The instrument automatically evacuates the system to a high vacuum.
- The penetrometer is then filled with mercury at a low, controlled pressure (typically ~0.5 psia). This step fills the interparticle voids and the penetrometer stem without intruding pores. The intruded volume at this stage is recorded as the "bulk volume."
High-Pressure Intrusion:
- The penetrometer is transferred to the high-pressure hydraulic chamber.
- Pressure is increased step-wise across a predefined range (e.g., from 1 psia to 60,000 psia). At each equilibrium pressure step, the volume of mercury forced into the pores is measured.
- The intrusion process continues until a maximum pressure (corresponding to the minimum detectable pore size) is reached.
Extrusion (Optional):
- Pressure is decreased step-wise back to ambient. The volume of mercury extruding from the pores is measured. The hysteresis between intrusion and extrusion curves provides insight into pore geometry.
Data Analysis:
- The instrument software applies the Washburn equation, using standard parameters (e.g., γ = 485 dyn/cm, θ = 130° for most materials), to convert pressure-volume data to a pore size distribution.
- Key results include: total intruded volume, median pore diameter, bulk and skeletal densities, and log differential intrusion plots.
Protocol 2: Cross-Validation Workflow with Nitrogen Physisorption
Objective: To integrate pore structural data from mercury porosimetry and nitrogen adsorption for a comprehensive characterization.
Procedure:
- Split-Sample Preparation: From a homogenized bulk material, prepare two representative aliquots.
- Parallel Analysis:
- Analyze Aliquot A via Mercury Porosimetry (Protocol 1).
- Analyze Aliquot B via Nitrogen Physisorption using a BET surface area analyzer. Obtain the full adsorption-desorption isotherm at 77 K.
- Data Reconciliation:
- Calculate specific surface area from BET theory (typically at P/P₀ = 0.05-0.30).
- Calculate pore size distribution in the mesopore range (2-50 nm) from the desorption branch using the Barrett-Joyner-Halenda (BJH) or other appropriate model (e.g., NLDFT).
- Overlay the pore volume vs. diameter plots from both techniques. The mercury data should be truncated at its lower reliable limit (~3-5 nm). The data should show continuity in the overlapping mesopore region (e.g., 10-50 nm).
- Compare the total pore volume accessible to nitrogen (up to P/P₀ ~0.99) with the pore volume intruded by mercury in the corresponding size range. Discrepancies may indicate compressibility, pore network effects, or model limitations.
Diagrams
Title: Cross-Validation Workflow Between MIP and BET
Title: Mercury Porosimetry Pressure Intrusion Sequence
The Scientist's Toolkit
Table 3: Key Research Reagent Solutions & Materials for Mercury Porosimetry
| Item | Function / Description | Critical Considerations |
|---|---|---|
| High-Purity Mercury | The non-wetting intrusion fluid. Must be free of oxides and other contaminants to ensure accurate volume measurement and consistent surface tension (γ). | Requires safe handling procedures and proper disposal as hazardous waste. |
| Sample Penetrometer | A calibrated chamber (cup + capillary stem) that holds the sample during analysis. | Selection (powder or solid) depends on sample form. Must be scrupulously clean and dry. |
| Vacuum Degassing System | Removes adsorbed vapors (e.g., water) from the sample pores prior to analysis. | Incomplete degassing leads to overestimation of intrusion volume due to compression of trapped gas. |
| Hydraulic Pump & Gauge | Generates and precisely measures the high pressure required to intrude mercury into fine pores. | Pressure calibration is essential for accurate pore diameter calculation. |
| Washburn Equation Parameters | Surface Tension (γ): Typically 485 dyn/cm.Contact Angle (θ): Often assumed 130° for most solids. | θ can be material-specific. Advanced studies may use measured θ values for more accuracy. |
| Reference Material (e.g., alumina pellet) | A well-characterized porous standard used for instrument qualification and method validation. | Ensures the system is generating correct pore size and volume results. |
Comparison with Microscopy Techniques (SEM, TEM) for Morphological Insights
Application Notes
Within the context of a thesis investigating the Brunauer-Emmett-Teller (BET) method for surface area analysis, integrating morphological insights from microscopy is critical. BET provides a quantitative, averaged measure of specific surface area but lacks spatial and topographical context. Scanning Electron Microscopy (SEM) and Transmission Electron Microscopy (TEM) are indispensable for visualizing the physical attributes that govern BET results. This document provides a comparative analysis and protocols for correlative characterization.
Core Complementary Roles:
- BET Surface Area Analysis: Provides a bulk-average specific surface area (m²/g), pore volume, and information on mesopore (2-50 nm) size distribution via the Barrett-Joyner-Halenda (BJH) method. It infers, but does not directly image, texture and porosity.
- SEM (Scanning Electron Microscopy): Offers topographical and compositional visualization at micro- to nano-scale. It directly images particle size, shape, agglomeration state, and macro/meso-pore structure, providing the visual context for BET surface area values.
- TEM (Transmission Electron Microscopy): Provides high-resolution internal structural details, including crystallinity, lattice fringes, and precise nanopore (<2 nm, micropores) imaging. It is crucial for understanding ultrastructural features that contribute to high surface areas measured by BET.
The synergy of these techniques allows researchers to move beyond a single number (BET surface area) to a comprehensive structure-property understanding, essential in fields like porous catalyst design or characterization of drug delivery carriers.
Quantitative Comparison of Technique Capabilities
Table 1: Comparative Analysis of BET, SEM, and TEM for Material Characterization
| Feature | BET Analysis | SEM | TEM |
|---|---|---|---|
| Primary Output | Specific Surface Area (m²/g), Pore Volume (cm³/g), Pore Size Distribution | Topographical 2D/3D Images, Compositional Maps (EDS) | High-Resolution Internal Structure Images, Crystallographic Data |
| Typical Resolution | N/A (Bulk average) | ~1 nm to 1 μm | <0.1 nm (atomic scale possible) |
| Pore Size Range | ~0.35 nm - >100 nm (Physisorption) | Best for >10 nm (meso/macropores) | Best for <10 nm (micro/mesopores) |
| Sample Environment | Vacuum or controlled gas pressure | High Vacuum | High Vacuum (Ultra-high for high-res) |
| Sample Preparation | Degassing (heat/vacuum) | Drying, Mounting, Conductive Coating | Complex (ultra-thin sectioning, dispersion on grid) |
| Depth of Field | N/A | High | Moderate |
| Statistical Relevance | High (Bulk powder analysis) | Low (Localized imaging) | Very Low (Localized imaging) |
Experimental Protocols
Protocol 1: Correlative Analysis of Mesoporous Silica Nanoparticles (MSNs) for Drug Carrier Assessment
Objective: To correlate the high BET surface area of MSNs with their morphological structure and pore network.
Materials (Research Reagent Solutions Toolkit):
Table 2: Key Research Reagents and Materials
| Item | Function |
|---|---|
| Mesoporous Silica Sample | Primary material under investigation (e.g., MCM-41, SBA-15). |
| Triple- or Quadruple-Point Gas (N₂) | Adsorptive gas for BET/BJH analysis. |
| Conductive Adhesive Carbon Tape | For immobilizing powder samples to SEM stub without altering structure. |
| Sputter Coater (Au/Pd) | Applies a thin conductive metal layer to non-conductive samples to prevent charging in SEM. |
| High-Purity Ethanol or Isopropanol | Solvent for dispersing nanoparticles for TEM grid preparation. |
| Formvar/Carbon-Coated Copper TEM Grids | Support film for TEM samples, providing stability with minimal interference. |
| Critical Point Dryer (Optional) | For delicate samples to avoid pore collapse during drying prior to SEM/BET. |
Methodology:
- Sample Pre-Treatment (for BET & Microscopy): Degas a representative aliquot (~100 mg) of MSNs at 150°C under vacuum for 12 hours using a degassing station. This step is crucial for removing physisorbed contaminants and must be consistent for both BET and imaging.
- BET/BJH Analysis:
- Load the degassed sample into the analysis port of a surface area analyzer.
- Perform a full N₂ adsorption-desorption isotherm at 77 K.
- Apply the BET theory to the relative pressure (P/P₀) range of 0.05-0.30 to calculate specific surface area.
- Use the BJH method on the desorption branch to calculate mesopore size distribution and total pore volume.
- SEM Sample Preparation & Imaging:
- Lightly dust degassed MSN powder onto carbon tape attached to an aluminum stub.
- Sputter-coat the sample with a 5-10 nm layer of gold/palladium.
- Image using an SEM at accelerating voltages of 5-15 kV. Use both secondary electron (SE) mode for topography and backscattered electron (BSE) mode for compositional contrast.
- TEM Sample Preparation & Imaging:
- Sonicate 1 mg of degassed MSNs in 1 mL ethanol for 60 seconds.
- Deposit a single drop of the dilute suspension onto a TEM grid and allow to dry.
- Image using a TEM at an accelerating voltage of 80-120 kV. Acquire images at various magnifications to assess particle size, pore ordering, and internal structure.
Protocol 2: Assessing API (Active Pharmaceutical Ingredient) Loaded onto Porous Excipients
Objective: To use SEM/TEM to visually confirm successful API impregnation into a high-surface-area porous carrier measured by BET.
Methodology:
- BET Analysis of Carrier and Final Product: Perform BET analysis on the pure porous excipient (e.g., porous silicon, magnesium aluminometasilicate) and the API-loaded final product. A significant decrease in surface area and pore volume in the final product indicates successful pore filling/loading.
- SEM Imaging for Morphological Change:
- Prepare coated samples of both pure carrier and loaded product.
- Image identical magnification ranges. Look for changes in surface texture, reduction in visible pore openings, or the presence of API crystals on the carrier surface.
- STEM-HAADF Imaging (Advanced Protocol):
- Use Scanning Transmission Electron Microscopy (STEM) mode on a TEM.
- Utilize High-Angle Annular Dark-Field (HAADF) imaging for Z-contrast, where heavier API molecules may appear brighter than the silica or carbon-based carrier.
- Couple with Energy-Dispersive X-ray Spectroscopy (EDS) mapping to spatially resolve the distribution of elemental signatures from the API within the pore structure.
Visualization of Correlative Workflow
Title: Workflow for BET-SEM-TEM Correlative Analysis
Title: Linking BET Data to Microscopy Insights
When to Use Dynamic Light Scattering (DLS) vs. BET for Particle Size
Within the broader thesis on BET (Brunauer-Emmett-Teller) theory for surface area analysis, a critical question arises regarding its application for particle size assessment versus dedicated size techniques. BET fundamentally measures the specific surface area (SSA) of porous or powdered materials via gas adsorption. Particle size can be inferred from SSA assuming spherical, non-porous particles, but this is often an oversimplification. This application note delineates the distinct operational domains of BET-derived size and Dynamic Light Scattering (DLS), which measures the hydrodynamic diameter of particles in suspension. The choice hinges on the sample's state, the property of interest, and the required information context for fields like pharmaceuticals and material science.
Comparative Analysis: DLS vs. BET-Derived Size
Table 1: Core Principle and Measurement Output
| Aspect | Dynamic Light Scattering (DLS) | BET Surface Area Analysis |
|---|---|---|
| Measured Property | Hydrodynamic diameter (size in solution) | Specific Surface Area (SSA, m²/g) via gas adsorption |
| Primary Output | Intensity-weighted size distribution, PDI (Polydispersity Index) | Adsorption/desorption isotherm, total SSA, pore volume/size |
| Derived Size Metric | Direct measurement (Z-average diameter) | Calculated spherical equivalent diameter (SED) |
| Measurement State | Particles in liquid suspension (native state) | Dry, degassed powder (dry state) |
| Size Range | ~0.3 nm to 10 µm | Typically < 1 µm for accurate SED (depends on density) |
Table 2: Key Application Scenarios and Decision Guide
| Scenario / Requirement | Preferred Technique | Rationale |
|---|---|---|
| Size of particles in a formulation buffer | DLS | Measures size in the relevant, hydrated state; critical for stability & bioavailability studies. |
| Surface area of a porous catalyst | BET | Directly measures SSA and porosity; size is irrelevant or misleading. |
| Aggregation state in a drug product vial | DLS | Sensitive to aggregates & changes in hydrodynamic radius. |
| Primary particle size of a non-porous nano-powder | Both (Complementary) | BET gives dry, specific surface area; DLS assesses dispersibility & aggregation in solvent. |
| Particle size distribution (PSD) breadth | DLS (with caution) | Provides PDI; but is intensity-weighted and biased towards larger particles. |
| Absolute surface area for quality control | BET | The gold standard for SSA; unaffected by solvent or dispersion quality. |
| Real-time monitoring of particle growth | DLS | Capable of rapid, in-situ measurements. |
Table 3: Quantitative Comparison of Derived Data
| Parameter | DLS (Example: Liposome Dispersion) | BET-Derived (Example: Silica Nanopowder) |
|---|---|---|
| Reported Value | Z-Avg: 152.3 nm; PDI: 0.08 | SSA: 185 m²/g; Pore Volume: 0.45 cm³/g |
| Calculated Diameter | 152.3 nm (hydrodynamic) | Spherical Equivalent Diameter*: ~14.5 nm |
| Key Assumption | Spherical particles, Brownian motion only. | Spherical, smooth, non-porous particles. Density: 2.2 g/cm³. |
| Implied Information | Stable, monodisperse suspension. | High-surface-area, likely porous material. |
*SED = 6000 / (Density * SSA) for diameter in nm and SSA in m²/g.
Detailed Experimental Protocols
Protocol 1: Dynamic Light Scattering (DLS) for Protein Formulation Objective: Determine the hydrodynamic size and aggregation state of a monoclonal antibody (mAb) in formulation buffer.
- Sample Preparation: Centrifuge the mAb solution at 10,000 x g for 5 minutes to remove dust/large aggregates. Use clean, filtered buffer as diluent if needed.
- Instrument Setup: Equilibrate DLS instrument (e.g., Malvern Zetasizer) at 25°C. Use a disposable microcuvette.
- Loading: Pipette 50-100 µL of clear supernatant into the cuvette, avoiding bubbles.
- Measurement Parameters: Set measurement angle to 173° (backscatter), automatic attenuation selection. Perform 3-12 sequential runs of 10 seconds each.
- Data Acquisition: Run the measurement. Software calculates correlation function.
- Analysis: Fit correlation function to obtain intensity-based size distribution and Z-average diameter. Report Polydispersity Index (PDI).
- Validation: Measure a known latex standard (e.g., 100 nm) to verify instrument performance.
Protocol 2: BET Surface Area Analysis for API Characterization Objective: Determine the specific surface area of a raw Active Pharmaceutical Ingredient (API) powder to correlate with dissolution rate.
- Sample Preparation: Weigh 100-500 mg of API into a pre-tared sample tube. Use a finer powder for low-SSA materials.
- Degassing: Seal tube and load into degas station. Heat to 60°C (or below API melting point) under vacuum (or N₂ flow) for 12-24 hours to remove adsorbed moisture and contaminants.
- Analysis Setup: Transfer degassed sample to analysis port. Immerse in liquid N₂ (77 K) bath.
- Adsorption Isotherm: Introduce incremental doses of N₂ gas. Measure pressure and quantity adsorbed at equilibrium for each point.
- Data Collection: Collect data across a relative pressure (P/P₀) range of 0.05 to 0.30 for BET linear region.
- BET Calculation: Plot data according to the BET equation. Perform linear regression on the region where the BET plot is linear (typically P/P₀ = 0.05-0.30). Calculate SSA from the slope and intercept.
- Reporting: Report SSA (m²/g), C constant, and correlation coefficient of the BET plot.
Visualization: Decision Pathway & Workflow
Title: Decision Flowchart: Selecting DLS or BET for Size Analysis
Title: DLS vs BET Experimental Workflow Comparison
The Scientist's Toolkit: Essential Research Reagents & Materials
Table 4: Key Reagents and Materials for DLS and BET Analysis
| Item | Function | Typical Example / Specification |
|---|---|---|
| DLS Cuvettes | Holds liquid sample for light scattering measurement. | Disposable polystyrene micro cuvettes; Quartz cuvettes for harsh solvents. |
| Nanoparticle Size Standards | Calibrates and validates DLS instrument performance. | 60 nm & 100 nm Polystyrene Latex Beads (NIST-traceable). |
| Syringe Filters | Removes dust and large aggregates from liquid samples pre-DLS. | 0.22 µm or 0.45 µm pore size, nylon or PVDF membrane. |
| BET Sample Tubes | Holds powder sample during degassing and analysis. | Pre-tared, glass tubes with bulb or rod shape for precise volume. |
| Analysis Gas (BET) | Probe molecule for surface adsorption measurement. | High-purity Nitrogen (N₂) or Krypton (Kr) for very low SSA. |
| Liquid Nitrogen | Creates cryogenic temperature (77 K) for BET gas adsorption. | >99.9% purity, used to fill Dewar flask. |
| Degas Station | Removes adsorbed volatiles from sample surface prior to BET. | Heated manifold under vacuum or with inert gas flow. |
This document exists within the broader thesis that while the Brunauer-Emmett-Teller (BET) method is the cornerstone for specific surface area analysis of porous materials, it is inherently limited to a partial characterization of the pore architecture. For researchers in catalysis, materials science, and drug development, relying solely on BET surface area can lead to incomplete or misleading conclusions regarding material performance, adsorption capacity, and mass transport kinetics. These Application Notes detail the limitations of the BET theory and provide protocols for integrating complementary techniques to achieve a holistic pore structure analysis, which is critical for rational material design and optimization.
The following table summarizes key quantitative and conceptual limitations of the standard BET analysis for pore structure characterization.
Table 1: Key Limitations of the BET Method for Pore Structure Analysis
| Limitation Category | Specific Issue | Quantitative/Qualitative Impact |
|---|---|---|
| Theoretical Assumptions | Monolayer adsorption on a flat, homogeneous surface. | Invalid in micropores (<2 nm) where pore-filling occurs, and in mesopores (2-50 nm) where multilayer adsorption precedes capillary condensation. Leads to over/under-estimation of surface area. |
| Pore Size Range | No direct pore size distribution (PSD). | BET surface area is a single number. Provides no data on the distribution of pore widths, which governs accessibility and kinetics. |
| Applicability Range | Valid only for relative pressures (p/p⁰) where the BET plot is linear. | The recommended range is typically 0.05 – 0.30 p/p⁰. Microporous materials often show linearity only <0.1 p/p⁰, making the derived "BET area" an apparent value. |
| Pore Geometry/Shape | Insensitive to pore shape (cylindrical, slit, ink-bottle). | A material with slit-shaped pores and one with cylindrical pores can have identical BET areas but vastly different adsorption capacities and diffusion rates. |
| Surface Chemistry | Assumes inert, non-polar adsorbate (N₂ at 77K). | N₂ cannot probe ultramicropores (<0.7 nm) and is poorly sensitive to surface functional groups. Acidic sites or hydrophilicity are not characterized. |
| Pore Network Effects | Ignores connectivity and percolation. | Does not detect blocked or inaccessible pores, which are critical for transport properties in drug delivery carriers or catalyst supports. |
Complementary Techniques: Protocols and Integration
A full pore structure analysis requires a multi-technique approach. Below are detailed protocols for key complementary experiments.
Protocol: Non-Local Density Functional Theory (NLDFT) Pore Size Distribution Analysis from N₂ Physisorption Isotherms
Objective: To derive a quantitative pore size distribution (PSD) from a high-resolution adsorption isotherm, overcoming the BET model's limitations for micro- and mesopores.
Materials & Equipment:
- Fully automated, high-resolution gas sorption analyzer (e.g., Micromeritics 3Flex, Quantachrome Autosorb-iQ, Anton Paar NovaTouch).
- High-purity (≥99.999%) nitrogen gas and liquid nitrogen Dewar.
- Degassed, pre-weighed solid sample in a clean analysis tube.
- Software with NLDFT/QSDFT kernel appropriate for material (e.g., carbon slit, silica cylindrical pores).
Procedure:
- Sample Preparation: Pre-treat sample (e.g., degas at appropriate temperature and vacuum, typically 150°C for 6-12 hours) to remove physisorbed contaminants.
- Isotherm Acquisition: Mount tube on analysis port. Execute a pre-programmed analysis collecting a minimum of 50 adsorption data points across the relative pressure range of p/p⁰ = 1 x 10⁻⁷ to 0.995. Ensure equilibration times are sufficient for micropore filling.
- Data Input: Export the complete adsorption branch data (relative pressure vs. quantity adsorbed in cm³/g STP) to the PSD analysis software.
- Model Selection: Choose the correct NLDFT or Quenched Solid Density Functional Theory (QSDFT) kernel that matches the assumed pore geometry and adsorbate-surface interaction of your material (e.g., "N₂ on carbon slit pores at 77K" for activated carbons).
- PSD Calculation: Execute the DFT calculation. The software solves the adsorption integral equation to output the PSD, typically as a differential pore volume (dV/dw) plot vs. pore width.
- Validation: The cumulative pore volume from the DFT PSD should closely match the total pore volume measured at a high relative pressure (e.g., p/p⁰ = 0.95). The derived specific surface area (DFT surface area) is often more accurate for microporous materials than the BET area.
Protocol: Probing Ultramicropores with CO₂ Adsorption at 273K
Objective: To characterize pores smaller than 0.7 nm (ultramicropores), which are kinetically restricted to N₂ diffusion at 77K, using CO₂ at a higher temperature.
Materials & Equipment:
- Gas sorption analyzer capable of isothermal measurements at 273K (ice-water bath).
- High-purity (≥99.995%) carbon dioxide gas.
- Precision temperature bath or ice-water mixture maintained at 0°C.
- Sample tube with pre-degassed sample.
Procedure:
- System Setup: Set analyzer thermostat or immerse the sample manifold in a well-stirred ice-water bath (273K). Ensure temperature stability (±0.1°C).
- Isotherm Acquisition: Perform a CO₂ adsorption analysis up to atmospheric pressure (~1 bar, p/p⁰ ~ 0.03). The low saturation pressure of CO₂ at 273K (~34.5 bar) allows probing of high relative pressures at low absolute pressures.
- Data Analysis: Apply a suitable DFT kernel for "CO₂ on [material] at 273K" to the adsorption data to obtain a PSD focused on the ultramicroporous region (0.3-1 nm).
- Integration: Combine the CO₂-DFT PSD (for pores < ~1 nm) with the N₂-DFT PSD (for pores > ~1 nm) to create a comprehensive PSD spanning the full micro-mesopore range.
Visualizing the Integrated Workflow
A structured, multi-technique approach is essential for full pore structure analysis.
Diagram Title: Integrated Workflow for Full Pore Structure Analysis.
The Scientist's Toolkit: Essential Research Reagents & Materials
Table 2: Key Reagents and Materials for Comprehensive Porosity Analysis
| Item | Function & Rationale |
|---|---|
| High-Purity N₂ (Grade 5.0 or better) | Primary adsorbate for BET surface area and mesopore analysis at 77K. Purity minimizes contamination of sample and analyzer detectors. |
| High-Purity CO₂ (Grade 4.5 or better) | Critical adsorbate for characterizing ultramicropores (<1 nm) via adsorption at 273K, where diffusion limitations of N₂ are overcome. |
| Liquid Nitrogen (LN₂) | Cryogen (77K) required for N₂ and Ar adsorption isotherms. Must be handled with appropriate PPE and in well-ventilated areas. |
| High-Purity Helium (Grade 5.0) | Used for dead volume calibration (free space measurement) in the analyzer and often for sample degassing prior to analysis. |
| Precision Analysis Tubes with Fill Rods | Sample holders designed for the specific analyzer. Fill rods reduce the dead volume, increasing measurement accuracy, especially for low-surface-area materials. |
| Sample Degassing Station | Independent, multi-port station for outgassing samples under vacuum or inert gas flow at user-defined temperatures. Essential for sample preparation without occupying the analysis unit. |
| NLDFT/QSDFT Software Kernels | Commercial or open-source computational kernels for converting adsorption isotherms to PSDs. Selection must match material-adsorbate pair (e.g., "N₂ on silica at 77K for cylindrical pores"). |
| Non-Corrosive, High-Vacuum Grease | For sealing joints in the analyzer manifold. Must maintain integrity and low outgassing at cryogenic temperatures and under high vacuum. |
This document, as part of a broader thesis on the Brunauer-Emmett-Teller (BET) method for surface area analysis, presents application notes and protocols for correlating the specific surface area of active pharmaceutical ingredients (APIs) with their in vitro dissolution and in vivo bioavailability. The central thesis posits that BET surface area is a critical material attribute (CMA) that can predict and optimize the performance of poorly soluble drugs, forming a cornerstone of Quality by Design (QbD) in pharmaceutical development.
Table 1: Summary of Studies Correlating BET Surface Area with Pharmaceutical Performance
| API / Formulation | BET Surface Area (m²/g) | Key Performance Metric Change | Reference Year | Study Type |
|---|---|---|---|---|
| Griseofulvin (Micronized) | 1.5 → 5.8 | Dissolution Rate (DR) increased by ~300% | 2022 | In Vitro |
| Itraconazole (Nanoporous) | 80 → 320 | Cmax increased by 450%; AUC increased by 420% | 2023 | In Vivo (Rat) |
| Fenofibrate (Amorphous Solid Dispersion) | 0.7 → 3.2 | DR (Q30) improved from 45% to 95% | 2023 | In Vitro |
| Celecoxib (Co-processed) | 2.1 → 15.4 | Tmax reduced from 3.0h to 1.2h | 2021 | In Vivo (Dog) |
| Silymarin (Mesoporous Silica) | 10 → 200 | Absolute Bioavailability improved from 8% to 32% | 2022 | In Vivo (Rat) |
Experimental Protocols
Protocol 1: BET Surface Area Measurement of Micronized/Nano-API
Objective: To determine the specific surface area of processed API powder.
- Sample Preparation: Degas approximately 300-500 mg of API powder under vacuum at 40°C for a minimum of 12 hours to remove adsorbed moisture and contaminants.
- BET Analysis: a. Load the degassed sample into the analysis station of a surface area analyzer (e.g., Micromeritics 3Flex, Anton Paar NovaTouch). b. Immerse the sample in a bath of liquid nitrogen (77 K). c. Admit controlled doses of nitrogen gas onto the sample. Measure the quantity of gas adsorbed at each of at least 5 relative pressure (P/P₀) points between 0.05 and 0.30. d. Desorb the gas to complete the isotherm.
- Data Calculation: Use the BET equation within the relative pressure range of 0.05-0.30. Plot 1/[Q(P₀/P - 1)] vs. P/P₀, where Q is the quantity adsorbed. The slope and intercept yield the monolayer capacity (Qₘ). Calculate specific surface area (S): S = (Qₘ * N * σ) / (M * m), where N is Avogadro's number, σ is the cross-sectional area of N₂ (0.162 nm²), M is molar mass, and m is sample mass.
Protocol 2:In VitroDissolution Testing Correlated to BET Area
Objective: To measure the dissolution profile and derive the intrinsic dissolution rate (IDR).
- Apparatus: USP Apparatus II (paddle), 900 mL dissolution medium (e.g., pH 6.8 phosphate buffer with 0.5% SLS), 37°C ± 0.5°C, paddle speed 75 rpm.
- Procedure: Introduce an accurately weighed sample of API (equivalent to dose) into the vessel. Withdraw aliquots (e.g., 5 mL) at predetermined time points (2, 5, 10, 15, 30, 45, 60 min). Filter immediately through a 0.45 μm PVDF filter.
- Analysis: Quantify drug concentration in filtrates using a validated HPLC-UV method.
- Data Correlation: Calculate IDR from the initial linear slope of the dissolution curve. Plot IDR versus BET surface area for different API batches to establish a correlation curve (typically linear within a defined particle size range).
Protocol 3:In VivoPharmacokinetic Study Design for Bioavailability Correlation
Objective: To assess the impact of increased surface area on oral bioavailability in an animal model.
- Formulation: Prepare two test formulations of the same API dose: a low BET area (reference) and a high BET area (test) batch. Use a standard vehicle (e.g., 0.5% methylcellulose).
- Animal Model: Use male Sprague-Dawley rats (n=6 per group), fasted overnight.
- Dosing & Sampling: Administer formulation orally by gavage. Collect blood samples serially via a cannula at pre-dose, 0.25, 0.5, 1, 2, 4, 8, 12, and 24 hours post-dose.
- Bioanalysis: Process plasma samples (protein precipitation). Analyze drug concentration using LC-MS/MS.
- PK Analysis & Correlation: Calculate key PK parameters: AUC₀–t, Cmax, Tmax. Plot AUC or Cmax versus the BET surface area of the administered formulation to evaluate the correlation.
Diagrams
Title: BET Area as a Predictive Tool for Drug Performance
Title: BET-Dissolution-Bioavailability Study Workflow
The Scientist's Toolkit: Research Reagent Solutions
Table 2: Essential Materials for BET-Bioavailability Correlation Studies
| Item / Reagent | Function in Experiment | Key Consideration |
|---|---|---|
| High-Purity Nitrogen Gas (≥99.999%) | Adsorptive gas for BET surface area analysis. | Impurities can skew adsorption isotherms. |
| Liquid Nitrogen | Cryogen to maintain 77 K temperature during gas adsorption. | Consistent level is critical for isotherm accuracy. |
| Micronized API Reference Standards | Control material with defined, low surface area. | Essential for establishing baseline correlation. |
| Porous or Nanonized API Batches | Test materials with engineered, high surface area. | Should vary in SSA while maintaining crystallinity/polymorph. |
| Dissolution Media (with Surfactant e.g., SLS) | Simulates gastrointestinal fluid for in vitro testing. | Must ensure sink conditions for poorly soluble drugs. |
| LC-MS/MS Grade Solvents (MeOH, ACN) | For bioanalysis of plasma samples in PK studies. | Purity is critical for sensitivity and reproducibility. |
| Stable Isotope-Labeled API (e.g., ¹³C) | Internal standard for quantitative LC-MS/MS bioanalysis. | Corrects for matrix effects and recovery variability. |
| Animal Dosing Vehicle (e.g., 0.5% Methylcellulose) | Inert suspension medium for in vivo oral gavage. | Must not affect API stability or absorption. |
Conclusion
The BET method remains the cornerstone for reliable, quantitative specific surface area measurement, providing indispensable data for rational material design in pharmaceuticals and beyond. Mastering its foundational theory, meticulous protocol execution, and adept troubleshooting is essential for generating meaningful results. However, researchers must recognize its limitations, particularly for microporous or non-rigid materials, and strategically complement BET data with techniques like DFT analysis, porosimetry, and microscopy. Looking ahead, the integration of BET analysis with advanced modeling and machine learning promises to deepen our understanding of structure-property relationships, accelerating the development of next-generation drug formulations, targeted delivery systems, and high-performance catalysts. For biomedical research, correlating surface area with critical performance attributes like dissolution and adsorption will continue to be vital for translating material science into clinical outcomes.