Mastering TPD TPR TPO Analysis: A Comprehensive Guide to Advanced Temperature Program Optimization for Catalysis Research
This article provides a detailed, current guide to optimizing temperature programs for Temperature-Programmed Desorption (TPD), Reduction (TPR), and Oxidation (TPO) analyses.
Mastering TPD TPR TPO Analysis: A Comprehensive Guide to Advanced Temperature Program Optimization for Catalysis Research
Abstract
This article provides a detailed, current guide to optimizing temperature programs for Temperature-Programmed Desorption (TPD), Reduction (TPR), and Oxidation (TPO) analyses. Targeted at researchers and scientists in catalysis and materials science, we cover foundational principles, advanced methodology, practical troubleshooting, and validation strategies. The guide synthesizes contemporary best practices to help professionals design robust experiments, extract accurate kinetic and thermodynamic data, and reliably characterize material surfaces and catalytic properties for applications in energy, pharmaceuticals, and environmental technology.
TPD TPR TPO Fundamentals: Understanding Core Principles and Data Interpretation
Thermal Programmed Desorption (TPD), Thermal Programmed Reduction (TPR), and Thermal Programmed Oxidation (TPO) are core techniques in heterogeneous catalysis and materials science for characterizing surface properties, redox behavior, and reactivity. They involve linearly increasing the temperature of a sample under a controlled gas flow while monitoring gas-phase composition, typically with a mass spectrometer or thermal conductivity detector.
TPD probes surface chemistry by measuring molecules desorbed from a surface, revealing adsorption strength, binding states, and active site density. TPR analyzes the reducibility of metal oxides or supported catalysts by monitoring hydrogen consumption. TPO investigates oxidative processes, such as catalyst regeneration or coke combustion, by monitoring oxygen consumption.
Optimizing temperature programs (ramp rate, final temperature, hold times) is critical for resolving distinct peaks, avoiding peak overlap, and obtaining quantitative, reproducible data relevant to catalyst design and drug development (e.g., in characterizing solid drug carriers or catalytic synthesis pathways).
Troubleshooting Guides & FAQs
Q1: During a TPR experiment, my baseline drifts significantly, making integration of H₂ consumption peaks difficult. What could be the cause? A: Baseline drift often stems from incomplete purification of the reduction gas (e.g., H₂/Ar). Trace oxygen can react slowly, causing continuous background consumption. Ensure gas lines are leak-tight and use high-capacity traps (e.g., for oxygen and moisture) immediately upstream of the reactor. Also, allow sufficient time for the system to stabilize at the starting temperature before initiating the ramp.
Q2: In TPD, I observe broad, poorly resolved desorption peaks. How can I improve resolution? A: Broad peaks often indicate a non-linear heating rate or diffusion limitations. First, calibrate your furnace temperature profile. If the system is sound, reduce the linear heating rate (β). Slower ramps (e.g., 5-10 K/min vs. 20 K/min) allow for better separation of desorption events from sites of different energies. Also, ensure your sample mass and particle size are optimized to avoid intra-particle diffusion effects.
Q3: My TPO experiment for coke burn-off shows an unexpectedly large, low-temperature oxygen consumption peak. Is this catalytic oxidation or an artifact? A: This can indicate the presence of reactive, non-crystalline carbonaceous deposits. However, first rule out experimental artifacts: a) Ensure the sample was properly purged with inert gas after reduction/reaction to remove physisorbed hydrocarbons that could oxidize easily. b) Check for detector saturation at the start of the run. c) Run a blank TPO with an empty reactor or inert material to confirm the signal originates from the sample.
Q4: Quantitative calibration for my mass spectrometer in TPD seems inconsistent. What is a reliable method? A: Use a pulse or flow calibration method with a known volume of the analyte gas. For example, inject a calibrated loop of pure CO₂ into your carrier gas flow for calibrating the m/z=44 signal. Perform this calibration at the same total pressure and carrier gas flow rate used in your experiments. Repeat at least three times and use the average response factor. Create a calibration table for all relevant m/z values.
Q5: After repeated TPR/TPO cycles, my catalyst's subsequent TPR profile changes shape. Is this deactivation? A: Not necessarily deactivation; it may be reconstructive transformation. High-temperature oxidation (TPO) can sinter metal particles or integrate metal ions into the support lattice, altering reduction thermodynamics. To diagnose, compare BET surface area and XRD patterns before and after cycling. For stability studies, limit the upper temperature of TPO/TPR cycles to your process's actual operating range.
Table 1: Typical Experimental Parameters for TPD, TPR, TPO
| Parameter | TPD | TPR | TPO | Rationale |
|---|---|---|---|---|
| Typical Gas | Inert (He, Ar) | 5-10% H₂ in Ar | 2-5% O₂ in He/Ar | Inert carrier; dilute reactive gas for sensitivity & safety. |
| Standard Ramp Rate (β) | 10-30 K/min | 5-20 K/min | 5-20 K/min | Balance between peak resolution & experiment time. |
| Common Temp. Range | 300-1200 K | 300-1300 K | 300-1100 K | Covers physisorption to strong chemisorption; oxide reduction; coke oxidation. |
| Sample Mass | 50-200 mg | 10-50 mg | 10-50 mg | Smaller mass for TPR/TPO minimizes heat/mass transfer effects. |
| Gas Flow Rate | 20-60 mL/min | 20-40 mL/min | 20-40 mL/min | Ensures sufficient gas exchange, minimizes diffusion. |
Table 2: Common Calibration & Diagnostic Standards
| Material | Technique | Purpose | Expected Feature |
|---|---|---|---|
| Zeolite (NH₄⁺ form) | NH₃-TPD | Acidity Calibration | Two peaks (Lewis/Brønsted sites) ~450-750 K. |
| CuO powder | H₂-TPR | Reducibility Calibration | Single sharp peak ~450-500 K. |
| Pt/Al₂O₃ | H₂-TPD | Metal Dispersion | H₂ desorption peaks < 600 K. |
| Carbon black | O₂-TPO | Oxidation Profile | Broad combustion peak ~750-900 K. |
Experimental Protocols
Protocol 1: Standard H₂-TPR for Supported Metal Catalyst
- Pretreatment: Load 20-50 mg of sample into a U-shaped quartz reactor. Heat to 573 K (5 K/min) under 50 mL/min Ar flow, hold for 60 min to remove adsorbates.
- Cooling: Cool to 323 K under Ar.
- Baseline Stabilization: Switch to 5% H₂/Ar mixture at 30 mL/min. Allow signal to stabilize for 30 min.
- Reduction Ramp: Heat from 323 K to 1173 K at 10 K/min while monitoring H₂ concentration (TCD) or m/z=2 (MS).
- Data Analysis: Integrate the consumption peak. Calibrate using known pulses of H₂ or a standard like CuO.
Protocol 2: NH₃-TPD for Solid Acid Catalyst Acidity
- Acid Site Saturation: Pretreat sample at 673 K in He. Cool to 373 K. Expose to a stream of 5% NH₃/He for 60 min.
- Physisorbed NH₃ Removal: Switch to pure He flow at 373 K for 120 min to remove weakly bound NH₃.
- Desorption Ramp: Heat from 373 K to 873 K at 15 K/min under He flow. Monitor desorbed NH₃ via TCD or MS (m/z=15, 16, 17).
- Quantification: Calibrate the detector signal by injecting known volumes of NH₃. Deconvolute peaks to distinguish acid site strengths.
Visualizations
TPD Experimental Workflow (5-Step Process)
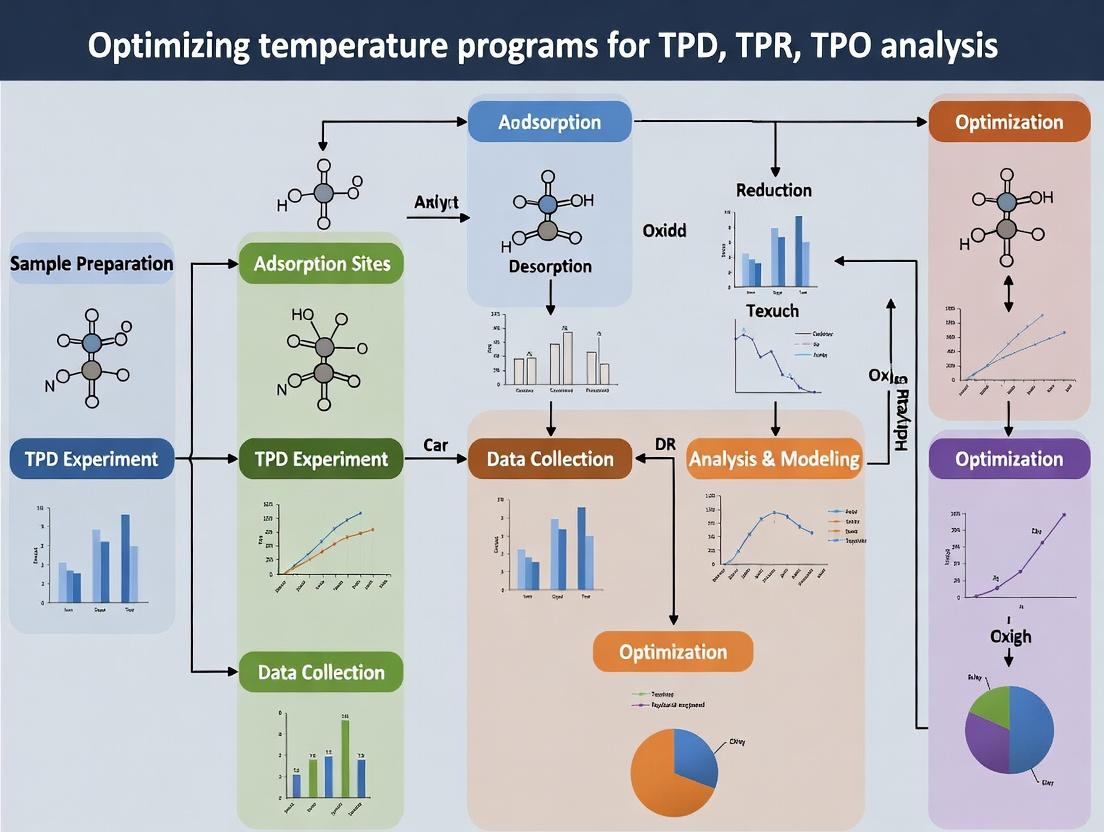
TPD, TPR, TPO: Core Technique Relationship Diagram
The Scientist's Toolkit: Key Research Reagent Solutions
Table 3: Essential Materials for Thermal Analysis Experiments
| Item | Function | Example/Specification |
|---|---|---|
| High-Purity Gases & Blends | Reactive and carrier gases for adsorption, reduction, oxidation, and purge steps. | 5% H₂/Ar, 10% O₂/He, 5% NH₃/He, Ultra High Purity (UHP) Ar, He. |
| Gas Purification Traps | Remove trace impurities (O₂, H₂O) from carrier gases to prevent baseline drift and sample oxidation. | Molecular sieve, oxygen scavenger (e.g., Cu-based), hydrocarbon trap. |
| Quartz Reactor Tubes (U-shaped/Micro) | Hold the sample during analysis; must be inert at high temperatures. | 6-8 mm OD, high-temperature quartz. |
| Quartz Wool | Support and contain powdered catalyst samples within the reactor tube. | Acid-washed, high-purity. |
| Calibration Standards | Quantify detector response and verify instrument performance. | Certified CuO (for TPR), NH₄-ZSM-5 (for NH₃-TPD), pure gas calibration mixtures. |
| Mass Spectrometer or TCD | Detect changes in gas composition during the temperature ramp. | Quadrupole MS with fast response; calibrated TCD with high stability. |
| Temperature Controller/Programmer | Precisely execute linear temperature ramps and holds. | Capable of linear ramps (0.1-50 K/min) up to 1273 K. |
Technical Support Center: Troubleshooting & FAQs for TPD/TPR/TPO Analysis
Context: This support content is designed within the framework of optimizing temperature programs for Temperature-Programmed Desorption (TPD), Reduction (TPR), and Oxidation (TPO) analysis.
Troubleshooting Guides
Issue: Poorly Resolved Peaks in TPD Spectrum
- Possible Cause: Inappropriate heating rate. A rate too high can cause peak broadening and merging.
- Solution: Implement a complex temperature profile. Use a lower heating rate (e.g., 5-10 °C/min) across the suspected desorption region, flanked by higher rates (e.g., 15-20 °C/min) during non-critical temperature zones to save time.
- Protocol:
- Calibrate the mass spectrometer or thermal conductivity detector (TCD) signal.
- Start with a linear ramp from ambient to 50°C below the target region at 15 °C/min.
- Switch to a 5 °C/min ramp through the expected peak region (e.g., 150-350°C).
- Return to 15 °C/min until the final temperature (e.g., 800°C).
- Hold at the final temperature for 10 minutes.
Issue: Incomplete Reduction in TPR or Oxidation in TPO
- Possible Cause: Insufficient time at peak temperature or inadequate ramp selection leading to kinetic limitations.
- Solution: Introduce an isothermal hold within the ramp profile or use a stepwise program.
- Protocol for Stepwise TPR:
- Linear ramp from 50°C to 300°C at 10 °C/min.
- Hold at 300°C for 30 minutes.
- Ramp from 300°C to 700°C at 5 °C/min.
- Hold at 700°C for 15 minutes.
Issue: High Baseline Drift During Experiment
- Possible Cause: Non-uniform heating or outgassing of reactor components.
- Solution: Incorporate a rigorous pre-treatment step and control ramp initiation.
- Protocol:
- Prior to analysis, purge the sample in inert gas (He, Ar).
- Execute a dedicated "cleaning" temperature program (e.g., heat to 500°C, hold) before adsorbing the probe molecule (for TPD) or introducing reactive gas (for TPR/TPO).
- Begin the actual analysis ramp only after the baseline stabilizes at the starting temperature.
Frequently Asked Questions (FAQs)
Q1: When should I use a complex temperature ramp instead of a simple linear one? A: Use complex profiles (e.g., multi-ramp, step-hold, stepwise) when you need to: deconvolute overlapping surface processes, quantify active sites with different activation energies, improve peak resolution, or optimize the total experiment time without sacrificing data quality. Linear ramps are best for initial screening or simple systems with well-separated peaks.
Q2: How do I select the optimal heating rate for my experiment? A: The optimal rate is a balance between resolution, sensitivity, and time. A general guideline is:
| Goal | Recommended Heating Rate Range | Rationale |
|---|---|---|
| High Resolution | 1 - 10 °C/min | Minimizes peak overlap by reducing kinetic readjustment lag. |
| High Sensitivity | 15 - 30 °C/min | Produces sharper, taller peaks for weak signals. |
| Kinetic Parameter Estimation | Multiple rates (e.g., 5, 10, 15 °C/min) | Required for applying models like the Redhead or Chan-Aris-Weinberg methods. |
Q3: What is the purpose of an isothermal hold during a ramp? A: An isothermal hold ensures the completion of a surface process (e.g., desorption, reduction, oxidation) at a specific temperature before proceeding. It prevents the "carryover" of incomplete reactions into higher temperature regimes, leading to more accurate quantification.
Q4: How does the choice of ramp affect the calculated activation energy (Ea)? A: The heating rate (β) is directly used in kinetic analysis. Using multiple linear ramp rates is critical. The common relationship is ln(β/Tp²) vs. 1/Tp (where T_p is peak temperature), the slope of which is proportional to -Ea/R. An incorrect or single ramp rate can lead to significant errors in Ea.
The Scientist's Toolkit: Essential Materials for TPD/TPR/TPO
| Item | Function in Experiment |
|---|---|
| Microreactor with Quartz Tube | Holds the catalyst sample, inert at high temperatures, allows gas flow. |
| Mass Flow Controllers (MFCs) | Precisely control the flow rates of carrier (He, Ar) and reactive (H₂, O₂, CO) gases. |
| Thermal Conductivity Detector (TCD) | Measures the concentration of desorbed/reactive gases in the effluent stream. |
| Quadrupole Mass Spectrometer (QMS) | Provides species-specific detection for complex gas mixtures and overlapping processes. |
| Temperature Programmer/Controller | Executes precise linear and complex temperature ramp profiles for the furnace. |
| Cryogenic Cooling Trap (Optional) | Placed before the detector to remove water or other contaminants from the gas stream. |
| Reference Catalyst (e.g., CuO) | Used for calibration of TPR apparatus and validation of heating rate profiles. |
| High-Purity Calibration Gas Mixtures | Essential for quantitative calibration of TCD and MS signals. |
Experiment Workflow for Optimized Temperature Programming
Optimized Temperature Program Workflow
Conceptual Logic of Ramp Selection
Decision Logic for Ramp Type Selection
Troubleshooting Guides & FAQs
Q1: Why do my TPD profiles show broad, poorly resolved desorption peaks? A: This is often due to an excessively high heating rate (β). A high β does not allow sufficient time for desorption kinetics to reach equilibrium at each temperature, causing peak broadening and temperature shifts. For precise activation energy calculations, use a lower β (e.g., 5-10 °C/min). Ensure your gas flow rate is sufficient to remove desorbed species rapidly, preventing re-adsorption.
Q2: How does the choice of initial temperature impact my TPR/TPO baseline? A: Starting too close to room temperature with a humid carrier gas can cause a significant water desorption peak, obscuring low-temperature reduction/oxidation events. Begin your experiment 20-30 °C above the condensation point of potential impurities in your gas stream. For TPR, a common initial temperature is 50 °C after thorough purging.
Q3: My reproducibility between runs is poor. What key parameters should I check? A: Inconsistent results typically stem from fluctuations in gas flow or initial sample state.
- Gas Flow: Use a mass flow controller (MFC), not a rotameter, for precise, reproducible total flow. Standardize at 20-50 mL/min for a typical 50 mg sample.
- Sample Preparation: Ensure identical pre-treatment (e.g., oxidation, reduction, drying) before each experiment.
- Heating Rate: Verify the furnace controller's calibration. Use the same β across comparative experiments.
Q4: What final temperature should I use for a TPO experiment to ensure complete carbon burn-off? A: Incomplete oxidation is common. A final temperature of 750-800 °C is generally safe for most carbonaceous deposits. However, for graphitic carbon, you may need to hold at the final temperature for 10-30 minutes. Always monitor the MS signal (CO₂, m/z=44) to confirm a return to baseline.
Q5: How do I determine the optimal gas flow rate for my reactor setup? A: The flow must be high enough to avoid mass transport limitations but not so high it dilutes the signal. Perform a simple test: run a standard TPR/TPD with varying flow rates (e.g., 10, 30, 50 mL/min). If the peak temperature and shape change, you are in a mass-transfer-limited regime. Choose the lowest flow rate where the profile becomes invariant.
Table 1: Recommended Parameter Ranges for Common Analyses
| Analysis Type | Typical Heating Rate (β) | Typical Initial Temp. | Typical Final Temp. | Recommended Gas Flow (for ~50 mg sample) |
|---|---|---|---|---|
| TPD (Ammonia, CO₂) | 10 - 20 °C/min | 50 - 100 °C | 600 - 800 °C | 20 - 30 mL/min (He/Ar) |
| TPR (H₂ reduction) | 5 - 10 °C/min | 50 °C | 800 - 900 °C | 20 - 50 mL/min (H₂/Ar mix) |
| TPO (Coke burn-off) | 10 - 20 °C/min | 50 - 100 °C | 750 - 850 °C | 30 - 50 mL/min (O₂/He mix) |
Table 2: Impact of Heating Rate (β) on TPD/TPR Peak Characteristics
| Heating Rate (β) | Peak Temperature (Tₚ) | Peak Width (Resolution) | Signal Intensity | Recommended Use Case |
|---|---|---|---|---|
| Low (1-5 °C/min) | Lower, more accurate | Very narrow, high resolution | Lower, broader | Precise kinetic studies, resolving overlapping peaks |
| Medium (10-20 °C/min) | Moderately shifted | Good balance | Strong | Routine characterization, quality control |
| High (>30 °C/min) | Significantly shifted higher | Very broad, poor resolution | High (but broad) | Fast screening, not for kinetic analysis |
Experimental Protocols
Protocol 1: Standard TPD of Ammonia (NH₃-TPD) for Acidity Measurement
- Pretreatment: Load 100 mg of catalyst. Activate in situ in He flow (30 mL/min) at 500 °C for 1 hour.
- Adsorption: Cool to 100 °C. Switch to 5% NH₃/He flow (30 mL/min) for 30-60 minutes.
- Purging: Switch back to pure He (30 mL/min) at 100 °C for 1-2 hours to remove physisorbed NH₃.
- Desorption: Start temperature program with a heating rate (β) of 10 °C/min from 100 °C to 600 °C under He flow (30 mL/min). Monitor desorbed NH₃ via MS (m/z=16) or TCD.
Protocol 2: H₂-TPR for Metal Oxide Reduction
- Pretreatment: Load 50 mg of sample. Oxidize in 5% O₂/He (30 mL/min) at 500 °C for 30 min. Cool to 50 °C under inert gas.
- Reduction: Switch gas to 5% H₂/Ar (total flow 50 mL/min). Stabilize the baseline for 15 min.
- Temperature Program: Initiate a linear heating ramp (β = 10 °C/min) from 50 °C to 900 °C. Hold at 900 °C for 10 min if needed.
- Quantification: Calibrate the TCD signal with a known quantity of a standard (e.g., CuO) to calculate H₂ consumption.
Visualizations
TPD Parameter Optimization Workflow
Effect of Gas Flow Rate on TPD/TPR Data Quality
The Scientist's Toolkit: Research Reagent Solutions
| Item | Function & Importance in TPD/TPR/TPO |
|---|---|
| Mass Flow Controllers (MFCs) | Precisely regulate the flow rates of carrier/reactive gases (He, Ar, H₂, O₂ mixtures). Critical for reproducible gas composition and avoiding flow fluctuations that ruin baselines. |
| Thermocouple (K-type) | Accurately measures sample temperature. Must be in direct contact with the sample bed for a true reading, not just the furnace temperature. |
| Calibrated MS or TCD | Mass Spectrometer (MS): Detects specific desorbed molecules (e.g., m/z for NH₃, H₂, CO₂). Thermal Conductivity Detector (TCD): Measures bulk concentration changes in the effluent. Both require calibration for quantification. |
| High-Purity Gases & Traps | Carrier and reactive gases must be ultra-high purity (≥99.999%). Use inline moisture and oxygen traps to prevent sample contamination during pretreatment or adsorption steps. |
| U-shaped Quartz Micro-Reactor | Holds the catalyst sample. Quartz is inert at high temperatures. The U-shape helps contain the sample bed and ensures the thermocouple is well-positioned. |
| Temperature Programmer/Controller | Executes the precise linear heating ramp (β). A reliable, calibrated controller is non-negotiable for comparing data between experiments. |
Troubleshooting Guides & FAQs
Q1: My TPD peak appears broader than expected, with a lower peak temperature (Tm). What could be the cause? A: Broad, low-temperature peaks often indicate a heterogeneous surface or the presence of multiple, weakly bound adsorption states. Key troubleshooting steps:
- Check Sample Pretreatment: Inadequate cleaning or reduction can leave residual species that desorb at low temperatures. Ensure your pre-treatment protocol (temperature, duration, gas flow) is rigorously followed and documented.
- Verify Heating Rate: An unexpectedly slow heating rate will broaden the peak and lower Tm. Calibrate your furnace/heater and confirm the programmed rate matches the actual sample ramp.
- Examine Gas Diffusion: Poor mass transport in the sample bed can cause broadening. Use a smaller sample mass (typically 10-50 mg) and ensure the particle size is consistent and not too fine to avoid pressure gradients.
- Consider Re-adsorption: Desorbed molecules can re-adsorb on cooler parts of the reactor or the sample bed itself, broadening the peak. Increase carrier gas flow rate to improve removal of desorbed species.
Q2: The peak area (representing total desorption) is not reproducible between identical experiments. How can I fix this? A: Non-reproducible peak areas point to inconsistencies in the adsorbed amount or detection system.
- Standardize Adsorption Step: Precisely control adsorption conditions: partial pressure, exposure time, and temperature. Use a calibrated dosing system if possible. Ensure the sample is at the same initial state (oxidation/reduction) before each adsorption.
- Check for Leaks: A small leak in the system will alter the baseline and affect quantitative mass spectrometry signals. Perform a leak check (e.g., with helium) before your experiment series.
- Calibrate the Detector: For MS detectors, regularly calibrate the sensitivity for the mass-to-charge (m/z) signal you are monitoring using a standard gas mixture. For TCD detectors, ensure filament current and bridge balance are stable.
- Verify Sample Mass: Accurately weigh the sample for each experiment. Even small variations can cause significant area differences for highly active materials.
Q3: My peak shape is asymmetrical (e.g., a sharp leading edge and a trailing tail). What does this mean, and is it a problem? A: Asymmetry provides kinetic information. A tailing edge often suggests a first-order desorption process where the rate depends only on the surface coverage. A sharp leading edge can indicate a change in the desorption mechanism at higher temperatures or the influence of re-adsorption. It is not inherently a problem but a feature to interpret. Model the peak shape using Polanyi-Wigner equation fits to extract accurate activation energies (Ed).
Q4: The baseline drifts significantly during my TPD run. How can I stabilize it? A: Baseline drift compromises peak integration.
- Condition the System: Run several blank TPD cycles (with an empty reactor or inert material) up to your maximum temperature to desorb contaminants from the reactor walls and fittings.
- Thermally Equilibrate: Start data acquisition well before the temperature ramp begins to establish a stable baseline. Ensure the entire gas flow path is at a stable, constant temperature.
- Use High-Purity Gases: Impurities in the carrier gas can desorb over time. Use ultra-high purity gases (99.999%) with additional inline gas purifiers (e.g., traps for water and oxygen).
- Balance the TCD: If using a TCD, allow ample time for the detector to stabilize, and ensure the reference flow is perfectly matched and stable.
Table 1: Common Heating Rate Effects on TPD Peak Parameters (for a Single Desorption Process)
| Heating Rate (β, K/min) | Peak Temperature (Tm) | Peak Width (FWHM) | Peak Area |
|---|---|---|---|
| 5 | Lower | Narrower | Constant |
| 10 | Baseline | Baseline | Constant |
| 20 | Higher | Broader | Constant |
| 30 | Significantly Higher | Significantly Broader | Constant |
Table 2: Troubleshooting Common TPD Peak Issues
| Symptom | Likely Causes | Corrective Actions |
|---|---|---|
| Broad, low Tm peak | Heterogeneous sites, slow heating rate, re-adsorption, diffusion limits | Standardize pretreatment, calibrate heater, increase gas flow, reduce sample mass |
| Irreproducible peak area | Inconsistent adsorption step, system leak, detector drift, variable sample mass | Control adsorption parameters, leak check, calibrate detector, accurate sample weighing |
| Multiple overlapping peaks | Multiple distinct adsorption states/strengths on the surface | Use a lower heating rate for better resolution, apply peak deconvolution analysis |
| Noisy or drifting baseline | System contaminants, unstable detector, impure carrier gas, thermal instability | System conditioning, thermal equilibration, use high-purity gases with traps, stabilize TCD bridge |
Experimental Protocol: Standard TPD for Acid Site Characterization on Catalysts
Objective: To quantify the strength and population of acid sites on a solid catalyst via ammonia desorption.
Materials:
- Catalyst sample (50 mg, 250-500 μm sieve fraction)
- Quartz U-tube microreactor
- Thermostatted furnace with programmable temperature controller
- Mass Spectrometer (MS) detector (primary) or Thermal Conductivity Detector (TCD).
- High-purity carrier gas (He or Ar, 99.999%)
- High-purity ammonia (NH₃, 5% in He for adsorption)
- Liquid N₂ trap (if using TCD).
Methodology:
- Pretreatment: Load the sample into the reactor. Heat to 500°C (10°C/min) under 30 mL/min helium flow and hold for 1 hour to clean the surface. Cool to 100°C.
- Ammonia Adsorption: Switch the gas flow to 5% NH₃/He at 30 mL/min for 30-60 minutes at 100°C to saturate acid sites.
- Physisorbed NH₃ Removal: Switch back to pure helium flow (30 mL/min) at 100°C for 1-2 hours to flush the reactor and remove weakly physisorbed ammonia until the detector signal returns to baseline.
- Temperature Programmed Desorption: Initiate the temperature ramp (typically 10°C/min) from 100°C to a final temperature of 600-700°C under continuous helium flow (30 mL/min). Monitor the MS signal at m/z = 16 or 17 (or the TCD signal).
- Data Analysis: Record the desorption profile. Determine the peak temperature(s) (Tm). Integrate the peak area. Calibrate the detector response using known pulses of NH₃ to convert the area to an absolute quantity of acid sites (μmol/g).
Visualization: TPD Experiment Workflow & Data Interpretation Logic
Title: TPD Experimental and Data Analysis Workflow
Title: Diagnostic Logic for Common TPD Peak Issues
The Scientist's Toolkit: Key Research Reagent Solutions
Table 3: Essential Materials for Temperature Programmed Desorption (TPD) Experiments
| Item | Function & Importance |
|---|---|
| Quartz Wool & Reactor Tubes | Inert, high-temperature support material for holding the catalyst bed. Prevents sample blow-by and ensures even gas flow. |
| High-Purity Carrier Gases (He, Ar) | Inert gas stream that carries desorbed molecules to the detector. Purity (>99.999%) is critical to avoid contaminant peaks and baseline drift. |
| Calibrated Probe Gases (e.g., 5% NH₃, CO₂, CO in He) | Standardized mixtures for reproducible adsorption. Used for acid/base site (NH₃/CO₂) or metal site (CO) characterization. |
| Micromeritics AutoChem or Equivalent Chemisorption Analyzer | Automated instrument for precise temperature control, gas switching, and data acquisition, ensuring reproducibility. |
| Mass Spectrometer (MS) Detector | Provides species-specific detection (via m/z), enabling the study of complex desorption processes and reaction products during TPD/TPR/TPO. |
| Thermal Conductivity Detector (TCD) | Universal detector that compares the thermal conductivity of the carrier gas with the effluent gas. Simpler but non-specific. |
| Sieves (e.g., 250-500 μm mesh) | Used to achieve a uniform catalyst particle size, minimizing internal diffusion effects and pressure drop across the bed. |
| In-line Gas Purifiers/Traps | Removes trace O₂, H₂O, and hydrocarbons from carrier and probe gases, which is essential for studying clean surface chemistry. |
Troubleshooting Guides & FAQs
FAQs: Common Issues in TPD/TPR/TPO Analysis
Q1: Why is my TPD (e.g., NH3-TPD) profile showing a very broad, poorly resolved desorption peak? A: Broad peaks often indicate a heterogeneous distribution of site strengths or diffusion limitations. Ensure your sample is finely powdered and uniformly packed. A common culprit is an overly rapid heating rate; try reducing from 10 °C/min to 5 °C/min or lower to improve resolution between weak, medium, and strong acid sites. Also, verify that your carrier gas flow rate is stable and appropriate for your reactor volume (typically 30-50 mL/min for a standard micro-reactor).
Q2: During TPR, my hydrogen consumption peak is shifted to a much higher temperature than literature values for the same material. What could cause this? A: A high-temperature shift suggests stronger metal-support interaction or reducibility issues. Key checks:
- Calcination History: Over-calcination can lead to sintering or compound formation. Review your pre-treatment temperature and duration.
- Particle Size: Larger particles reduce more slowly. Confirm metal dispersion via complementary techniques (e.g., CO chemisorption).
- Moisture: Ensure your carrier gas (e.g., 5% H2/Ar) is thoroughly dried, as moisture inhibits reduction.
- Heating Rate: Excessively high heating rates can cause thermal lag, shifting peaks higher. Calibrate your thermocouple position.
Q3: In TPO, I observe multiple, overlapping oxidation peaks. How can I deconvolute contributions from different carbon species or oxidation states? A: Multiple peaks indicate distinct reactive species (e.g., surface carbon vs. graphitic carbon, or different metal oxidation states). To deconvolute:
- Program Optimization: Perform a series of TPO runs with varying heating rates. Using a kinetic analysis (e.g., Redhead method for first-order processes) can help estimate activation energies for each peak.
- Pre- and Post-Analysis: Characterize the sample pre-TPO (via XRD, XPS) and the residue post-TPO (via elemental analysis) to identify species.
- Model Deconvolution: Use software (e.g., Origin, PeakFit) to mathematically fit the profile to multiple Gaussian or asymmetric peaks, ensuring each fit is physically justifiable.
Q4: My baseline drifts significantly during a temperature ramp. How can I stabilize it? A: Baseline drift undermines quantitative analysis. Follow this protocol:
- Condition the System: Run several blank experiments (empty reactor or inert material) with your full temperature program to condition the column and detector.
- Check Gas Purity & Leaks: Ensure all gas lines are leak-free and use high-purity gases with proper traps (e.g., moisture, oxygen traps).
- Thermal Equilibrium: Allow sufficient time for the system to equilibrate at the initial temperature before starting the ramp. A 30-minute isothermal hold can stabilize the baseline.
- Balance the Detector: For thermal conductivity detectors (TCD), meticulously match the reference and sample cell flows and resistances.
Q5: How do I quantitatively calculate the number of acid sites or amount of reducible metal from my TPD/TPR profile? A: Quantification requires careful calibration.
- Calibration Step: Inject a known volume of pure analyte (e.g., NH3, CO2, H2) via a calibration loop into your TCD. This creates a peak area corresponding to a known moles of gas.
- Calculation: Integrate the area under your sample's desorption/reduction peak. Use the calibration factor (moles/area unit) to calculate total moles of gas consumed/desorbed.
- Formula:
Total Sites (μmol/g) = [ (Peak Area_sample) / (Peak Area_calibration) ] * (Moles injected_calibration) / (Mass of sample in g)
Experimental Protocols for Key Measurements
Protocol 1: Standard NH3-TPD for Total Acidity and Strength Distribution Objective: To quantify the concentration and strength of acid sites on a solid catalyst. Materials: See "Research Reagent Solutions" table. Procedure:
- Pre-treatment: Load 50-100 mg of catalyst into a quartz U-tube reactor. Heat to 500 °C (10 °C/min) under He flow (30 mL/min) for 1 hour. Cool to 100 °C.
- Adsorption: Switch to a 5% NH3/He flow (30 mL/min) for 60 minutes at 100 °C.
- Physisorbed NH3 Removal: Switch back to pure He flow (30 mL/min). Maintain at 100 °C for 1-2 hours to remove weakly bound/physisorbed ammonia.
- Desorption (TPD): With He flow, ramp temperature from 100 °C to 700 °C at 10 °C/min. Monitor desorbed NH3 with a TCD.
- Calibration: After the run, inject known pulses of pure NH3 via a calibration loop for quantitative analysis.
Protocol 2: H2-TPR for Reducibility and Metal Dispersion Assessment Objective: To determine the reduction profile of a metal oxide and estimate metal dispersion. Materials: See "Research Reagent Solutions" table. Procedure:
- Pre-treatment: Load 20-50 mg of sample. Heat to 300 °C (10 °C/min) under Ar flow (30 mL/min) for 1 hour to remove adsorbates. Cool to 50 °C.
- Stabilization: Switch to 5% H2/Ar (30 mL/min). Stabilize baseline at 50 °C for 15 minutes.
- Reduction (TPR): Ramp temperature from 50 °C to 900 °C at 5-10 °C/min under the 5% H2/Ar flow. Monitor H2 consumption via TCD.
- Calibration: After the run, inject known pulses of pure H2 or use a known mass of a standard (e.g., CuO) for quantification.
- Dispersion Estimation (Simplified): For supported metals, assuming a stoichiometry (H2/Metal = 1), the total H2 consumed gives reducible metal atoms. Combined with total metal loading from ICP, a dispersion (%) can be estimated.
Data Presentation: Typical TPD/TPR Quantitative Parameters
Table 1: Interpretation of Thermal Profile Data for Material Properties
| Technique | Probed Property | Key Quantitative Output | Typical Values for Benchmark Materials | Inference from Peak Temperature |
|---|---|---|---|---|
| NH3-TPD | Acidity | Total Acid Density (μmol NH3/g) | γ-Al2O3: 200-400 μmol/gH-ZSM-5 (Si/Al=15): ~800 μmol/g | Low-T Peak (~200°C): Weak acid sitesHigh-T Peak (>400°C): Strong acid sites |
| CO2-TPD | Basicity | Total Base Density (μmol CO2/g) | MgO: 10-20 μmol/m²CaO: > MgO | < 200°C: Weak base (OH-)200-500°C: Medium strength>500°C: Strong (anionic O2-) |
| H2-TPR | Reducibility, Metal-Support Interaction | H2 Consumption (μmol/g), Peak Temp. (Tmax) | 5% Pt/Al2O3: Tmax ~200°CNiO/SiO2: Tmax ~400°CFe2O3: Peaks at ~400°C & 600°C | Lower Tmax: Easier reducibility, weaker interaction. Multiple peaks: distinct reducible species. |
| H2/O2 Chemisorption | Metal Dispersion | Dispersion (D%), Metal Surface Area (m²/g) | Pt/Al2O3 (good): D% > 60%Ni/SiO2 (moderate): D% 20-40% | Higher D% indicates smaller, well-distributed metal particles. |
Visualization: Experimental Workflow & Data Interpretation Logic
Title: TPD/TPR Experimental Sequence
Title: Interpreting Thermal Profile Features
The Scientist's Toolkit: Research Reagent Solutions
Table 2: Essential Materials for TPD/TPR/TPO Experiments
| Item | Function / Role | Key Considerations for Selection |
|---|---|---|
| Quartz U-Tube Reactor | Holds the catalyst sample during pre-treatment and analysis. | Inert at high temperatures (up to 1000°C), minimal catalytic activity. |
| High-Purity Gases (He, Ar, 5% H2/Ar, 5% NH3/He, 2% O2/He) | Used as carrier, reactive, or calibration gases. | Essential for stable baselines. Use with appropriate traps (moisture, oxygen) and mass flow controllers. |
| Thermal Conductivity Detector (TCD) | Measures the concentration of desorbed/reactive gases in the effluent stream. | Requires a reference gas flow. Calibrate frequently for quantification. |
| Temperature-Controlled Furnace | Provides precise, programmable heating of the sample reactor. | Uniform heating zone and accurate temperature control/measurement are critical. |
| Calibration Loop (e.g., 1 mL) | Allows injection of a precise volume of pure gas for quantitative calibration. | Must be at a constant, known temperature during injection. |
| Cold Trap (Isopropanol/LN2) | Placed before the TCD to condense water or other by-products that could damage the detector. | Protects the detector and improves signal stability. |
| Reference Catalyst (e.g., CuO, γ-Al2O3) | A material with known desorption/reduction properties used to validate instrument performance. | Allows comparison between labs and checks calibration. |
| Data Acquisition & Analysis Software | Records TCD signal vs. temperature/time and allows for peak integration and analysis. | Must allow for smooth baseline subtraction and peak deconvolution capabilities. |
Advanced Method Design: Step-by-Step Protocols for TPD TPR TPO Setup and Execution
Technical Support Center: Troubleshooting Guides and FAQs
FAQ Section
Q1: Why is my TPD/TPR/TPO baseline unstable during the initial temperature ramp, and how can I fix it? A: An unstable baseline is frequently caused by incomplete sample cleaning or degassing. Residual moisture or adsorbed atmospheric gases (e.g., CO₂, O₂) desorb during the ramp, creating signal noise. Ensure your pre-treatment protocol includes:
- Extended purging: Purge with inert gas (He, Ar) for a minimum of 60 minutes at a temperature just above ambient (e.g., 110°C) but below your first activation or reaction temperature.
- Proper cooling: After high-temperature pre-treatment, cool the sample under continuous gas flow to prevent re-adsorption.
- Check gas lines: Ensure carrier gas lines are leak-free and that gas purifiers (e.g., oxygen traps, moisture filters) are active and not exhausted.
Q2: How do I determine the optimal temperature and hold time for sample reduction in TPR? A: The optimal protocol is catalyst-specific, but a standard diagnostic experiment can be performed. Run a series of TPR experiments on identical samples with varying maximum reduction temperatures (e.g., 300°C, 400°C, 500°C, 600°C). Analyze the hydrogen consumption peaks. The minimum temperature required for complete consumption of the target metal oxide, without causing sintering or support decomposition, is optimal. Refer to the quantitative data in Table 1 for a typical screening result.
Table 1: TPR Peak Hydrogen Consumption as a Function of Max Reduction Temperature (Example for a NiO/Al₂O₃ Catalyst)
| Maximum Reduction Temperature (°C) | Total H₂ Consumption (µmol/g) | Peak Resolution (Number of Distinct Peaks) | Notes |
|---|---|---|---|
| 400 | 850 | 1 | Incomplete reduction of NiO. |
| 500 | 1240 | 2 | Complete reduction. Two distinct NiO species resolved. |
| 600 | 1250 | 2 | Complete reduction. Minor peak broadening indicates onset of sintering. |
| 700 | 1300 | 1 | Severe sintering; peak merging occurs. |
Q3: My TPO experiment shows broad, overlapping oxidation peaks. How can I improve resolution? A: Broad peaks often result from poor sample standardization or non-uniform oxidation. Implement these steps:
- Standardized sample preparation: Use a precise mass (typically 20-50 mg) and ensure consistent particle size (e.g., sieve to 150-250 µm). Pack the sample bed uniformly with quartz wool.
- Lower heating rate: Reduce the linear heating rate from a standard 10°C/min to 5°C/min or even 2°C/min to separate overlapping oxidation events.
- Pre-treatment activation: Ensure the sample is in a fully reduced and clean state before TPO begins, using the protocols in the workflow diagram.
Q4: What is the purpose of an "activation" step prior to TPD, and when is it necessary? A: Activation prepares the sample's surface in a reproducible state for subsequent probe molecule adsorption. It is always necessary. The protocol removes surface contaminants and, for zeolites or certain oxides, creates the desired acid site (e.g., Brønsted sites via high-temperature calcination). A typical protocol involves heating in inert or dry air flow (e.g., 500°C for 1 hour) followed by cooling under vacuum or inert flow to the adsorption temperature.
Detailed Experimental Protocols
Protocol 1: Standard Catalyst Pre-Treatment for TPR/TPO Analysis
- Weighing: Precisely weigh 20-50 mg of catalyst into a U-shaped quartz sample tube.
- Primary Cleaning: Place in reactor. Purge with inert gas (Ar, 30 mL/min) at room temperature for 15 min.
- Oxidative Activation (for TPR): Switch gas to 5% O₂/He (30 mL/min). Heat from RT to 400°C at 10°C/min. Hold for 60 minutes.
- Cooling & Purging: Cool to 120°C under oxidative flow. Switch to inert gas (He, 30 mL/min). Purge at 120°C for 30 minutes to remove physisorbed oxygen.
- Cool to Adsorption/Reduction Start Temperature: Cool to desired starting temperature (e.g., 50°C) under inert flow. The sample is now standardized for TPR.
Protocol 2: Acid Site Standardization for NH₃-TPD
- Initial Calcination: Load sample. Heat in dry air or inert flow (30 mL/min) to 550°C at 10°C/min. Hold for 2 hours.
- Cooling: Cool to 120°C under dry air/inert flow.
- NH₃ Adsorption: Switch gas stream to a calibrated 5% NH₃/He mixture (30 mL/min) for 60 minutes at 120°C.
- Physisorbed NH₃ Removal: Switch back to pure inert gas (He, 30 mL/min). Continue flowing at 120°C for 90-120 minutes until the TCD signal stabilizes, ensuring removal of all weakly bound NH₃.
- TPD Start: With baseline stable, begin the linear temperature ramp (e.g., 10°C/min to 700°C) under inert flow to desorb chemisorbed NH₃.
Visualizations
Diagram 1: Pre-Treatment Decision Workflow for TPD/TPR/TPO
Diagram 2: Protocol to Optimize TPR Reduction Temperature
The Scientist's Toolkit: Key Research Reagent Solutions
Table 2: Essential Materials for Pre-Treatment and TPD/TPR/TPO Analysis
| Item | Function | Critical Specification |
|---|---|---|
| Ultra-High Purity (UHP) Carrier Gases (He, Ar) | Inert carrier and purge gas. Must be free of O₂ and H₂O to prevent unwanted sample reactions during pre-treatment. | ≥ 99.999% purity, with integrated purifier/trap system. |
| Calibrated Gas Mixtures (e.g., 5% H₂/Ar, 5% O₂/He, 5% NH₃/He) | Used for reduction (TPR), oxidation (TPO), and probe molecule adsorption (TPD). Calibration ensures quantitative results. | Certified ±1% accuracy. Use with appropriate pressure regulators. |
| Quartz Wool & U-Shaped Quartz Reactor Tubes | Sample support and containment. Chemically inert at high temperatures (up to 1000°C). | High-silica content quartz to prevent catalytic activity. |
| Mass Flow Controllers (MFCs) | Precisely control gas flow rates (typically 20-50 mL/min). Reproducible flow is essential for stable baselines and quantification. | Calibrated for specific gases. ±1% full-scale accuracy. |
| Automated Gas Switching Valve | Allows sequential changes between purge, activation, and reactive gases without disturbing the sample or flow. | Must be leak-tight and computer-controlled for protocol automation. |
| Cryogenic Dewar (for TPD) | Used to cool a trap (often filled with liquid N₂) to condense and remove water or other contaminants from the gas stream before the detector. | For water removal post-reactor in TPR/TPO. |
Troubleshooting Guides & FAQs
This guide addresses common issues encountered in Temperature Programmed Desorption (TPD), Reduction (TPR), and Oxidation (TPO) experiments.
Q1: Why is my TPD spectrum showing multiple, poorly resolved desorption peaks? What could be the cause? A: This is often caused by an overly rapid heating rate or a non-uniform sample. A fast heating rate (e.g., >30 °C/min) can cause readsorption and broadening. Ensure a uniform, thin sample bed and reduce the heating rate to 5-15 °C/min for better resolution.
Q2: During a TPR experiment, the hydrogen consumption signal is very weak and noisy. How can I improve the signal-to-noise ratio? A: This typically indicates insufficient sample mass or a problem with the thermal conductivity detector (TCD). First, confirm the TCD reference and sample gas flows are balanced and stable. Increase the sample mass within the linear range of your reactor. Ensure the catalyst is properly reduced and dry. Use a lower heating rate (e.g., 5 °C/min) to enhance the signal.
Q3: In TPO, how do I distinguish between carbonaceous deposits burning off and the oxidation of my catalyst support? A: This requires careful calibration. Run a TPO on the fresh, clean catalyst support under identical conditions to establish a baseline. The mass spectrometer (MS) is crucial here. Monitor specific m/z ratios: CO₂ (m/z=44) for coke combustion versus O₂ (m/z=32) consumption for support oxidation. The peak temperatures will differ significantly (coke burns at 300-600°C, support oxidation may be higher).
Q4: My reproducibility between runs is poor. What are the key factors to control? A: The critical factors for reproducibility are:
- Sample Mass & Packing: Use a consistent mass and packing density in the reactor tube.
- Gas Flow Rate: Maintain precise, stable control of gas flow rates using mass flow controllers (MFCs).
- Moisture: Ensure the sample and gas lines are completely dry. Use traps and pre-treatment.
- Temperature Calibration: Regularly calibrate the thermocouple position and reading at the sample bed.
- Pre-Treatment Protocol: Follow an identical pre-treatment (cleaning, drying, pre-reduction) sequence before each analysis.
Experimental Protocols
Protocol 1: Standard TPD of Ammonia (NH₃-TPD) for Acid Site Characterization 1. Pre-treatment: Load 50-100 mg of catalyst in a quartz micro-reactor. Heat to 500°C (10 °C/min) under He flow (30 mL/min) for 1 hour to clean the surface. 2. Adsorption: Cool to 100°C. Switch to a 5% NH₃/He gas mixture (30 mL/min) for 30-60 minutes. 3. Physisorbed NH₃ Removal: Switch back to pure He (30 mL/min) at 100°C for 1-2 hours to purge weakly bound NH₃. 4. Desorption: Initiate the temperature program from 100°C to 700°C at a heating rate (β) of 10 °C/min under He flow. Monitor desorbed NH₃ via TCD or MS (m/z=16 or 17). 5. Data Analysis: Quantify acid site density by integrating the TPD peak area against a calibrated standard.
Protocol 2: Temperature Programmed Reduction (TPR) of a Metal Oxide Catalyst 1. Sample Preparation: Load 10-50 mg of sample (diluted with inert quartz if highly exothermic). Record exact weight. 2. Pre-treatment: Heat in Ar flow (20 mL/min) to 300°C (5 °C/min), hold for 30 min to remove contaminants. 3. Cool & Stabilize: Cool to 50°C under Ar. Switch gas to 5% H₂/Ar. Stabilize TCD baseline. 4. Reduction: Start the temperature program from 50°C to 900°C at β = 5-10 °C/min in the 5% H₂/Ar flow (20 mL/min). Monitor H₂ consumption via TCD. 5. Calibration: Perform a calibration run with a known mass of a standard (e.g., CuO) to quantify H₂ uptake.
Data Presentation
Table 1: Recommended Heating Rates (β) for Common TPD/TPR/TPO Analyses
| Analysis Type | Typical Sample | Objective | Optimal Heating Rate Range (°C/min) | Rationale |
|---|---|---|---|---|
| TPD (Acidity) | Zeolite, Alumina | Resolve weak/strong acid sites | 10 - 15 | Balances resolution and experiment time. |
| TPD (Basic Sites) | MgO, Cs/SiO₂ | Resolve basic site strength | 10 - 20 | Similar rationale to acid TPD. |
| TPR (Bulk Oxide) | NiO, CuO, Fe₂O₃ | Determine reduction profile | 5 - 10 | Prevents peak broadening from self-heating. |
| TPR (Supported Metal) | Pt/Al₂O₃, Co/SiO₂ | Identify metal-support interactions | 5 - 10 | Enhances resolution of overlapping peaks. |
| TPO (Coke Burn-off) | Spent Catalyst | Characterize coke reactivity | 10 - 15 | Adequate for typical oxidation kinetics. |
| TPO (Stability) | Carbon Material | Determine oxidation resistance | 5 - 10 | Improves accuracy of onset temperature. |
Table 2: Critical Troubleshooting Parameters and Adjustments
| Symptom | Possible Cause | Diagnostic Check | Corrective Action |
|---|---|---|---|
| Broad, asymmetric peaks | Gas channeling in bed | Check sample packing | Dilute with inert, repack uniformly |
| Negative dips in baseline | Flow imbalance in TCD | Check MFCs, seals | Re-balance TCD, check for leaks |
| Peak shifts between runs | Thermocouple position | Calibrate temperature | Fix thermocouple at sample bed |
| No signal | Detector off/ saturated | Inject calibration pulse | Check detector power, range |
| High baseline drift | Gas impurity / column bleed | Run blank (empty reactor) | Purge system longer, use higher purity gases |
The Scientist's Toolkit
Key Research Reagent Solutions & Materials
| Item | Function in TPD/TPR/TPO |
|---|---|
| Quartz Wool & Micro-Reactor | Provides an inert, high-temperature sample holder; quartz wool plugs contain the sample bed. |
| High-Purity Gases (He, Ar, 5% H₂/Ar, 5% O₂/He, 10% NH₃/He) | Inert carriers (He, Ar), reactive gases for reduction (H₂), oxidation (O₂), and probe molecules (NH₃, CO₂). |
| Thermal Conductivity Detector (TCD) | Universal detector that measures changes in gas thermal conductivity (e.g., H₂ consumption in TPR, NH₃ release in TPD). |
| Mass Spectrometer (MS) System | Provides definitive identification of desorbing/products gases (e.g., CO₂ vs. H₂O during TPO) for complex analyses. |
| Calibration Standard (e.g., Pure CuO) | Used to quantify the amount of gas consumed/released by comparing peak area to a known standard. |
| Mass Flow Controllers (MFCs) | Precisely regulate the flow rates of gases into the reactor, critical for reproducible partial pressures and detection. |
| Inert Diluent (Pure SiO₂ or α-Al₂O₃) | Dilutes exothermic samples to prevent temperature gradients and "hot spots" during TPR/TPO. |
| Cold Trap (e.g., Isopropanol/LN₂) | Removes water and other condensable vapors from gas lines before they reach the detector, protecting it and improving baseline stability. |
Visualizations
Selecting Gas Mixtures and Flow Rates for TPR (H2/Ar), TPO (O2/He), and TPD (Probe Molecules).
Technical Support Center
Troubleshooting Guides & FAQs
Q1: Why is there a negative or noisy baseline during my TPR experiment? A: This is commonly caused by trace oxygen or water impurities in the gas lines reacting with the sample or detector. Ensure proper gas purification (e.g., oxygen/moisture traps for H₂/Ar lines) and check for leaks in the entire system. Allow sufficient time for the system to equilibrate under carrier gas flow before starting the temperature program.
Q2: During TPO, my sample reduces instead of oxidizing. What could be wrong? A: The most likely cause is an oxygen-deficient mixture. Verify the O₂/He mixture composition with a dedicated analyzer. A too-high sample mass can also consume all local oxygen, creating a reducing microenvironment. Reduce sample mass to <20 mg and ensure adequate gas flow rate.
Q3: In TPD, why are my desorption peaks very broad and not well-resolved? A: Broad peaks often indicate diffusion limitations or a high rate of re-adsorption. Key fixes include: 1) Using a finer sample particle size (<100 µm) to minimize intra-particle diffusion, 2) Increasing the carrier gas flow rate to rapidly remove desorbed molecules, and 3) Ensuring the sample is properly degassed prior to the adsorption step.
Q4: How do I determine if my chosen gas flow rate is optimal? A: Perform a flow rate dependence test. Run the same experiment (e.g., a standard TPR of CuO) at different flow rates while keeping other parameters constant. Plot the obtained hydrogen consumption peak temperature and shape against flow rate. The optimal flow rate is where the peak shape is sharp and symmetric, and the peak temperature becomes invariant with further flow increase.
Q5: What causes tailing or multiple peaks in a TPR profile when a single peak is expected? A: Multiple or tailing peaks suggest non-uniform reduction, often due to: 1) Poorly dispersed metal oxides with varying particle sizes (leading to different reduction temperatures), 2) Successive reduction steps (e.g., Fe₂O₃ → Fe₃O₄ → Fe), or 3) Inadequate gas diffusion into the sample bed. Improve catalyst preparation for homogeneity and ensure a dilute, thin sample bed.
Data Presentation: Typical Gas Mixtures and Flow Rates
Table 1: Standard Gas Mixtures and Flow Rate Ranges for TPD, TPR, TPO
| Technique | Typical Gas Mixture | Common Composition (%) | Typical Flow Rate Range (mL/min) | Primary Function & Notes |
|---|---|---|---|---|
| TPR | H₂/Ar | 5-10% H₂, balance Ar | 20-60 | Reducing agent diluted in inert gas to control reaction rate and heat release. |
| TPO | O₂/He | 1-10% O₂, balance He | 20-50 | Oxidizing agent diluted in He (high thermal conductivity) for sensitive detection. |
| TPD (Acidic/Basic) | Probe/He | 1-5% NH₃ or CO₂, balance He | 30-60 | Probe molecule in inert carrier for adsorption, followed by pure He for desorption. |
| TPD (General) | Pure Inert | 100% He, Ar, or N₂ | 20-40 | Inert carrier to purge and desorb previously adsorbed species. |
Table 2: Troubleshooting Flow Rate Effects
| Symptom | Possible Flow Rate Issue | Recommended Action |
|---|---|---|
| Peak asymmetry (fronting) | Flow rate too low | Increase flow by 10 mL/min increments. |
| Peak broadening & low intensity | Flow rate too high or too low | Perform flow rate optimization test. |
| Irreproducible peak temperatures | Unstable or fluctuating flow | Calibrate Mass Flow Controllers (MFCs); check for leaks. |
| Excessive baseline drift during ramp | Flow/pressure not stabilized | Equilibrate system at set flow for >30 min before ramping. |
Experimental Protocols
Protocol 1: Optimization of Gas Flow Rate for TPR
- Calibration: Calibrate all MFCs using a bubble flowmeter.
- Sample Prep: Load a standard sample (e.g., 10 mg of CuO) into a U-shaped quartz reactor mixed with an inert diluent (SiO₂).
- Pretreatment: Purge with pure Ar at 30 mL/min for 30 min at 150°C.
- Experiment Series: Cool to 50°C. Switch to 5% H₂/Ar. Run separate TPR experiments from 50-500°C at 10°C/min using flow rates of 20, 30, 40, 50, and 60 mL/min.
- Analysis: Plot hydrogen consumption signal vs. temperature. Identify the flow rate where peak shape is sharp and the onset/temperature no longer shifts.
Protocol 2: Preparation and Execution of an NH₃-TPD Experiment
- Adsorption: Place 50 mg of catalyst in reactor. Pretreat in He flow (30 mL/min) at 500°C for 1h. Cool to 100°C. Switch to a 5% NH₃/He mixture for 30-60 minutes to saturate acid sites.
- Physisorbed NH₃ Removal: Switch to pure He at 100°C for 1-2 hours to remove weakly bound (physisorbed) NH₃ until a stable baseline is achieved.
- Desorption: Initiate the temperature program (e.g., ramp to 600°C at 10°C/min) under continuous He flow (30 mL/min).
- Detection: Monitor desorbed NH₃ via TCD or MS (m/z=16).
The Scientist's Toolkit
Table 3: Essential Research Reagent Solutions & Materials
| Item | Function in TPD/TPR/TPO |
|---|---|
| Certified Calibration Gas Cylinders (e.g., 5.0% H₂/Ar, 2.0% O₂/He) | Provide precise, reproducible reactant concentrations for quantitative analysis. |
| High-Purity Inert Gases (He, Ar, 99.999%+) | Act as carrier/diluent gases; high purity minimizes baseline noise and side reactions. |
| Gas Purification Traps (Oxygen Trap, Moisture Trap) | Remove trace impurities from gas lines that can poison catalysts or cause detector instability. |
| Quartz Wool & Reactor Tubes | Inert packing material to hold the catalyst bed in place within the high-temperature zone. |
| Inert Diluent (High-purity SiO₂, Al₂O₃) | Mixed with catalyst to prevent sintering, improve heat transfer, and reduce pressure drop. |
| Standard Reference Materials (e.g., CuO, Ag₂O) | Used to validate and calibrate instrument response and temperature accuracy. |
| Mass Flow Controller (MFC) | Precisely regulates and maintains the flow rate of gases into the reactor. |
| Thermal Conductivity Detector (TCD) or Mass Spectrometer (MS) | Detects changes in gas composition (TCD) or specific desorbed molecules (MS) during analysis. |
Visualizations
Title: TPR Gas Flow Rate Optimization Workflow
Title: Logic for Gas Selection in TPD, TPR, TPO
Frequently Asked Questions (FAQs) & Troubleshooting
Q1: During TPR/TPO analysis, my calibration curve shows poor linearity (R² < 0.99) when quantifying gas consumption/production. What could be the cause and how do I fix it? A: Poor linearity often stems from inconsistent standard injections or mass spectrometer detector saturation. First, ensure your gas standards (e.g., 1%, 2%, 5% H₂ in Ar for TPR) are prepared gravimetrically and are traceable. Verify the mass spectrometer (MS) tuning parameters: the detector voltage may be set too high for the higher concentration points, causing a non-linear response. Re-tune the MS for the specific m/z you are monitoring (e.g., m/z 2 for H₂, 18 for H₂O, 32 for O₂) using the instrument's automated tuning protocol focused on dynamic range. Re-run the calibration series from low to high concentration.
Q2: After a routine autotune, my MS signal for CO (m/z 28) during TPD is unstable and noisy. What steps should I take? A: This is a common post-tuning issue. The autotune may have optimized for total ion current (TIC) rather than for the specific, low-mass ions critical to your experiment. Manually tune the MS for the m/z range of interest.
- Introduce a small, constant leak of your calibration gas (e.g., 1% CO/He).
- Access the manual tuning parameters for the ion source.
- Sequentially adjust the electron energy (typically 70 eV), ion repeller voltage, and lens voltages while monitoring the signal stability and amplitude for m/z 28.
- The goal is a stable, sharp peak. Avoid maximizing the signal at the cost of stability. This manual optimization is crucial for temperature-programmed analyses where baseline stability is paramount.
Q3: My internal standard (e.g., Ar for TPR) shows a drifting signal over the course of a temperature program. How does this affect quantification and how can I correct it? A: A drift in the internal standard signal indicates changing total pressure or flow conditions, which will invalidate absolute quantification. This often stems from leaks, pressure regulator issues, or column blockages in the system.
- Troubleshooting: Perform a thorough leak check on the entire gas path, including the reactor and MS sampling line. Ensure your mass flow controllers (MFCs) are recently calibrated. For immediate data correction, you can apply a time-dependent internal standard correction factor in your data processing software, but the root cause must be addressed for publishable data.
Q4: How often should I perform a full mass spectrometer calibration and tuning for reliable TPD/TPR/TPO data? A: The frequency depends on usage, but a general protocol is:
- Daily: Tune/MS check using a protocol gas (e.g., perfluorotributylamine, PFTBA) to verify mass axis calibration and sensitivity.
- Weekly (or with each new experiment type): Perform a quantitative calibration curve using certified gas standards relevant to your analytes.
- After any maintenance: Always re-tune and re-calibrate after venting the system, cleaning the ion source, or replacing the filament.
Key Quantitative Data for Calibration
Table 1: Recommended Calibration Gases for Common TPD/TPR/TPO Analyses
| Analysis Type | Target Gases | Typical Standard Concentrations (Balance Inert Gas) | Critical m/z to Monitor |
|---|---|---|---|
| TPD (Acidity/Basicity) | NH₃, CO₂ | 0.5%, 1%, 2%, 5% | 17 (NH₃), 44 (CO₂) |
| TPR (Reduction) | H₂ | 1%, 2%, 5%, 10% | 2 (H₂) |
| TPO (Oxidation) | O₂ | 1%, 2%, 5%, 10% | 32 (O₂) |
| Pulse Chemisorption | CO, H₂ | 5%, 10% | 28 (CO), 2 (H₂) |
Table 2: Typical MS Tuning Parameters for Optimal Gas Analysis
| Tuning Parameter | Recommended Setting for Gas Analysis | Purpose/Impact |
|---|---|---|
| Electron Energy | 70 eV (Standard) | Standard ionization for reproducibility. |
| Emission Current | As per manuf. spec (e.g., 100 µA) | Controls ion yield. Too high can shorten filament life. |
| Ion Source Temp | 150 - 200 °C | Prevents condensation of reactive gases. |
| Multiplier Voltage | Set via autotune for target m/z | Defines detector gain. Critical for sensitivity. |
| Scan Rate | 0.5 - 2 sec/scan | Faster scans improve peak definition in sharp desorption events. |
Experimental Protocols
Protocol 1: Generating a Quantitative Calibration Curve for H₂ Consumption in TPR
Objective: To establish a conversion factor between MS signal area (counts) and moles of H₂ consumed.
Materials: See "Research Reagent Solutions" below.
Methodology:
- System Setup: Bypass the reactor. Connect the standard gas cylinder (e.g., 5% H₂/Ar) directly to the sampling inlet of the MS via a calibrated mass flow controller (MFC).
- Baseline: Flow pure Ar at the standard TPR flow rate (e.g., 30 mL/min). Record the baseline MS signal at m/z 2 for 5 minutes.
- Standard Injection:
a. Set the MFC to deliver the standard gas at a series of known flow rates (e.g., 2, 5, 10, 20 mL/min). Each flow rate simulates a different consumption rate.
b. At each flow rate, allow the signal to stabilize for 3-5 minutes. Record the stable MS signal intensity (in amps or counts) for m/z 2.
c. Calculate the molar flow rate (mol/min) for each step:
(Total Flow Rate) * (Standard Concentration) / Molar Volume. - Data Analysis: Plot the MS signal (y-axis) against the calculated molar flow rate (x-axis) for each step. Perform linear regression. The slope of the line is the calibration factor (signal per mol/min). The R² value must be >0.995.
Protocol 2: Manual Mass Spectrometer Tuning for Temperature-Programmed Desorption (TPD)
Objective: To optimize MS sensitivity and stability for specific desorbing species prior to a TPD experiment.
Methodology:
- Introduce Tuning Gas: Continuously introduce a low, constant flow of the gas you intend to monitor (e.g., 0.1% NH₃/He for acidity studies) into the MS.
- Access Tuning Software: Enter the manual tuning mode of your MS software. Focus on the specific m/z (e.g., 17 for NH₃).
- Optimize Parameters (Iteratively): a. Adjust the ion repeller voltage to maximize the signal. b. Fine-tune the lens voltages (e.g., Einzel lenses) to focus the ion beam, seeking a sharp peak shape. c. Slightly adjust the electron energy (e.g., +/- 5 eV from 70 eV). Sometimes lower energies reduce fragmentation and improve parent ion signal.
- Verify Stability: Monitor the tuned signal for 10-15 minutes. The intensity should not drift by more than 1-2%. Save this tuning method specifically for your TPD experiment.
The Scientist's Toolkit: Research Reagent Solutions
Table 3: Essential Materials for Calibration & Tuning in TPD/TPR/TPO
| Item | Function | Example/Specification |
|---|---|---|
| Certified Calibration Gas Mixtures | Provide known analyte concentrations to establish the quantitative relationship between MS signal and moles of gas. | 1%, 5%, 10% H₂ in Ar (for TPR); 1% CO/He (for chemisorption). Must be NIST-traceable. |
| Internal Standard Gas | Accounts for fluctuations in total pressure or flow rate during an experiment, improving quantification accuracy. | Inert gases like Ar (for TPR in H₂) or He (for TPO in O₂), added at a constant, known concentration. |
| MS Tuning Standard | Used to calibrate the mass axis and optimize relative ion abundances for general instrument performance. | Perfluorotributylamine (PFTBA), which produces ions across a wide mass range. |
| Calibrated Mass Flow Controller (MFC) | Precisely controls and measures the flow rate of gases during calibration and experiments. | Requires separate calibration for each gas used (H₂, O₂, He, Ar). |
| Leak Detection Fluid | Identifies microscopic leaks in gas fittings that can cause baseline drift and erroneous quantification. | Soap-based solution or dedicated electronic leak detector. |
| High-Temperature Septa | Provides a vacuum-tight seal for syringe injection of liquid standards (e.g., for TPD of solvents). | Silicone/PTFE septa rated for temperatures >300°C. |
Workflow & Relationship Diagrams
Title: Calibration & Experiment Workflow
Title: MS Tuning Troubleshooting Path
Technical Support Center: Troubleshooting & FAQs
FAQ 1: Why is my NH3-TPD profile showing a very broad desorption peak with no distinct maxima?
- Answer: Broad, ill-defined peaks in NH3-TPD often indicate a flawed temperature program or pretreatment issue. The most common causes are:
- Inadequate He flow during pretreatment: Residual moisture or contaminants interfere with NH3 adsorption. Ensure a high-purity He flow (>50 mL/min) for at least 60 minutes at your calcination temperature (e.g., 500°C) prior to adsorption.
- Insufficient NH3 adsorption/equilibration time: The sample must be fully saturated. For zeolites with high acid site density, extend the adsorption time at 100°C to 30-60 minutes.
- Excessive heating rate during desorption: A high ramp rate (e.g., >20°C/min) can merge distinct acid sites. Optimize by using a slower ramp (e.g., 10°C/min). Refer to Table 1 for optimized parameters.
FAQ 2: My H2-TPR baseline is unstable and drifts significantly. How can I fix this?
- Answer: Baseline drift in H2-TPR is typically a hardware or gas issue.
- Condition the TCD detector: Ensure the thermal conductivity detector (TCD) is properly conditioned with the analysis gas mixture (e.g., 5% H2/Ar) at the operating flow rate for several hours before analysis.
- Check gas purity and connections: Use ultra-high purity gases and ensure all gas lines are leak-tight. Even minor leaks or impurities (especially O2 or H2O) cause drift.
- Allow for thermal equilibration: Start data acquisition only after the furnace and sample have fully equilibrated at the starting temperature (e.g., 50°C) under carrier gas for at least 30 minutes.
- Perform a blank run: Always run a blank TPR (empty tube or inert material) with your program to subtract any system artifacts.
FAQ 3: How do I deconvolute overlapping peaks in my NH3-TPD profile to quantify weak, medium, and strong acid sites?
- Answer: Peak deconvolution requires a systematic approach:
- Obtain a high-quality profile first: Follow the optimized protocol in Table 1 to get a clean, reproducible signal.
- Use a multi-step TPD program: A common method is to adsorb NH3 at 150°C, then desorb in programmed steps (e.g., hold at 250°C, then 400°C, then final ramp to 600°C) to partially separate sites by strength.
- Employ mathematical deconvolution: Use software (e.g., Origin, PeakFit) to fit the profile with multiple Gaussian or asymmetric peak functions. The number of peaks is guided by the sample's known properties and step-TPD results. The area under each fitted peak is proportional to the concentration of that acid site type.
FAQ 4: In H2-TPR, the reduction peak for my metal oxide catalyst is much higher than literature values. What does this indicate?
- Answer: A shift to higher reduction temperature (Tmax) suggests stronger interaction between the metal oxide and the support (e.g., zeolite).
- Strong Metal-Support Interaction (SMSI): This is a common, often desirable, effect where the support stabilizes the oxide phase, making it harder to reduce.
- Large crystallite size or poor dispersion: Larger particles can reduce at slightly higher temperatures.
- Experimental parameter artifact: Verify your heating rate and H2 concentration. A faster heating rate shifts Tmax higher. Use standardized conditions (see Table 2) for valid comparison.
Optimized Experimental Protocols & Data
Table 1: Optimized NH3-TPD Protocol for Zeolite Acidity
| Step | Parameter | Typical Value | Purpose & Rationale |
|---|---|---|---|
| 1. Pretreatment | Gas, Flow Rate | He, 50 mL/min | Remove physisorbed H2O and contaminants. |
| Temperature, Time | 500°C, 60 min | Activate zeolite, cleanse acid sites without dealumination. | |
| 2. Cooling & Adsorption | Cool to | 100°C | Optimal temp for specific NH3 chemisorption on acid sites. |
| Adsorption Gas | 5% NH3/He, 30 mL/min | Provides sufficient NH3 partial pressure for saturation. | |
| Adsorption Time | 30 min | Ensures complete saturation of all acid sites. | |
| 3. Physisorbed NH3 Removal | Gas, Flow Rate | He, 50 mL/min | Removes weakly bound/physisorbed NH3 from pores. |
| Temperature, Time | 100°C, 60-90 min | Critical for obtaining a clean baseline before desorption. | |
| 4. Desorption | Heating Rate (β) | 10°C/min | Key optimized parameter. Balances resolution and time. |
| Final Temperature | 600°C | Ensures desorption from strongest acid sites. | |
| Hold Time | 30 min | Ensures complete desorption for accurate quantification. |
Table 2: Optimized H2-TPR Protocol for Catalyst Reducibility
| Step | Parameter | Typical Value | Purpose & Rationale |
|---|---|---|---|
| 1. Pretreatment | Gas, Flow Rate | Ar or 5% O2/He, 30 mL/min | Oxidizes surface to a uniform state; choice depends on sample history. |
| Temperature, Time | 400°C, 30 min | Cleans surface without sintering. | |
| 2. Cooling | Cool to | 50°C | Starting point below water condensation temperature. |
| Cooling Gas | Inert (Ar/He) | Maintains sample environment. | |
| 3. Reduction | Reduction Gas | 5% H2/Ar, 30 mL/min | Standard, safe mixture for sensitive TCD. |
| Heating Rate (β) | 5-10°C/min | Key optimized parameter. Slower rates improve resolution. | |
| Final Temperature | 800-900°C | Must exceed expected reduction temperature. | |
| Hold Time | 10-15 min | Ensures complete reduction for accurate H2 consumption calculation. |
Visualization of Workflows
Diagram 1: NH3-TPD Experimental Workflow
Diagram 2: H2-TPR Data Interpretation Logic
The Scientist's Toolkit: Key Research Reagent Solutions
| Item | Function in TPD/TPR Analysis |
|---|---|
| 5% NH3 in He (Balance Gas) | Standard adsorbate for probing Brønsted and Lewis acid sites in TPD. The dilute mixture allows for controlled adsorption and safe operation. |
| 5% H2 in Ar (Balance Gas) | Standard reducing mixture for TPR. Ar is preferred over N2 as the balance gas due to its closer thermal conductivity to H2, improving TCD sensitivity and stability. |
| Ultra-High Purity Helium (UHP He) | Primary carrier and purge gas. Essential for maintaining an inert atmosphere and establishing a stable baseline. Must be oxygen-free. |
| Quartz Wool & Quartz Tube Reactor | Inert sample containment system. Quartz prevents unwanted catalytic reactions at high temperatures that can occur with metal reactors. |
| Thermal Conductivity Detector (TCD) | The core sensor. Measures the change in gas thermal conductivity due to NH3 or H2 consumption/desorption against the reference flow. |
| Temperature-Programmable Furnace | Provides precise, linear heating ramps (β). Critical control parameter for peak resolution and reproducibility. |
| Reference Material (e.g., CuO) | Used for calibrating H2 consumption in TPR. Known reduction profile validates instrument performance and quantification. |
Solving Common Problems: Troubleshooting Artifacts and Optimizing Signal Quality
Diagnosing and Correcting Baseline Drift and Poor Signal-to-Noise Ratios
Troubleshooting Guides & FAQs
Q1: What are the primary symptoms of baseline drift in my TPD/TPR/TPO analysis, and what are the likely causes? A: Symptoms include a non-horizontal baseline that shifts upwards or downwards over the temperature program. Common causes are:
- Unstable furnace temperature: Poor PID controller settings or oven wear.
- Carrier gas flow fluctuations: Leaks, clogged lines, or unstable regulator.
- Column bleed or detector contamination: Especially in mass spectrometers.
- Active sites in the flow path: Unpassivated surfaces adsorbing/desorbing analytes.
- Improper thermal equilibration: Starting the temperature ramp before the system is fully stabilized.
Q2: My signal is buried in noise, making it impossible to accurately identify desorption/ reaction peaks. How can I improve the Signal-to-Noise Ratio (SNR)? A: Poor SNR stems from low signal strength and/or high noise.
- To increase signal: Optimize sample mass, ensure catalyst/reagent is active, and verify detector settings (e.g., filament current, multiplier voltage) are within optimal range.
- To reduce noise: Use high-purity carrier gases with proper filters, employ signal averaging (increase time constant carefully), ground all instruments properly, shield cables from EMI, and ensure the detector is clean and properly maintained.
Q3: How do I systematically diagnose the source of a drifting baseline? A: Follow this isolation protocol:
- Run a blank experiment with no sample using your standard temperature program.
- Disconnect the reactor from the detector and cap the detector inlet. If drift persists, the issue is within the detector or electronics.
- If drift stops upon disconnection, reconnect and check all fittings and unions upstream for micro-leaks using a leak detector.
- Condition the system at the maximum temperature of your program for several hours to deactivate adsorption sites.
Q4: What temperature program parameters most directly affect baseline stability? A: The table below summarizes key parameters:
| Parameter | Effect on Baseline | Recommendation for Stabilization |
|---|---|---|
| Initial Hold Time | Insufficient time causes drift as system equilibrates. | Increase hold time (e.g., 30-60 min) at start temperature. |
| Ramp Rate | Excessively fast ramps induce thermal lag and detector instability. | Use moderate ramp rates (5-10°C/min) for better control. |
| Final Hold Time | Can reveal column bleed or system contamination at high T. | Observe baseline at max T; lengthen hold to identify drift source. |
| Carrier Gas Flow | Fluctuations directly cause baseline drift. | Use mass flow controllers (MFCs), check for leaks, and ensure consistent supply pressure. |
Q5: Are there established experimental protocols to correct for a drifting baseline during data processing? A: Yes, but correction during acquisition is always preferred. If necessary, use this post-processing protocol:
- Data Acquisition: Run an identical blank experiment under the same conditions (flow, temperature program).
- Baseline Recording: Record the blank run's detector signal as the "baseline trace."
- Subtraction: In your data analysis software, subtract the blank baseline trace from your sample run data trace.
- Validation: Ensure the subtraction does not introduce artifacts by checking that baseline regions in the corrected data are flat and near zero.
Q6: What are the best hardware solutions to prevent poor SNR and drift? A: Implement the following in your setup:
- Use Mass Flow Controllers (MFCs) instead of simple rotameters.
- Install high-capacity gas purifiers (e.g., for O₂, H₂O, hydrocarbons) in the carrier gas line.
- Employ a cold trap or water trap before the detector if using high moisture samples.
- Ensure all lines are properly passivated (e.g., SilcoTek coating) to minimize active sites.
- Use high-quality, shielded cables and a dedicated stable power supply for detectors.
Workflow for Baseline & SNR Diagnosis
Title: Systematic Troubleshooting Workflow for TPD Baseline & SNR Issues
The Scientist's Toolkit: Key Research Reagent Solutions
| Item | Function in TPD/TPR/TPO Analysis |
|---|---|
| High-Purity Calibration Gas Mixtures | Provides known concentration of analyte (e.g., H₂ in Ar, CO in He) for quantitative calibration of desorption/reaction peaks and detector response validation. |
| Thermocouple Calibration Solution | Standard material with known melting point (e.g., indium, tin) for verifying the accuracy of the sample thermocouple within the reactor. |
| Reference Catalyst | A well-characterized catalyst (e.g., Pt/Al₂O₃ for H₂-TPR) with known reduction profile to validate instrument performance and temperature accuracy. |
| Surface Passivation Standard | An inert, non-porous material (e.g., quartz wool, passivated metal beads) run as a blank to map system-derived background signals. |
| On-Line Gas Purifier/Filters | Removes trace impurities (O₂, H₂O, hydrocarbons) from carrier gases that can oxidize samples or cause baseline noise and drift. |
| Leak Detection Solution | A non-reactive, detectable fluid (e.g., Snoop leak detector) or a portable helium leak detector to identify micro-leaks in gas fittings. |
| Data Acquisition & Processing Software | Enables signal averaging, baseline subtraction, peak integration, and kinetic parameter extraction from corrected data. |
Technical Support Center: Troubleshooting TPD/TPR/TPO Temperature Programs
FAQs & Troubleshooting Guides
Q1: Why are my TPD/TPR peaks broad and poorly resolved? A: Broad peaks often indicate a heating rate that is too fast. A high heating rate does not allow sufficient time for desorption/reaction at each temperature step, leading to kinetic lag and peak broadening. This reduces the resolution between closely spaced surface states or reaction events.
Q2: How do I resolve overlapping peaks in my TPR profile? A: Peak overlap suggests multiple, simultaneous processes. While modifying the heating rate is primary, confirm sample homogeneity first. Then, implement a segmented or non-linear temperature program. A slower initial heating rate through the expected overlap region can improve separation.
Q3: What causes peak asymmetry (tailing or leading edges) and how is it related to heating rate? A: Asymmetry often stems from mass or heat transfer limitations within the catalyst bed, exacerbated by high heating rates. Tailing suggests slow desorption/diffusion from strong sites or bulk phases. A leading edge indicates a rapid process possibly followed by a rate-limiting step. Optimizing heating rate improves bed equilibrium.
Q4: How do I choose the optimal heating rate for a new material? A: Start with a standard rate (e.g., 10 °C/min) for an initial scan. If peaks are broad or overlap, perform a series of experiments at different rates (e.g., 5, 10, 15, 20 °C/min). Analyze the peak temperature (Tp), shape, and resolution. Use the Kissinger or Redhead analysis for activation energy, which requires multiple rates.
Q5: Can a variable heating rate program improve my analysis? A: Yes. Stepwise or rate-modulated programs are powerful. Use a slow rate over critical temperature ranges where multiple processes occur and a faster rate in inactive regions to save time. This requires preliminary knowledge of the desorption/reaction spectrum.
Quantitative Data on Heating Rate Effects
Table 1: Impact of Heating Rate (β) on Peak Characteristics in TPD/TPR
| Heating Rate (°C/min) | Peak Temp (Tp) Shift | Peak Width (FWHM) | Resolution of Adjacent Peaks | Comment |
|---|---|---|---|---|
| 5 | Lower | Narrower | High | Best resolution, long experiment time |
| 10 | Baseline | Baseline | Baseline | Standard compromise |
| 20 | Higher | Broader | Low | Risk of missing split peaks, fast run |
| 40 | Significantly Higher | Very Broad | Poor | Severe kinetic lag, not recommended for quantitative work |
Table 2: Example Kissinger Analysis Data for Ammonia TPD on Zeolite
| Heating Rate, β (K/min) | Peak Max, Tp (K) | ln(β/Tp²) | 1/Tp (x10⁻³ K⁻¹) |
|---|---|---|---|
| 5 | 623 | -11.52 | 1.605 |
| 10 | 641 | -10.79 | 1.560 |
| 15 | 653 | -10.43 | 1.531 |
| 20 | 662 | -10.19 | 1.511 |
| Slope from plot gives Ea/R |
Experimental Protocols
Protocol 1: Systematic Optimization of Heating Rate
- Preparation: Calibrate thermocouple at the sample position. Use a fixed, small sample mass (typically 10-50 mg) and consistent particle size (e.g., 150-250 µm).
- Pretreatment: Subject the sample to identical pretreatment (gas flow, temperature, duration) before each experiment.
- Experimental Series: Perform identical TPD/TPR experiments, changing only the linear heating rate (β). Suggested rates: 1, 2, 5, 10, 15, 20 °C/min.
- Data Analysis: Plot responses for each β. Measure Tp, FWHM, and peak symmetry for each peak. Create a Kissinger plot (ln(β/Tp²) vs. 1/Tp) for major peaks to determine apparent activation energy.
- Selection: Choose the rate that provides the best compromise between peak resolution, shape, and experiment duration for your specific analytical goal.
Protocol 2: Designing a Segmented Temperature Program for Peak Deconvolution
- Initial Scan: Run a standard linear program (10 °C/min) to identify regions of interest (ROI) and overlap.
- Program Design: In the instrument method editor, define segments:
- Segment 1: Ramp at 20 °C/min from start to 50 °C below the first ROI.
- Segment 2: Ramp at 2-5 °C/min through the overlapping peak region.
- Segment 3: Ramp at 10-15 °C/min to the final temperature.
- Validation: Run the new program and compare peak resolution and shape to the initial linear scan.
Diagrams
Title: Troubleshooting Workflow for Peak Shape Issues
Title: High Heating Rate Effects on Peak Shape
The Scientist's Toolkit: Research Reagent Solutions
Table 3: Essential Materials for TPD/TPR/TPO Optimization
| Item | Function | Specification Example |
|---|---|---|
| Ultra-High Purity Gases | Reduces background noise and unwanted reactions. | He, Ar, H₂/Ar (5-10%), O₂/He (1-5%); 99.999% purity with inline traps. |
| Calibrated Mass Flow Controllers (MFCs) | Ensures precise, reproducible gas flow for adsorption and purge steps. | Electronic, calibrated for specific gas ranges (e.g., 0-100 sccm). |
| Reference Catalyst | Validates instrument performance and temperature calibration. | Certified NiO/SiO₂ for TPR, CuO/ZrO₂ for TPO. |
| Precision Thermocouple | Accurate temperature measurement at the sample. | Type K (Chromel-Alumel) or Type S (Pt/Pt-Rh), positioned within the bed. |
| Quartz Reactor Tube (U-shaped) | Holds sample, inert at high temperatures, allows even gas flow. | High-purity quartz, consistent internal diameter (e.g., 4 mm). |
| Quartz Wool / Frit | Supports sample plug and prevents entrainment. | Acid-washed, calcined to remove contaminants. |
| Temperature Calibration Standard | Verifies the sample temperature vs. setpoint. | Materials with known magnetic transition (e.g., Nickel, Curie point wires) or melting point (In, Sn). |
| Data Acquisition & Analysis Software | Enables programming of complex temperature ramps and data deconvolution. | Software capable of creating multi-segment ramps and peak fitting. |
Avoiding Mass Transfer Limitations and Thermal Gradients in the Sample Bed
Troubleshooting Guides & FAQs
Q1: How can I diagnose if my TPD/TPR/TPO results are affected by mass transfer limitations? A: Symptoms include asymmetric or excessively broad peaks, shifts in peak temperature with changing sample mass or flow rate, and poor reproducibility of quantitative measurements (e.g., calculated activation energies). To diagnose, perform the Flow Rate Variation Test: Run identical experiments with varying total flow rates (e.g., 20, 30, 50 mL/min) while keeping other parameters constant. If the peak temperature shifts by more than 5-10°C or the peak area changes significantly, mass transfer limitations are likely present.
Q2: What are the primary causes of thermal gradients in the sample bed, and how do they manifest? A: Thermal gradients are caused by poor thermal conductivity of the sample/catalyst, excessive heating rates, and inadequate reactor design (e.g., large diameter, poor furnace insulation). Manifestations include multiple or "shouldering" peaks in the spectra, poor resolution between overlapping desorption/reaction events, and inconsistent results when sample position in the reactor is changed.
Q3: What specific experimental adjustments can minimize mass transfer and thermal issues? A: Implement the following protocol:
- Sample Preparation: Dilute the active sample (typically 10-50 mg) with a large excess (e.g., 10:1 ratio) of an inert, thermally conductive material like α-alumina or silicon carbide. This improves gas access and heat distribution.
- Reactor/Packaging: Use a quartz U-tube or straight-tube micro-reactor with a small internal diameter (typically 4-8 mm). Use quartz wool plugs that are minimal and consistent to hold a thin, uniform bed.
- Parameter Optimization: Reduce sample mass. Use lower heating rates (e.g., 5-10°C/min instead of 20°C/min). Increase the total gas flow rate to ensure a high space velocity.
- Validation Test: Perform the Weisz-Prater Criterion (for TPR/TPO) or Mears Criterion (for TPD) calculation using experimental data to quantitatively confirm the absence of limitations.
Table 1: Flow Rate Variation Test for Diagnosing Mass Transfer Limitations
| Sample Mass (mg) | Total Flow Rate (mL/min) | Observed Peak Temp. Tp (°C) | Peak Area (a.u.) | Interpretation |
|---|---|---|---|---|
| 20 | 20 | 345 | 1050 | Significant shift in Tp & area indicates mass transfer control. |
| 20 | 30 | 332 | 1210 | |
| 20 | 50 | 325 | 1250 | Ideal: No change in Tp or area. |
| 5 (Diluted) | 20 | 320 | 250 | Minimal shift confirms kinetic regime. |
| 5 (Diluted) | 50 | 318 | 255 |
Table 2: Effect of Sample Dilution & Heating Rate on Thermal Gradients
| Condition | Sample Bed Composition | Heating Rate β (°C/min) | Peak Width at Half Max. (ΔT, °C) | Resolution of Two Peaks 50°C apart |
|---|---|---|---|---|
| Baseline | 50 mg pure catalyst | 20 | 45 | Poor (Peaks merge) |
| Improved | 10 mg catalyst + 100 mg α-Al2O3 | 20 | 28 | Good (Valley visible) |
| Optimized | 10 mg catalyst + 100 mg α-Al2O3 | 10 | 18 | Excellent (Baseline separation) |
Detailed Experimental Protocols
Protocol 1: The Weisz-Prater Criterion Validation for TPR/TPO
- Objective: Quantitatively confirm the experiment is free of internal mass transfer limitations.
- Method:
- Perform a standard TPR/TPO experiment under your chosen conditions and obtain the observed rate of reaction (robs) in mol/(g·s).
- Measure or obtain from literature the effective diffusivity (De) of the reacting gas in your catalyst particle.
- Determine the surface concentration of the gas (Cs) from the bulk gas phase conditions.
- Calculate the Weisz-Prater parameter: ΦWP = (robs * ρcat * Rp²) / (De * Cs), where ρcat is pellet density and Rp is particle radius.
- Interpretation: If ΦWP << 1, no internal diffusion limitations. If ΦWP >> 1, results are severely limited by mass transfer.
Protocol 2: Thermal Homogeneity Check via Thermocouple Placement
- Objective: Empirically measure the temperature gradient within the sample bed.
- Method:
- Use a thin, dedicated reactor tube for this test.
- Pack the reactor with your standard diluted sample mixture.
- Insert two fine-gauge (e.g., 0.5 mm) K-type thermocouples. Position one at the center of the bed and the other at the edge of the bed, near the reactor wall.
- Run a standard temperature program (e.g., 10°C/min to 800°C) under inert flow.
- Record the temperature difference (ΔTcenter-wall) throughout the ramp.
- Acceptance Criterion: For reliable kinetics, ΔTcenter-wall should not exceed 2-3°C at any point during the ramp.
Visualization: Experimental Optimization Pathway
Diagram Title: TPD/TPR/TPO Bed Optimization Workflow
The Scientist's Toolkit: Essential Research Reagent Solutions
Table 3: Key Materials for Optimized Sample Bed Preparation
| Item | Function & Rationale |
|---|---|
| High-Purity α-Alumina (Al2O3) | Inert diluent. High thermal conductivity minimizes temperature gradients; its non-porous nature prevents unwanted adsorption. |
| Silicon Carbide (SiC) Powder | Alternative inert diluent. Superior thermal conductivity compared to Al2O3, ideal for very high-temperature studies. |
| Quartz Wool (High-Temp Grade) | Used to retain the sample plug. Must be used sparingly to avoid creating void volumes and flow channeling. |
| Fine-Gauge (0.25-0.5 mm) K-Type Thermocouples | For direct measurement of bed temperature, crucial for calibrating and validating furnace temperature readings. |
| Certified Calibration Gas Mixtures | For TPR/TPO. Accurate known concentrations of H2/Ar or O2/He are essential for quantitative consumption calculations. |
| Micron-Sized Sieve Fractions | To standardize catalyst particle size (e.g., 150-250 μm), ensuring consistent packing and reproducible inter-particle diffusion characteristics. |
Optimization Strategies for Weak Signals and High-Temperature Background.
Technical Support & Troubleshooting Center
FAQs & Troubleshooting Guides
Q1: During TPD/TPR analysis, my target desorption peak is very weak and obscured by a sloping, high-temperature background. What are the primary optimization strategies? A: The core strategy involves enhancing the signal-to-background ratio (S/N). Focus on:
- Mass Spectrometer Optimization: Ensure the MS filament is not depleted; increase electron energy (e.g., from 70 eV to 100 eV) for higher ionization efficiency of your target molecule. Clean the MS source and Q-rod lenses regularly.
- Signal Averaging: Increase the number of scans per data point. While this slows the experiment, it significantly reduces random noise.
- Baseline Subtraction: Run an identical temperature program with a blank, inert sample (e.g., empty quartz wool) to record the background profile. Subtract this from your sample data.
Q2: How do I optimize the heating rate (β) to resolve weak signals from a high background? A: The heating rate is a critical parameter. A slower rate decreases the background intensity and can separate overlapping peaks but may weaken the signal amplitude. A faster rate increases signal intensity but can broaden peaks and raise the background. You must empirically optimize.
Table 1: Effect of Heating Rate on Signal and Background
| Heating Rate (β, °C/min) | Signal Peak Height | Signal Peak Width | Background Intensity | Recommended Use Case |
|---|---|---|---|---|
| Low (1-5) | Lower | Narrower | Lower | Resolving closely spaced or very weak desorption events. |
| Medium (10-20) | Moderate | Moderate | Moderate | Standard analysis for well-defined peaks. |
| High (>30) | Higher | Broader | Higher | Screening for major desorption events or strong signals. |
Experimental Protocol: Determining Optimal Heating Rate
- Prepare three identical catalyst samples (e.g., 50 mg of 1% Pt/Al₂O₃).
- Load each into the microreactor and follow identical pre-treatment (reduction at 400°C in H₂).
- Perform TPD of a probe molecule (e.g., NH₃) using three different heating rates: 5, 10, and 20 °C/min.
- Record MS signals (e.g., m/z 16 for NH₂⁺ fragment).
- Compare the signal-to-noise ratio (S/N) and peak resolution using the formula: S/N = (Peak Height - Baseline Mean) / Baseline Standard Deviation.
Q3: What sample preparation steps can minimize high-temperature backgrounds? A: High backgrounds often originate from sample impurities or reactor wall effects.
- Support Pre-treatment: Calcine your catalyst support (e.g., Al₂O₃, SiO₂) at a temperature at least 50°C higher than your maximum TPD temperature to desorb residual water and carbonates.
- Reactor Tube Conditioning: Before sample loading, run a high-temperature bake-out (e.g., 800°C under He flow) on the empty reactor tube packed with quartz wool.
- Sample Mass Optimization: Use the minimal sample mass that gives a detectable signal (typically 20-100 mg). Excessive sample can create large, broad backgrounds.
Q4: My TPO experiment shows a large, broad CO₂ (m/z 44) background. How can I confirm it's from the sample and not system contamination? A: Implement a systematic blank test protocol. Experimental Protocol: Blank Test for TPO Background
- Empty Reactor Test: Run your exact TPO temperature program with an empty reactor (only quartz wool).
- Inert Support Test: Run the TPO program with the pure, pre-calcined catalyst support (without active metal).
- Sample Test: Run the TPO program with your actual catalyst sample.
- Analysis: Overlay the three m/z 44 profiles. A background present in all three traces indicates a system leak or contaminated gas line. A background appearing only with the support or full catalyst pinpoints the source.
Table 2: Key Research Reagent Solutions & Materials
| Item | Function & Importance |
|---|---|
| High-Purity Quartz Wool | Chemically inert packing material to hold powder samples; must be pre-cleaned at high temperature to avoid background signals. |
| Certified Calibration Gas Mixture | (e.g., 1% CO/Ar, 1% H₂/Ar). Essential for quantitative TPR/TPO and for calibrating the mass spectrometer sensitivity. |
| High-Surface-Area Reference Catalyst | (e.g., EuroPt-1, NIST-standardized Pt/SiO₂). Used to validate reactor and MS performance, and TPR hydrogen consumption calculations. |
| High-Temperature Septa | For sealing inlet ports during liquid probe molecule adsorption; must be inert and non-outgassing at the experiment temperature. |
| On-Line Cold Trap | Placed between reactor and MS to condense water or heavy hydrocarbons, protecting the MS detector and reducing background. |
Visualizations
Diagram 1: Workflow for Optimizing Weak Signal Detection
Diagram 2: TPD/TPR Experimental Optimization Pathway
Technical Support Center: Troubleshooting Guides and FAQs
This support center addresses common issues encountered when using advanced temperature programming techniques in Temperature-Programmed Desorption (TPD), Reduction (TPR), and Oxidation (TPO) analyses. Effective use of these programs is critical for accurate kinetic and thermodynamic parameter determination in catalyst characterization and drug development research.
Troubleshooting Guide
Issue 1: Poorly Resolved Peaks in Stepwise TPD
- Problem: Desorption peaks appear broad or overlapping, making deconvolution and quantification difficult.
- Possible Causes & Solutions:
- Cause: Temperature step size is too large. Solution: Reduce step increment (e.g., from 20°C to 5-10°C) to increase resolution.
- Cause: Insufficient isothermal hold time at each step. Solution: Extend hold time to allow complete desorption at each temperature before proceeding.
- Cause: Excessive gas flow rate. Solution: Reduce carrier gas flow to minimize dilution and improve detector response sharpness.
Issue 2: Baseline Drift During Long Isothermal Holds in TPO
- Problem: The signal baseline drifts significantly during prolonged constant-temperature oxidation experiments.
- Possible Causes & Solutions:
- Cause: Detector thermal instability. Solution: Ensure sufficient detector warm-up time (≥2 hours) and use instrument's baseline auto-zero function before the hold.
- Cause: Minor fluctuations in carrier gas purity or flow. Solution: Use high-purity gases with inline traps and ensure mass flow controller (MFC) calibration is current.
- Cause: Reactor/sample holder outgassing. Solution: Implement a more rigorous system bake-out protocol prior to the experiment.
Issue 3: Inconsistent Results with Modulated Temperature Programs for TPR
- Problem: Reproducibility is low between runs using sinusoidal or sawtooth temperature modulation.
- Possible Causes & Solutions:
- Cause: Modulation amplitude or frequency is too high for the reaction kinetics. Solution: Reduce amplitude (e.g., to ±5°C) and/or frequency. Validate with a known standard.
- Cause: Poor thermal conductivity of sample bed. Solution: Dilute sample with an inert, thermally conductive material (e.g., quartz wool, α-Al₂O₃) to ensure uniform temperature.
- Cause: Phase lag between furnace temperature and sample temperature. Solution: Characterize and account for the system's thermal lag by placing a thermocouple directly in a dummy sample bed.
Frequently Asked Questions (FAQs)
Q1: When should I use a stepwise program versus a linear ramp in TPD? A: Use a linear temperature ramp for initial exploratory scans to identify approximate desorption regions. Employ stepwise programs (with isothermal holds) for precise quantification of desorption energies and kinetic order determination, as they allow the system to reach equilibrium at each temperature, simplifying data analysis.
Q2: What is the optimal duration for an isothermal hold in a TPO experiment? A: The hold must be long enough for the complete consumption of the reactive species or for the signal to return to baseline. A general rule is to hold until the detector signal (e.g., for CO₂) stabilizes to within 1-2% of the baseline for at least 5-10 minutes. This can range from 15 minutes to several hours depending on the oxidation kinetics.
Q3: How does modulated temperature programming (MTP) improve my TPR/TPO analysis? A: MTP superimposes a small, periodic temperature oscillation on the main ramp. It enhances sensitivity by transforming the signal to a frequency domain, helping to distinguish reversible processes (like physisorption) from irreversible ones (like reduction/oxidation), and can improve the signal-to-noise ratio through phase-sensitive detection.
Q4: My stepwise program shows a spike in signal at the beginning of each new temperature step. Is this normal? A: A small transient is common due to rapid heating to the next setpoint. However, a large spike may indicate that the step increase is too abrupt or the hold time at the previous step was insufficient. Ensure the heating rate between steps is controlled and consider slightly lengthening the isothermal segments.
Table 1: Comparison of Advanced Temperature Program Types
| Program Type | Primary Use Case | Key Advantages | Typical Parameters | Data Output |
|---|---|---|---|---|
| Stepwise with Holds | Quantifying activation energies, equilibrium studies | Simplifies kinetic analysis, improves peak resolution | Step: 5-20°C, Hold: 5-30 min | Desorption rate vs. Time (at discrete T) |
| Isothermal Hold | Studying slow reactions, catalyst stability | Direct measurement of rate constants at fixed T | Hold T: 50-800°C, Duration: 15 min - 10 hrs | Concentration vs. Time (isothermal) |
| Modulated (MTP) | Distinguishing overlapping processes, noise reduction | Enhances sensitivity, deconvolutes complex profiles | Base Ramp: 5-10°C/min, Amp: ±1-10°C, Period: 30-120s | Phase-resolved rate vs. Average T |
Table 2: Troubleshooting Quantitative Parameters
| Symptom | Likely Parameter at Fault | Recommended Adjustment Range |
|---|---|---|
| Broad, overlapping peaks | Step size too large | Decrease to 5-10°C |
| Hold time too short | Increase to 10-30 min | |
| Baseline drift during hold | Gas flow instability | Stabilize at 20-50 mL/min, check MFC |
| Detector not stabilized | Allow ≥2 hours warm-up | |
| Poor MTP reproducibility | Modulation amplitude too high | Reduce to ±1-5°C |
| Sample thermal mass too high | Dilute sample 1:5 with inert diluent |
Experimental Protocols
Protocol 1: Stepwise TPD for Acid Site Quantification on Catalysts
- Pretreatment: Load 50-100 mg of catalyst into a U-shaped quartz reactor. Heat to 500°C (10°C/min) under He flow (30 mL/min) for 1 hour.
- Adsorption: Cool to 100°C under He. Switch to 5% NH₃/He flow for 30 minutes for saturation. Purge with pure He for 1 hour to remove physisorbed species.
- Stepwise Desorption: Program the furnace: Heat from 100°C to 600°C in steps of 10°C. Hold at each step for 15 minutes. Maintain He flow at 30 mL/min.
- Detection: Monitor desorbed NH₃ using a downstream mass spectrometer (m/z=16) or TCD. Integrate the signal at each hold to construct an accumulation curve.
Protocol 2: Modulated Temperature Programmed Oxidation (MTPO) for Coke Burn-Off
- Coking: Deactivate the catalyst sample in a reaction stream to deposit coke.
- MTPO Setup: Place 20-50 mg coked sample in the reactor. Set gas to 5% O₂/He at 40 mL/min.
- Program: Set a base linear ramp from 150°C to 700°C at 2°C/min. Superimpose a sinusoidal modulation with an amplitude of ±3°C and a period of 60 seconds.
- Analysis: Monitor CO₂ (m/z=44) with an MS. Use phase-sensitive detection (lock-in amplifier software) to isolate the reversible (in-phase) and irreversible (out-of-phase) components of the oxidation signal.
Visualizations
Title: Stepwise TPD Program Logic Flow
Title: MTP Signal Deconvolution Workflow
The Scientist's Toolkit: Research Reagent Solutions
| Item | Function in TPD/TPR/TPO Experiments |
|---|---|
| High-Purity Carrier Gases (He, Ar) | Inert gas for TPD/TPR; provides consistent atmosphere, carries desorbed/products to detector. |
| Calibrated Gas Mixtures (e.g., 5% H₂/Ar, 5% O₂/He) | Standardized reactive gases for TPR and TPO experiments, ensuring reproducible reducing/oxidizing conditions. |
| Thermally Stable Inert Diluent (α-Al₂O₃, Quartz Wool) | Improves thermal conductivity in the sample bed, prevents channeling, and ensures uniform temperature. |
| Calibration Standard (e.g., CuO for TPR, NH₄ZSM-5 for TPD) | Reference material with known reduction/desorption properties to validate instrument and program performance. |
| Mass Spectrometer Calibration Gas | Known mixture (e.g., CO₂ in He) for quantitative calibration of MS detectors used in effluent analysis. |
| High-Temperature Catalyst Sieves (60-80 mesh) | Standardized particle size to balance mass transfer limitations and pressure drop in the microreactor. |
Ensuring Data Integrity: Validation Against Complementary Techniques and Kinetic Modeling
Cross-Validation with BET, XRD, XPS, and FTIR for Comprehensive Characterization
Technical Support Center: Troubleshooting & FAQs
FAQ & Troubleshooting Guide for Integrated Characterization
Q1: During cross-validation, my BET surface area decreases after a TPO/TPD run, but XRD shows no change in bulk crystallinity. What is the issue? A: This indicates potential pore blockage or surface contamination not detectable by XRD. First, run an FTIR to check for carbonaceous deposits or strongly adsorbed species (e.g., ~1450 cm⁻¹ for carbonates). If FTIR is negative, perform XPS on the used sample. Look for the Si 2p or Al 2p signal if you used a silica/alumina support; their attenuation confirms pore blockage. As a protocol: Always degas samples at a temperature higher than the maximum TPD/TPR/TPO temperature before subsequent BET analysis to clear weakly adsorbed species.
Q2: XPS shows a new surface species after a TPR experiment, but FTIR does not detect it. Why? A: This is a sensitivity and "viewing depth" discrepancy. XPS is highly surface-sensitive (~5-10 nm), while transmission FTIR probes the entire particle bulk. The species is likely only on the outermost surface. Solution: Use Attenuated Total Reflectance (ATR)-FTIR, which also has surface sensitivity. Experimental protocol: For powder samples, use a high-pressure attachment for ATR-FTIR to ensure good particle-crystal contact. Compare the XPS atomic ratio (e.g., M⁰/Mⁿ⁺) with the bulk ratio from XRD Rietveld refinement to quantify surface vs. bulk reduction.
Q3: My XRD patterns remain identical across different treatment temperatures in TPD, suggesting no change. How can I validate surface sensitivity? A: XRD detects long-range order; surface amorphous layers or dispersed monolayers are invisible. You must use BET and XPS/FTIR in tandem. Protocol: 1) Run BET to see if surface area/pore volume changes, indicating structural collapse or sintering. 2) Use XPS to detect changes in surface oxidation states (e.g., O 1s lattice vs. hydroxyl components). 3) Employ FTIR with probe molecules (e.g., CO, pyridine) after TPD to titrate active surface sites. The lack of change in XRD is expected for highly dispersed or surface-specific phenomena.
Q4: How do I reconcile different activation energy values inferred from TPD kinetics vs. bulk structural changes from XRD? A: This is a core cross-validation challenge. TPD models (e.g., Redhead) assume a uniform surface, while XRD reveals bulk structure. Discrepancies arise from surface heterogeneity. Protocol: After each step in a temperature-programmed experiment, quench the sample and characterize. Correlate data in a table:
| TPD Peak Temp (°C) | Inferred Ea (kJ/mol) | XRD New Phase Detected? | XPS Major Surface Species | BET SA Change (%) |
|---|---|---|---|---|
| 350 | 95 | No | M²⁺, O²⁻ | -2 |
| 550 | 120 | Yes (MOₓ) | M³⁺, O⁻ | -15 |
Q5: After a high-temperature TPR, FTIR shows loss of hydroxyl groups, but XPS O 1s shows increased hydroxide. Is this contradictory? A: No. FTIR monitors specific vibrational modes (e.g., bridging -OH). Their loss indicates sintering. XPS O 1s integrates all oxygen species. The increase in hydroxide O 1s signal likely comes from subsurface oxygen or dissociated water upon air exposure during sample transfer. Protocol: Use an in situ cell or ultra-high-vacuum transfer from the TPR reactor to the XPS to avoid air contamination. Always note the sample transfer environment in your thesis methodology.
Experimental Protocols for Cross-Validation
Protocol 1: Pre- and Post-Temperature-Programmed Analysis Workflow
- Initial Characterization: Perform BET (adsorption isotherm), XRD (phase ID), FTIR (surface functional groups), and XPS (surface composition) on the fresh catalyst.
- TPD/TPR/TPO Experiment: Execute the optimized temperature program in the microreactor. Quench the sample to room temperature under inert atmosphere.
- Vacuum Transfer: For air-sensitive samples (post-TPR), use a dedicated vacuum transfer vessel to move the sample to XPS without air exposure.
- Post-Analysis Sequence: a) XPS first (most surface-sensitive). b) FTIR (can use ATR mode). c) BET (requires degassing). d) XRD (least surface-sensitive).
- Data Correlation: Tabulate changes against the temperature program step.
Protocol 2: FTIR with Probe Molecules for Acid/Base Site Validation
- After TPD of NH₃ or CO₂, cool the sample to 100°C under He.
- Introduce a pulse of 0.1% pyridine (for acid sites) or CO (for metal sites) in He.
- Collect FTIR spectra in transmission mode.
- Identify bands: Pyridine coordinated to Lewis sites (~1450 cm⁻¹), pyridinium ion on Brønsted sites (~1545 cm⁻¹), and hydrogen-bonded pyridine (~1490 cm⁻¹).
- Correlate band intensities with TPD peak areas to assign desorption energies to specific site types.
The Scientist's Toolkit: Key Research Reagent Solutions
| Item | Function in TPD/TPR/TPO & Cross-Validation |
|---|---|
| UHP Gases (He, Ar, 5% H₂/Ar, 5% O₂/He) | Inert carrier, reducing, and oxidizing atmospheres for temperature-programmed experiments. High purity (>99.999%) is critical for baseline stability. |
| Quartz Wool & Microreactor Tubes | Sample support in the flow reactor. Must be pre-cleaned at high temperature to avoid contaminant outgassing during analysis. |
| Vacuum Transfer Vessel | Enables movement of air-sensitive samples (e.g., after TPR) from reactor to XPS/XRD without oxidation or contamination. |
| Standard Reference Samples (e.g., Al₂O₃ for BET, Si wafer for XPS) | For calibrating instrument response and ensuring quantitative comparison across different characterization sessions. |
| Probe Molecules (Pyridine, CO, NH₃, CO₂) | Used in in situ FTIR or supplementary TPD to characterize the chemical nature (acid/base/redox) of surface active sites. |
| Conductive Carbon Tape & Inert Sample Paste | For mounting powders for XPS and SEM without inducing chemical reactions or charging artifacts. |
Workflow & Relationship Diagrams
Cross-Validation Workflow Post-Temperature Program
Troubleshooting Discrepancies Between Techniques
Troubleshooting Guides & FAQs
Q1: During TPD analysis using the Redhead method, I obtain unreasonably high pre-exponential factors (>10^19 s^-1). What is the cause and how can I resolve it? A: This often indicates a violation of the Redhead assumption of first-order kinetics and/or a constant heating rate. The model fails for complex surfaces or readsorption.
- Troubleshooting Steps:
- Verify the heating rate (β) is constant throughout the experiment. Check furnace controller calibration.
- Check for mass transport limitations or readsorption effects by varying sample mass and gas flow rate.
- Employ a more advanced method like the ATLAS numerical fitting procedure, which can account for distributed activation energies and variable kinetics.
- Protocol Adjustment: Perform a series of TPD runs with different initial coverages. If the peak temperature (Tp) shifts with coverage, the order is not first-order. Use the Polanyi-Wigner analysis with variable 'n'.
Q2: How do I choose between the Polanyi-Wigner and ATLAS methods for analyzing my TPR/TPO data? A: The choice depends on system complexity and data quality.
- Use Polanyi-Wigner (PW) Integral/Method: For well-defined, simple desorption processes where a single kinetic model (e.g., n-th order) is suspected. It is best for preliminary analysis and high-quality, single-peak data.
- Use ATLAS (Analysis of Thermal Desorption by Line Shape) or Numerical Fitting: For complex spectra with overlapping peaks, suspected energetic heterogeneity (multiple surface sites), or when readsorption is significant. It is essential for accurate extraction of distribution functions.
Q3: My TPD baseline is unstable, drifting significantly during the temperature ramp. How can I correct for this? A: Baseline drift compromises integration and kinetic parameter accuracy.
- Experimental Fix:
- Ensure thorough pre-adsorption equilibration and purging to remove weakly physisorbed species.
- Perform an in-situ blank run (identical temperature program without prior adsorption) and subtract it from the sample signal.
- Verify the stability of your thermal conductivity detector (TCD) or mass spectrometer (MS) baseline by holding at initial temperature for an extended period.
- Data Processing Fix: Apply a dynamic baseline correction (e.g., linear or polynomial fit to user-defined baseline points before and after the desorption peak) in your analysis software.
Q4: When performing numerical fitting (ATLAS method), how do I avoid non-unique or physically meaningless solutions for E and A? A: This is a common pitfall due to the correlation between activation energy (E) and pre-exponential factor (A).
- Guidelines:
- Constrain Parameters: Use physically reasonable bounds (e.g., A between 10^12 and 10^19 s^-1 for surface processes).
- Use Compensation Effect: Determine the isokinetic relationship (ln A vs. E) from multiple experiments or coverage-dependent data to define a valid correlation.
- Employ Model Discrimination: Test multiple kinetic models (e.g., different reaction orders, distributed kinetics) and use statistical criteria (like F-test or AIC) to select the best one.
- Increase Data Quality: High signal-to-noise ratio and data points across the entire peak are crucial for reliable fitting.
Q5: For TPR/TPO, how do I optimize the heating rate to clearly resolve multiple reduction/oxidation events? A: Heating rate (β) is a critical optimization parameter in the broader thesis context.
- Rule of Thumb: Slower heating rates improve resolution of overlapping peaks but decrease signal intensity and increase experiment time.
- Optimization Protocol:
- Perform initial screening with a moderate rate (e.g., 10 K/min).
- If peaks overlap, perform a second experiment with a slower rate (e.g., 5 K/min or 2 K/min).
- Use the "different heating rates" method: Perform 3-4 experiments at different β (e.g., 5, 10, 15, 20 K/min). Plot ln(β/Tp²) vs. 1/Tp for each peak (from Redhead). A linear fit validates the method and gives E from the slope. Inconsistent results indicate complex kinetics requiring PW or ATLAS.
Table 1: Comparison of Key TPD Kinetic Analysis Methods
| Method | Core Principle | Key Inputs | Outputs | Typical Application | Key Assumptions/Limitations |
|---|---|---|---|---|---|
| Redhead | Peak max position (Tp) relates to E. | Tp, Heating Rate (β), Pre-exp. Factor (A). | Activation Energy (E). | Quick estimate for 1st order desorption. | 1st order, constant A & β, no readsorption. E/A correlation. |
| Polanyi-Wigner (Integral) | Analysis of peak shape via order (n). | Desorption Rate, Coverage, Temperature. | Reaction Order (n), E, A. | Simple peaks, defined order. | Single kinetic process, no energetic heterogeneity. |
| ATLAS / Numerical Fitting | Direct fit of rate equation to full spectrum. | Full TPD spectrum, Kinetic Model. | E, A, n (or Distributions). | Complex, multi-peak spectra. | Requires good initial guesses; risk of non-unique fits. |
Table 2: Impact of Heating Rate (β) on TPD Results
| Heating Rate (β) | Peak Temperature (Tp) | Peak Height | Peak Width (Resolution) | Recommended Use Case |
|---|---|---|---|---|
| Low (e.g., 2-5 K/min) | Lower | Lower | Wider (Higher) | Resolving closely spaced overlapping peaks. |
| Medium (e.g., 10 K/min) | Moderate | Moderate | Moderate | Standard screening experiments. |
| High (e.g., 20-30 K/min) | Higher | Higher | Narrower (Lower) | Detecting weak desorption signals; fast screening. |
Experimental Protocols
Protocol 1: Basic TPD Experiment for Redhead/PW Analysis
- Sample Preparation: Load catalyst/sample (typically 10-50 mg) into U-shaped quartz microreactor. Secure with quartz wool.
- Pretreatment: Heat in inert gas (He, Ar) flow (20-30 mL/min) to 500°C (or higher, material-dependent) for 1 hour to clean surface. Cool to adsorption temperature (e.g., 50°C).
- Adsorption: Switch flow to adsorbate gas (e.g., 5% NH3/He for acid site analysis) or expose to vapor for 30-60 minutes. Ensure saturation.
- Purging: Switch back to inert gas for 30-60 minutes to remove physisorbed species and establish stable baseline.
- Temperature Programmed Desorption: Initiate linear heating ramp (e.g., 10 K/min) to final temperature (e.g., 600°C) under inert flow. Continuously monitor desorbing species via TCD or MS.
- Data Acquisition: Record signal (a.u.) vs. temperature and time.
Protocol 2: Variable Heating Rate Method for Activation Energy
- Perform Protocol 1 steps 1-4 identically for 3-4 separate runs.
- In each run, use a different, constant heating rate (β). Recommended: 5, 10, 15, 20 K/min.
- For each resulting TPD spectrum, determine the peak temperature (Tp) for the feature of interest.
- Apply the Redhead equation for each β: E = (RTp / ν) * [ln(ATp/β) - 3.64], where ν is a constant (~2-3). Use an assumed A (typically 10^13 s^-1). Alternatively, plot ln(β/Tp²) vs. 1/Tp; slope gives -E/R.
Protocol 3: Numerical Fitting (ATLAS-like) Workflow
- Obtain high-quality TPD data (Protocol 1).
- Model Selection: Postulate a rate equation (e.g., Polanyi-Wigner: r = -dθ/dt = A * θ^n * exp(-E/RT)).
- Parameter Initialization: Provide initial guesses for E, A, n based on literature or Redhead estimate.
- Numerical Integration: Use software (e.g., Python/SciPy, MATLAB, Origin) to solve the differential equation for the proposed model and parameters, generating a simulated TPD curve.
- Optimization: Employ a non-linear least squares algorithm to iteratively adjust E, A, n to minimize the difference (residuals) between the simulated and experimental curve.
- Validation: Check residuals are random. Perform statistical tests. Visually compare fit.
Visualizations
Title: TPD Data Analysis Method Decision Flowchart
Title: Standard TPD Experimental Workflow Protocol
The Scientist's Toolkit: Research Reagent Solutions
Table 3: Essential Materials for TPD/TPR/TPO Experiments
| Item | Function & Importance | Typical Specification |
|---|---|---|
| Quartz U-Tube Microreactor | Holds sample, inert at high T, minimal surface area to avoid unwanted adsorption/desorption. | Inner diameter 4-6 mm, with frit. |
| Mass Flow Controllers (MFCs) | Precisely control flow rates of reactant (e.g., H2, O2), probe (e.g., NH3, CO2), and inert (He, Ar) gases. Crucial for reproducible adsorption. | 0-50 mL/min range, calibrated. |
| Thermal Conductivity Detector (TCD) | Universal detector for desorbed gases. Measures change in gas thermal conductivity vs. reference flow. | High sensitivity, stable baseline. |
| Quadrupole Mass Spectrometer (QMS) | For selective detection of specific m/z ratios. Essential for complex gas mixtures or overlapping desorption events. | Fast scanning, good vacuum system. |
| Temperature Controller/Programmer | Executes precise linear heating ramps (β). Accuracy directly impacts kinetic parameter calculation. | PID control, programmable ramps (0.1-99 K/min). |
| High-Purity Gases & Gas Blending System | Supply adsorbates (e.g., 5% NH3/He, 10% H2/Ar) and inerts. Impurities can poison sample or create artifacts. | 99.999% purity, with filters. |
| Reference Catalyst | Used to validate TPD/TPR setup and procedure. Known properties ensure data reliability. | e.g., Certified CuO/SiO2 for TPR, zeolite for NH3-TPD. |
Benchmarking Against Reference Materials and Inter-Laboratory Comparisons
Technical Support Center
Troubleshooting Guides & FAQs
Q1: Our TPR profile shows poor resolution between two reduction peaks that are known to be separate. What could be the cause and how can we fix it?
A: This is often caused by a non-optimal heating rate or issues with sample mass/dilution.
- Cause 1: Heating rate too high. A high ramp rate can cause kinetic overlap of reduction events.
- Solution: Re-run the experiment with a slower, more linear heating rate (e.g., 5-10 °C/min instead of 15-20 °C/min). Refer to the protocol below.
- Cause 2: Sample mass too large or insufficient dilution with inert material. This can create internal temperature gradients and gas diffusion limitations.
- Solution: Reduce sample mass to 10-50 mg and ensure thorough mixing with an inert diluent like SiO₂ (1:10 sample:inert ratio).
- Cause 3: Inaccurate temperature calibration.
- Solution: Perform temperature calibration using certified reference materials (CRMs) with known magnetic transition or Curie point temperatures. See the calibration protocol.
Q2: During TPO analysis, we observe a very broad combustion peak that makes quantification difficult. How can we sharpen the peak?
A: Broad peaks typically indicate a non-uniform sample or sub-optimal gas flow.
- Cause 1: Inhomogeneous distribution of the active component on the support.
- Solution: Ensure a standardized impregnation and calcination protocol. Use a reference material with a known, sharp TPO profile to benchmark your system's performance.
- Cause 2: Incorrect O₂ concentration in the carrier gas.
- Solution: Adhere to a standard gas mixture (e.g., 5% O₂ in He). Verify the concentration using a calibrated gas analyzer. Excess O₂ can lead to uncontrolled combustion.
- Cause 3: Channeling in the sample bed.
- Solution: Use a consistent sample packing technique and consider using a quartz wool plug above and below the sample to ensure plug flow.
Q3: Our inter-laboratory comparison (ILC) for TPD-NH₃ shows significant variance in acid site density calculations. What are the key parameters to standardize?
A: Variance often stems from differences in pre-treatment, saturation, and baseline correction.
- Key Parameter 1: Pre-treatment (cleaning) temperature and duration. Must be identical to ensure a clean, reproducible starting surface.
- Solution: Implement a strict protocol: e.g., "Heat to 550 °C under 20 mL/min He flow for 1 hour."
- Key Parameter 2: NH₃ saturation procedure. Differences in concentration, flow rate, time, and temperature during adsorption will change the initial coverage.
- Solution: Use a defined saturation step: e.g., "30 min exposure to 5% NH₃/He at 100 °C, followed by 60 min He purge at the same temperature."
- Key Parameter 3: Baseline definition for integration. This is the most common source of discrepancy.
- Solution: As a group, agree on a mathematical baseline correction method (e.g., linear from start to end point, or tangent skim) and apply it uniformly. Share raw data files to align methodologies.
Experimental Protocols
Protocol 1: Temperature Calibration for TPD/TPR/TPO using Reference Materials
- Material: Select a CRM (e.g., Ni/SiO₂ for TPR, CuO for TPO, or a Curie point standard).
- Preparation: Place 20-30 mg of the CRM in the sample tube. Dilute with inert quartz wool if recommended.
- Gas Flow: Set the appropriate reactive (5% H₂/Ar for TPR, 5% O₂/He for TPO) or inert (He for TPD) gas flow to 20 mL/min.
- Program: Run the exact temperature program you wish to calibrate (e.g., 10 °C/min from 50 to 900 °C).
- Analysis: Record the temperature at the peak maximum (Tmax). Compare to the certificate value. Calculate an offset or correction factor for your thermocouple.
Protocol 2: Optimizing Heating Rate for Peak Resolution in TPR
- Prepare two identical samples of a bimetallic reference catalyst (e.g., Pt-Sn/Al₂O₃).
- Use the same gas flow (5% H₂/Ar, 20 mL/min) and sample mass (50 mg).
- Run 1: Execute a TPR with a high heating rate (20 °C/min) from 50 to 800 °C.
- Run 2: Execute a TPR with a low heating rate (5 °C/min) from 50 to 800 °C.
- Compare the full-width at half-maximum (FWHM) and the valley depth between adjacent peaks. The lower heating rate should yield sharper, better-resolved peaks.
Data Presentation
Table 1: ILC Results for Acidity Quantification via NH₃-TPD on a Zeolite Reference Material
| Laboratory | Peak Area (a.u.) | Calculated Acid Density (μmol/g) | Heating Rate (°C/min) | Pre-treatment Temp. (°C) | Reported Tmax (°C) |
|---|---|---|---|---|---|
| Lab A | 125,450 | 540 ± 15 | 10 | 500 | 345 |
| Lab B | 118,200 | 512 ± 20 | 15 | 550 | 338 |
| Lab C | 131,800 | 568 ± 10 | 10 | 500 | 347 |
| Certified Value | - | 550 ± 25 | 10 | 500 | 343 |
Table 2: Effect of Heating Rate on TPR Peak Resolution for a CuO/ZnO/Al₂O₃ Catalyst
| Heating Rate (°C/min) | H₂ Consumption Peak 1 Tmax (°C) | Peak 1 FWHM (°C) | Peak 2 Tmax (°C) | Peak 2 FWHM (°C) | Valley/Crest Ratio |
|---|---|---|---|---|---|
| 5 | 192 | 22 | 235 | 28 | 0.15 |
| 10 | 200 | 35 | 245 | 41 | 0.45 |
| 15 | 210 | 52 | 255 | 60 | 0.72 |
Visualizations
Title: Workflow for TPD Method Optimization & Benchmarking
Title: Impact of Heating Rate on TPR/TPD Profile Quality
The Scientist's Toolkit: Research Reagent Solutions
| Item | Function in TPD/TPR/TPO Benchmarking |
|---|---|
| Certified Reference Materials (CRMs) | Provide a known, stable benchmark for instrument calibration (temperature, response), method validation, and inter-laboratory comparisons. (e.g., Ni/SiO₂ for TPR, CuO for TPO). |
| High-Purity Calibration Gases | Certified mixtures (e.g., 5% H₂/Ar, 10% NH₃/He, 5% O₂/He) ensure consistent reactive atmospheres for adsorption and reaction steps. |
| Inert Diluent (Quartz Wool, SiO₂) | Used to dilute catalyst beds, preventing channeling, ensuring uniform gas flow, and mitigating temperature gradients. |
| Calibrated Mass Flow Controllers (MFCs) | Precisely control the flow rate of carrier and reactive gases, a critical parameter for reproducible kinetic profiles. |
| Thermocouple Calibrator | Validates the temperature reading at the sample location against a NIST-traceable standard, correcting for furnace offsets. |
| Standardized Sample Holders | Consistent quartz micro-reactors (U-tube, straight) with frits ensure repeatable sample packing geometry and flow dynamics. |
Troubleshooting Guides & FAQs
Q1: After integrating a TPD peak, my calculated active site density is an order of magnitude lower than expected based on the catalyst's BET surface area. What could be causing this underestimation? A: This is a common issue. Potential causes and solutions are:
- Incomplete Adsorption: The initial monolayer may not have been fully saturated. Ensure your adsorption step uses sufficient probe molecule pressure and time, and confirm adsorption temperature is appropriate.
- Peak Broadening/Overlap: Broad peaks trailing to high temperature can be mistaken for baseline. Deconvolute overlapping peaks from different site types or from support interactions using appropriate software.
- Calibration Error: Inaccurate calibration of the mass spectrometer or TCD is the most frequent source of quantitative error. Perform regular calibration using a known volume of the probe gas via a calibrated loop. Confirm the detector's response factor is linear across your concentration range.
- Incorrect Baseline Selection: An improperly drawn baseline under the peak leads to integration errors. Use a linear or polynomial baseline that connects the start and end points of the desorption event, validated by a flat pre- and post-peak signal.
Q2: In my TPR experiment, the H₂ consumption peak is very broad and asymmetric. How should I define the integration limits for accurate quantification of reducible sites? A: Broad peaks often indicate a distribution of reducible species or diffusion limitations.
- Methodology: Use the derivative of the TCD signal (d(Signal)/dt) to identify the precise start and end points where the derivative returns to and stays at baseline. Integrate the original TCD signal between these limits.
- Protocol: 1) Smooth the data minimally to reduce noise. 2) Calculate the numerical derivative. 3) Set integration limits where the absolute value of the derivative falls below a threshold (e.g., 1% of its maximum) for a sustained period. 4) Apply a linear baseline between these two points on the original consumption curve.
- Consideration: If the tail is very long, it may be due to slow bulk reduction; consult literature to determine if a specific temperature cutoff (e.g., the maximum temperature of the experiment) is standard for your material.
Q3: How do I distinguish between physisorbed and chemisorbed molecules during TPD peak integration, especially when peaks are close together? A: Differentiation is critical for accuracy.
- Experimental Protocol: Perform a "double-shot" or "dose-and-purge" experiment. 1) Adsorb the probe molecule at your chosen temperature. 2) Purge with inert gas for an extended period (30-60 mins) at the adsorption temperature. 3) Start the TPD. Physisorbed species will be largely removed during the purge, leaving primarily chemisorbed species. The integrated area from this TPD corresponds to strong chemisorption.
- Analytical Protocol: Perform a low-temperature TPD (starting at 77 K or dry ice temperature). Physisorption peaks will typically appear below 150-200 K, while chemisorption peaks appear at higher temperatures. Deconvolution software can then separate overlapping peaks.
Q4: My calibration curve for quantitative TPD is non-linear at high probe gas concentrations. How does this affect my site density calculation, and how can I correct for it? A: Non-linearity introduces significant error, as the detector response per molecule is not constant.
- Impact: It causes underestimation of larger peaks (if response saturates) or overestimation (if sensitivity increases).
- Solution: Never extrapolate beyond the calibrated range. Dilute your calibration gases to ensure all TPD peak intensities fall within the linear range of your calibration curve. For absolute quantification, fit your calibration data with a suitable function (e.g., quadratic) and use this function to convert the integrated peak area (in mV·K or A·K) to moles, but only within the calibrated data range.
Table 1: Common Probe Molecules for Active Site Determination
| Probe Molecule | Target Site (Catalyst) | Typical Desorption/Reduction Temp Range (K) | Stoichiometry (Molecule per Site) | Key Consideration |
|---|---|---|---|---|
| Ammonia (NH₃) | Brønsted Acid Site (Zeolites) | 400 - 700 | 1:1 | Can adsorb on Lewis sites; may require peak deconvolution. |
| Carbon Monoxide (CO) | Metal Sites (Pt, Pd, Cu) | 300 - 500 | 1:1 or 1:2 | Linear vs. bridged bonding affects stoichiometry. FTIR validation recommended. |
| Hydrogen (H₂) | Metal Surface Atoms (Ni, Pt) via TPR | 350 - 600 | H₂:Metals = 1:2 (surface atom) | Assumes specific dispersion. Must pre-oxidize surface. |
| Oxygen (O₂) | Oxygen Storage Capacity (CeO₂) via TPR | 500 - 800 | O₂:Ce = Variable | Non-stoichiometric; reports total reducible oxygen capacity. |
| Nitric Oxide (NO) | Multiple (Metals, Oxides) | 200 - 600 | Variable (1:1 or 2:1) | Can form various adsorbed species (NO, N₂O, NO₂). |
Table 2: Troubleshooting Quantitative Errors in TPD/TPR Integration
| Symptom | Possible Root Cause | Diagnostic Experiment | Corrective Action |
|---|---|---|---|
| Low Site Density | 1. Incomplete adsorption2. Calibration error3. Masking by support | 1. Vary adsorption pressure/time2. Run calibration check3. TPD on pure support | 1. Optimize adsorption protocol2. Recalibrate detector3. Subtract support signal |
| Non-Reproducible Integrals | 1. Unstable baseline2. Fluctuating flow rate3. Sample mass variation | 1. Monitor baseline pre-TPD2. Check MFC stability3. Precise weighing (<0.1 mg) | 1. Use in-situ baseline correction2. Service/calibrate MFCs3. Use analytical balance |
| Asymmetric Peak Tailing | 1. Readsorption effects2. Diffusion limitations3. Energetic site distribution | 1. Vary heating rate (β)2. Use smaller particle size3. Perform isothermal holds | 1. Use higher β or lower mass2. Crush and sieve sample3. Apply peak deconvolution |
Experimental Protocol: Quantitative NH₃-TPD for Zeolite Acid Site Density
Objective: To quantify the total Brønsted acid site density of a H-ZSM-5 zeolite via integration of the high-temperature ammonia desorption peak.
Materials: See "Research Reagent Solutions" below.
Method:
- Pretreatment: Load 50.0 mg of zeolite (250-500 μm sieve fraction) into a U-shaped quartz microreactor. Heat to 873 K at 10 K/min under 30 mL/min He flow. Hold for 60 minutes. Cool to 373 K under He.
- Ammonia Adsorption: Switch flow to 30 mL/min of 5% NH₃/He balance for 60 minutes at 373 K.
- Physisorption Removal: Switch back to pure He (30 mL/min) at 373 K. Purge for 90 minutes to remove all physisorbed NH₃. Stabilize the baseline.
- TPD Run: Initiate temperature program: Heat from 373 K to 873 K at a heating rate (β) of 10 K/min under 30 mL/min He flow. Monitor desorbed NH₃ via a calibrated mass spectrometer (m/z=16 or 17) or TCD.
- Calibration: After the TPD, inject 5 repeated pulses of a known volume (e.g., 100 μL) of 5% NH₃/He via a calibrated loop into the He stream. Record the peak areas to establish the average detector response factor (Area per μmol of NH₃).
- Quantification: Draw a linear baseline from the start (~373 K) to the end (~873 K) of the desorption peak. Integrate the area above baseline. Apply the detector response factor to calculate total NH₃ desorbed (μmol). Active Site Density (μmol/g) = (Total NH₃ desorbed) / (Mass of sample in g).
Visualizations
Title: Quantitative TPD/TPR Workflow for Site Density
Title: Troubleshooting Logic for Site Density Errors
The Scientist's Toolkit: Research Reagent Solutions
Table 3: Essential Materials for Quantitative TPD/TPR Experiments
| Item | Function | Critical Specification/Note |
|---|---|---|
| U-Shaped Quartz Microreactor | Holds catalyst sample during pretreatment and analysis. | High-purity quartz, low dead volume. Must be cleaned between runs. |
| High-Purity Calibration Gases | For detector calibration and probe molecule adsorption. | Certified standard mixes (e.g., 5.0% CO/He, 5.0% NH₃/He). Traceable to NIST. |
| Mass Flow Controllers (MFCs) | Precisely control gas flow rates for reproducibility. | Calibrated for specific gases. Require regular re-calibration. |
| Six-Port Valves with Sample Loops | For injecting precise volumes of gas for calibration. | Loops must be precisely sized (e.g., 100 μL, 500 μL) and kept at constant T. |
| Sieve Mesh Sets | To prepare catalyst particles of uniform size. | Use 250-500 μm (60-40 mesh) to minimize pressure drop and diffusion effects. |
| Reference Catalyst (e.g., Pt/Al₂O₃) | A well-characterized material to validate the entire TPD/TPR protocol. | Certified for metal dispersion or active site density. |
| Thermocouple (K-Type) | Accurately measures sample bed temperature. | Must be in direct contact with the catalyst bed, not the reactor wall. |
| Data Acquisition & Analysis Software | For recording signals, controlling temperature, and integrating peaks. | Must allow for flexible baseline drawing and peak deconvolution (e.g., Gaussian, asymmetric functions). |
Technical Support Center
Troubleshooting Guides & FAQs
Q1: During a TPR experiment on our Micromeritics AutoChem II, the measured hydrogen consumption shows erratic, non-reproducible peaks. What could be the cause? A: This is often a gas supply or moisture issue. First, verify the integrity of your reducing gas (e.g., 10% H2/Ar) supply. Ensure the moisture trap is fresh and properly installed. A saturated trap releases water vapor, causing baseline instability. Check all gas lines for micro-leaks using a bubble test solution. Calibrate the TCD detector with a standard reference material. Ensure your sample mass is appropriate (<100 mg) to avoid mass/heat transfer limitations that can broaden or split peaks.
Q2: On a Quantachrome ChemBET TPR/TPD, we observe a consistent negative drift in the baseline during the temperature ramp. How can we resolve this? A: A negative baseline drift typically indicates a thermal conductivity imbalance between the sample and reference sides of the TCD. Ensure the reference cell is clean and packed with an inert material (e.g., quartz wool) matching the sample side volume. Confirm the gas flow rates for both analyte and reference streams are perfectly balanced and stable (±0.1 sccm). Allow the instrument to thermally equilibrate for at least 2 hours before starting the analysis. This is critical for high-sensitivity work in TPD/TPR/TPO optimization studies.
Q3: Our bespoke TPD setup uses a mass spectrometer (MS) as the detector. The signal is very noisy, obscuring small desorption peaks. What steps should we take? A: MS noise in bespoke systems is frequently related to vacuum integrity or electrical grounding. Check the vacuum pressure in the MS chamber; it should be in the 10^-7 to 10^-8 Torr range for optimal signal-to-noise. Ensure all electrical connections, especially the MS signal cable, are properly shielded and grounded to a common earth point to eliminate 50/60 Hz interference. Increase your sampling time constant on the MS or data acquisition system to average the signal slightly. Verify that the capillary inlet to the MS is heated to prevent condensation of desorbing species.
Q4: When switching between TPO and TPR experiments on a shared commercial system, we sometimes get contamination peaks. What is the proper protocol? A: Cross-contamination is a serious concern. Implement a rigorous between-experiment cleaning protocol: 1) After each experiment, run a high-temperature (e.g., 850°C) bakeout under flowing inert gas (He, Ar) for 1-2 hours to clean the sample tube and reactor. 2) Replace or clean (via calcination) the quartz wool used to hold the sample. 3) For Quantachrome or Micromeritics systems, utilize the automated "conditioning" or "calcination" station if available. 4) Always run a blank TPD (heating an empty tube under inert gas) and check the baseline before loading a new sample. Document these steps as part of your optimized temperature program.
Q5: For a bespoke system, how do we accurately calibrate the temperature readout for the sample thermocouple? A: Do not rely on the thermocouple reading alone. Perform a direct temperature calibration using materials with known Curie points (e.g., Ni, Co, Fe) or melting points (e.g., In, Sn). Place the calibration material in the exact sample position. Run a temperature ramp and observe the magnetic or phase transition as a sharp deviation in the TCD signal or another sensitive probe. Compare the observed transition temperature to the known value to create a calibration curve. This is essential for reproducible temperature programming across different setups.
Table 1: Key Specifications and Performance Metrics
| Feature/Aspect | Micromeritics (AutoChem II/III) | Quantachrome (ChemBET Pulsar) | Typical Bespoke Setup |
|---|---|---|---|
| Max Temp Range | Ambient to 1100°C | Ambient to 1000°C (up to 1200°C option) | User-defined (furnace dependent) |
| Standard Detector | Thermal Conductivity (TCD) | Thermal Conductivity (TCD) | Mass Spectrometer (MS) or TCD |
| Gas Delivery | Multi-port MFC, fully automated | Multi-port MFC, automated | Manual or automated MFCs/Needle valves |
| Sample Throughput | High (Auto-sampler optional) | Medium (Single or dual reactor) | Low (Single reactor) |
| Baseline Stability (TCD) | ±0.5 µV over 30 min at isothermal | ±1.0 µV over 30 min at isothermal | Varies widely (±2-10 µV typical) |
| Software Integration | Proprietary, with advanced scripting | Proprietary, with method programming | LabVIEW, Python, or commercial DAQ |
| Typical Cost | High ($150k - $250k) | Medium-High ($80k - $180k) | Low-Medium ($30k - $100k+) |
| Optimization Flexibility | High within software constraints | Moderate within software constraints | Very High (complete user control) |
Table 2: Common Issues and System-Specific Solutions
| Issue | Micromeritics | Quantachrome | Bespoke |
|---|---|---|---|
| Unstable Baseline | Check 'Analyze' valve seals, recalibrate MFCs. | Rebalance TCD bridge, purify carrier gas. | Reground all instruments, check MS filament. |
| Poor Peak Resolution | Reduce heating rate, decrease sample mass. | Verify reactor geometry, check gas mixing. | Improve sample bed geometry, pre-mix gases. |
| Temperature Inaccuracy | Validate via Ni Curie point standard (354°C). | Use included Fe Curie point (770°C) test. | Perform full Curie point calibration series. |
Experimental Protocols
Protocol 1: Calibrating the TCD Response for Quantitative TPR/TPO
- Objective: To convert the integrated TCD signal (in µV·s) to moles of gas consumed or produced.
- Materials: Calibration loop (e.g., 1.00 mL volume), high-purity calibration gas (e.g., 10.0% H2 in Ar for TPR, 5.0% O2 in He for TPO), inert carrier gas.
- Procedure: a. Install a clean, empty U-shaped quartz sample tube. b. Set the carrier gas flow to the standard rate used in experiments (e.g., 30 sccm). c. Allow the baseline to stabilize at a low temperature (e.g., 50°C). d. At time t, inject a known volume of calibration gas into the carrier stream using the automated loop or a manual injection valve. e. Record the resulting positive or negative peak from the TCD. f. Integrate the peak area (Acal) in µV·s. g. Calculate the calibration constant: K = (P * Vcal) / (R * T * Acal), where P=ambient pressure (atm), Vcal=loop volume (L), R=gas constant (0.0821 L·atm/mol·K), T=ambient temperature (K).
- Application: For an unknown sample peak with area Asample, moles of gas = K * Asample.
Protocol 2: Optimizing a TPD Temperature Program for Acid Site Characterization
- Objective: To distinguish between weak, medium, and strong acid sites via NH3-TPD.
- Sample Preparation: Pre-treat catalyst (e.g., zeolite) at 500°C in He for 1 hour. Adsorb NH3 at 100°C until saturation, then purge with He at the same temperature to remove physisorbed NH3.
- Temperature Program Optimization: a. Ramp 1: 100°C to 300°C at 10°C/min. Hold for 30 min. This typically desorbs NH3 from weak acid sites. b. Ramp 2: 300°C to 500°C at 5°C/min. Hold for 45 min. This typically desorbs NH3 from medium and strong acid sites. c. A slower ramp in the second stage improves resolution between medium and strong site desorption peaks.
- Data Analysis: Deconvolute the TPD profile using appropriate software (e.g., Origin, Kinetics) assuming Gaussian or asymmetric peaks for each site type. The integrated area under each deconvoluted peak is proportional to the site density.
The Scientist's Toolkit: Research Reagent Solutions
| Item | Function in TPD/TPR/TPO |
|---|---|
| High-Purity Gases (He, Ar, 10% H2/Ar, 5% O2/He, NH3, CO2) | Inert carriers, reactive gases for reduction/oxidation, probe molecules for adsorption. Purity (>99.999%) is critical for clean baselines. |
| Quartz Wool & Sample Tubes (U-shaped or Straight) | To hold the powder sample in the reactor zone, allowing even gas flow and temperature distribution. Must be inert and cleaned by calcination regularly. |
| Reference Materials (Ni, Fe, Co Curie Points, In, Sn Melting Points) | For precise in-situ calibration of the sample temperature reading, essential for comparing data across different instruments. |
| Moisture/Oxygen Traps | Placed in gas lines to remove trace impurities from gas cylinders that can poison catalysts or cause baseline drift. |
| Certified Calibration Gas Mixtures | For quantitative calibration of TCD or MS response, enabling the conversion of signal area to moles of gas adsorbed/desorbed. |
| Thermocouples (Type K, Chromel-Alumel) | Placed in direct contact with the sample bed to provide the most accurate temperature measurement for feedback control. |
Visualizations
Title: General Workflow for TPD/TPR/TPO Analysis
Title: System Trade-offs: Reproducibility vs. Flexibility
Conclusion
Mastering temperature program optimization is fundamental to unlocking the full potential of TPD, TPR, and TPO analyses. A methodical approach—grounded in foundational principles, refined through robust methodology, honed by systematic troubleshooting, and validated against complementary techniques—transforms raw thermal profiles into reliable, quantitative insights into surface chemistry and catalytic function. Future directions point toward greater integration with in-situ and operando characterization, automated high-throughput experimentation, and advanced computational kinetics for predictive modeling. For researchers in drug development (e.g., catalyst-dependent synthesis) and biomedical engineering (e.g., biomaterial surface characterization), these optimized protocols ensure data reproducibility and relevance, directly impacting the development of more efficient, selective, and sustainable chemical processes and materials.