Physisorption and Chemisorption Measurement Methods: A Guide for Material and Pharmaceutical Scientists
This article provides a comprehensive guide to the measurement methods for physisorption and chemisorption, tailored for researchers and professionals in drug development and material science.
Physisorption and Chemisorption Measurement Methods: A Guide for Material and Pharmaceutical Scientists
Abstract
This article provides a comprehensive guide to the measurement methods for physisorption and chemisorption, tailored for researchers and professionals in drug development and material science. It covers the foundational principles distinguishing these adsorption processes, details core analytical techniques like BET and temperature-programmed methods, and offers practical insights for troubleshooting and optimizing experiments. A comparative framework is also provided to validate data and select the most appropriate method for specific applications, from catalyst development to pharmaceutical characterization.
Physisorption vs. Chemisorption: Understanding Core Principles and Energetics
Molecular adsorption on solid surfaces is a fundamental process in surface science, underpinning numerous applications in heterogeneous catalysis, gas storage, sensor technology, and drug development [1] [2]. This process occurs through two primary mechanisms: physisorption (physical adsorption), dominated by van der Waals forces, and chemisorption (chemical adsorption), characterized by the formation of chemical bonds [1] [3]. Accurately distinguishing between these processes is crucial for designing materials with tailored surface properties, as the mechanism directly influences the strength, stability, and reversibility of the adsorbate-substrate interaction [1]. For researchers and scientists, selecting the appropriate measurement technique is paramount for correctly interpreting adsorption data and optimizing processes, from catalyst design to pharmaceutical development. This application note provides a structured comparison of these adsorption processes and details the experimental protocols for their characterization.
Fundamental Principles and Comparative Analysis
Physisorption: Van der Waals Interactions
Physisorption results from weak, long-range van der Waals forces between the adsorbate molecule and the substrate surface [3]. These forces originate from interactions between induced, permanent, or transient electric dipoles, and the electronic structure of the adsorbate is barely perturbed upon adsorption [3]. The interaction energy is typically very weak, on the order of 10–100 meV (approximately 1–10 kJ/mol) [3]. A key characteristic of physisorption is that it is non-specific and can occur on any surface, provided the temperature and pressure conditions are favorable [1]. It is also reversible, and the adsorbed molecules can be easily removed by evacuation at the adsorption temperature or by mild heating [1]. Furthermore, because it does not require direct contact with specific surface sites, physisorption can proceed to form multiple layers of adsorbate [1].
Chemisorption: Chemical Bond Formation
Chemisorption involves the formation of a chemical bond between the adsorbate and specific locations on the material's surface, known as active sites [1] [4]. This process often involves significant sharing of electrons between the adsorbate and the surface, which alters the electronic structure of both and can dissociate the adsorbate [5] [1]. The binding energies are much stronger, typically in the range of 1-10 eV (approximately 100–1000 kJ/mol) [5]. Unlike physisorption, chemisorption is specific to certain adsorbent-adsorptive pairs and only occurs on clean active sites [1] [4]. It is also largely irreversible under mild conditions; removing chemically adsorbed molecules requires a substantial influx of energy, often involving very high temperatures [1]. Finally, because it requires direct contact with an active site, chemisorption is inherently a single-layer process [1].
Table 1: Fundamental Characteristics of Physisorption and Chemisorption
| Characteristic | Physisorption | Chemisorption |
|---|---|---|
| Interaction Force | Van der Waals forces [3] | Chemical bonding (covalent/ionic) [1] |
| Binding Energy | Weak (~10–100 meV) [3] | Strong (~1–10 eV) [5] |
| Reversibility | Easily reversible [1] | Largely irreversible [1] |
| Specificity | Non-specific [1] | Highly specific [1] |
| Process Nature | Multi-layer possible [1] | Single-layer only [1] |
| Temperature Dependence | Occurs at low temperatures [1] | Can occur at high temperatures [1] |
Interplay and Intermediate Mechanisms
In practical systems, the distinction between physisorption and chemisorption is not always absolute. Intermediate mechanisms can exist, such as Kubas interactions, which are often observed in hydrogen storage research. These interactions involve side-on coordination of H2 molecules to transition metal centers, featuring both donation of σ-electron density from H2 to the metal and back-donation of electron density from the metal d-orbitals to the σ*-antibonding orbital of H2 [5]. This results in adsorption energies that bridge the gap between pure physisorption and chemisorption (e.g., -0.42 to -0.53 eV/H2), enabling reversible hydrogen storage at near-ambient conditions [5]. Furthermore, the adsorption mechanism can change with temperature. For instance, on Sc-decorated BeN4, hydrogen molecules can be adsorbed reversibly via Kubas interactions at room temperature, but they dissociate into isolated H-atoms bound by pure chemisorption at elevated temperatures (500 K), leading to irreversible storage [5].
Table 2: Experimental Data from Selected Adsorption Systems
| Material System | Adsorbate | Interaction Type | Adsorption Energy | Gravimetric Capacity | Citation |
|---|---|---|---|---|---|
| Pristine BeN4 | H₂ | Physisorption | -0.12 eV/H₂ | ~1.3 wt% (at 100 K) | [5] |
| Sc-decorated BeN4 | H₂ | Kubas Interaction | -0.42 to -0.53 eV/H₂ | 7.86 wt% (at 300 K) | [5] |
| Sc-decorated BeN4 (500 K) | H (atoms) | Chemisorption | N/A | 6.0 wt% (at 400 K) | [5] |
| Silica-coated LSPR Sensor | Human Serum Albumin | Physisorption (Electrostatic) | N/A | N/A | [6] |
Experimental Protocols for Differentiation
A range of analytical techniques is available to characterize adsorption processes, each providing insights into the quantity adsorbed, binding strength, and nature of the surface interaction.
Volumetric (Static) Chemisorption/Physisorption Analysis
The volumetric method is a powerful technique for obtaining high-resolution adsorption isotherms, which are plots of the quantity of gas adsorbed versus pressure at a constant temperature [1] [7].
Protocol:
- Sample Preparation: The solid sample is placed in a known volume and subjected to in-situ pretreatment (e.g., degassing, heating, or reduction) under vacuum to clean the surface of any contaminants [7].
- First Isotherm Measurement: A precise amount of analys gas (e.g., H2, CO, N2) is dosed sequentially into the sample cell. After each dose, the system is allowed to reach equilibrium, and the pressure is measured. The quantity adsorbed is calculated from the pressure drop using the known system volume [7]. This first isotherm represents the sum of both chemisorption and physisorption [7].
- Evacuation: The sample is evacuated to remove the loosely bound, physisorbed molecules. The strongly bound, chemisorbed molecules remain on the surface, blocking the active sites [7].
- Second Isotherm Measurement: The adsorption isotherm is measured again on the now partially saturated sample. This second isotherm represents only the physisorption component [7].
- Data Analysis: The pure chemisorption isotherm is obtained by subtracting the second isotherm (physisorption) from the first isotherm (total adsorption). From this, the active surface area, metal dispersion, and energy distribution of sites can be derived [7].
Temperature-Programmed Desorption (TPD)
TPD is a dynamic technique used to probe the strength, number, and heterogeneity of chemisorption sites by monitoring desorption as a function of temperature [1] [7].
Protocol:
- Adsorption and Saturation: The pretreated sample is exposed to the probe gas (e.g., NH3 for acid sites, H2 for metal sites) until the active sites are saturated [1] [7].
- Purging: An inert gas (e.g., He, Ar) is flowed over the sample to flush out any remaining physisorbed molecules from the gas phase [1] [7].
- Controlled Heating: The sample temperature is increased linearly at a controlled rate (e.g., 10 °C/min) under a continuous flow of inert gas [1].
- Detection: A Thermal Conductivity Detector (TCD) monitors the gas stream. As the temperature overcomes the binding energy of the adsorbed molecules, they desorb, causing a change in the thermal conductivity of the gas stream, which is recorded as a peak [1] [7].
- Data Analysis: The temperature of the desorption peak(s) indicates the strength of the binding sites (higher temperature = stronger binding). The area under the peak is proportional to the number of sites of that strength [1]. Activation energies for desorption can be calculated from the peak shapes and positions [1].
Complementary Techniques
Other essential techniques for studying adsorption include:
- Pulse Chemisorption: A dynamic method where small, repeated pulses of probe gas are injected into an inert carrier gas flowing over the sample. A TCD detects the amount of gas adsorbed until saturation is reached. This is a rapid technique for determining active metal surface area and dispersion, primarily probing the strongest active sites [1] [4].
- Computational Methods (DFT): Density Functional Theory simulations, especially those corrected for van der Waals interactions (DFT-D2, DFT-D3, rVV10), are used to investigate interaction mechanisms at the atomic level. They can calculate adsorption energies, electronic structure changes, and identify the nature of the bond, helping to interpret experimental data [5] [2].
- Gas Chromatography (GC): Used for quantitative analysis of adsorbed species, particularly in applications like VOC capture. The adsorbent is exposed to a vapor, and the amount adsorbed/desorbed is quantified by GC, allowing for the study of reversibility and capacity [8].
The Scientist's Toolkit: Essential Research Reagents and Materials
The following table lists key materials and reagents commonly used in adsorption experiments.
Table 3: Key Research Reagents and Materials for Adsorption Studies
| Item | Function/Application | Examples & Notes |
|---|---|---|
| Probe Gases | Used to titrate and characterize specific active sites on a material. | H₂: For metal surface area and dispersion [7] [4]. CO: For titrating surface metal atoms [4]. O₂: For oxidative sites and metal dispersion [4]. NH₃: For quantifying acid site strength and concentration [7]. |
| Inert Carrier Gases | Used to create an inert atmosphere and carry probe gases in dynamic methods. | He, Ar, N₂: Must be high-purity to avoid contaminating the sample surface [7]. |
| Supported Catalysts | Common materials for studying chemisorption in heterogeneous catalysis. | e.g., Pt/Al₂O₃, Pd/SiO₂. The support provides a high surface area for dispersing the active metal [1]. |
| Porous Materials | Used for physisorption studies and gas storage; their high surface area is ideal for measuring BET surface area and pore size distribution. | Zeolites: For VOC adsorption and acid-site studies [8]. Metal-Organic Frameworks (MOFs): For high-capacity gas storage [5]. |
| 2D Nanomaterials | Model systems and advanced materials for studying both physisorption and metal-functionalized chemisorption. | Graphene, BeN₄: Pristine versions study physisorption; metal-decorated (e.g., Sc, Li) versions study enhanced and Kubas-type adsorption for hydrogen storage [5]. |
| Dielectric-Coated Sensor Chips | Used in label-free biosensing (e.g., LSPR) to study protein adsorption and conformational changes on different surfaces. | SiO₂-, TiO₂-coated chips: Allow for the study of biointerfacial interactions under varying physiological conditions [6]. |
The clear distinction between physisorption and chemisorption, grounded in the fundamental forces involved—van der Waals versus chemical bonds—is critical for advancing research in catalysis, materials science, and drug development. The choice of characterization technique, whether volumetric analysis for precise isotherm measurement, TPD for site strength distribution, or pulse chemisorption for rapid dispersion analysis, must align with the specific adsorption mechanism under investigation. By applying the protocols and utilizing the tools outlined in this note, researchers can accurately deconvolute these complex surface processes, enabling the rational design of next-generation adsorbents and catalytic materials.
The accumulation of molecular species on a solid surface, a process known as adsorption, is a fundamental phenomenon in heterogeneous catalysis, gas separation, and drug development. Adsorption processes are primarily categorized into physisorption (physical adsorption) and chemisorption (chemical adsorption), which are critically distinguished by three key factors: the enthalpy of adsorption, the reversibility of the process, and the specificity for particular surface sites. Understanding these differentiating factors is essential for selecting appropriate characterization methods, designing efficient catalytic systems, and developing targeted drug delivery mechanisms. Physisorption occurs when adsorbate molecules are held to the adsorbent surface by weak van der Waals forces, resulting in low adsorption enthalpy and non-specific, reversible binding. In contrast, chemisorption involves the formation of chemical bonds between the adsorbate and specific active sites on the adsorbent surface, characterized by significantly higher adsorption enthalpy and typically irreversible behavior under standard conditions. This application note details the core differentiating factors between these adsorption processes and provides standardized protocols for their experimental characterization.
Core Differentiating Factors
The fundamental differences between physisorption and chemisorption are quantitatively defined by their enthalpy changes, reversibility characteristics, and specificity. The table below provides a systematic comparison of these key parameters.
Table 1: Key Differentiating Factors Between Physisorption and Chemisorption
| Factor | Physisorption | Chemisorption |
|---|---|---|
| Enthalpy of Adsorption | Low (20-40 kJ/mol) [9] | High (80-240 kJ/mol) [9] |
| Nature of Interaction | Van der Waals forces [9] | Chemical bonds [9] |
| Reversibility | Reversible [9] | Irreversible [9] |
| Specificity | Non-specific [9] | Highly specific [9] |
| Temperature Dependence | Favors low temperature, decreases with increasing temperature [9] | Favors high temperature, increases with increasing temperature [9] |
| Layer Formation | Multimolecular layers [9] | Unimolecular layer [9] |
| Activation Energy | Low [9] | High [9] |
Enthalpy of Adsorption
The enthalpy of adsorption (ΔHad) is a fundamental thermodynamic quantity that directly reflects the strength of the interaction between the adsorbate and the adsorbent.
- Theoretical Basis: Enthalpy of adsorption represents the heat released when an adsorbate molecule attaches to the surface. The magnitude of this enthalpy change directly correlates with the type of forces involved: weak van der Waals interactions for physisorption versus strong chemical bond formation for chemisorption [9].
Experimental Determination: The most common method for determining adsorption enthalpy is through the calculation of the isosteric enthalpy of adsorption. This is typically determined from adsorption isotherms measured at two or more closely spaced temperatures using the van't Hoff relation (Clausius-Clapeyron equation) [10]:
lnP = ΔH/RT − ΔS/Rwhere P is pressure, ΔH is the enthalpy change, ΔS is the entropy change, R is the universal gas constant, and T is the temperature. A plot of lnP against 1/T for a particular uptake gives a straight line with a gradient of ΔH/R [10].
Reversibility
Reversibility refers to the ability to remove adsorbates from the surface under modified conditions, restoring the original adsorbent.
- Physisorption: The weak van der Waals forces allow for easy reversal, often simply by reducing pressure or mildly increasing temperature. This makes physisorption suitable for applications like gas storage and pressure swing adsorption [9].
- Chemisorption: The formation of chemical bonds renders the process largely irreversible under the same conditions. Removing chemisorbed species typically requires significant energy input, such as high temperatures or reactive environments, which can potentially alter the adsorbent surface [9].
Specificity
Specificity describes the selective nature of the interaction between the adsorbate and particular sites on the adsorbent surface.
- Physisorption: This process is non-specific because van der Waals forces are universal and operate on any surface. The amount adsorbed primarily depends on the surface area and porosity of the adsorbent rather than its chemical nature [9].
- Chemisorption: This exhibits high specificity as it requires chemical bonding that is specific to certain surface sites and adsorbates. For example, hydrogen may chemisorb on a ferrous catalyst but not on other materials, and even on a single catalyst, different crystalline faces may exhibit varying chemisorption capacities [9].
Experimental Protocols and Methodologies
Determining Isosteric Enthalpy of Adsorption
This protocol outlines the procedure for determining the isosteric enthalpy of adsorption using volumetric methods.
Table 2: Research Reagent Solutions for Adsorption Experiments
| Item | Function | Application Notes |
|---|---|---|
| High-Purity Adsorbate Gases | Provide the molecular species for adsorption studies | Use research grade (e.g., 99.999% purity) to avoid contamination of surface sites. |
| Reference Cell | Precisely measures known gas volumes | Maintain at constant temperature to ensure volume accuracy. |
| High-Vacuum System | Achieves and maintains ultralow pressure | Essential for degassing and preparing clean surfaces prior to analysis. |
| Temperature-Controlled Bath | Maintains constant isothermal conditions | Liquid N₂ (77 K) and Ar (87 K) are commonly used for temperature control [10]. |
| Pressure Transducers | Accurately measure pressure changes | Calibrate for the specific pressure range of the experiment. |
Procedure:
- Sample Preparation: Degas the adsorbent sample under high vacuum at elevated temperature (specific to material) for several hours to remove all pre-adsorbed species.
- Isotherm Measurement: Introduce precise doses of the adsorbate gas into the system containing the sample. For each dose, allow the system to reach equilibrium and record the equilibrium pressure.
- Perform this measurement to construct a complete adsorption isotherm (uptake vs. pressure) at a constant temperature, T₁ [10].
- Repeat at Different Temperatures: Repeat Step 2 at two or more different, closely spaced temperatures (T₂, T₃...), ensuring all other conditions remain constant [10].
- Data Analysis:
- For a fixed amount of gas adsorbed (uptake, n), determine the equilibrium pressures (P₁, P₂, P₃...) from the different isotherms.
- For each uptake value, plot lnP against 1/T.
- The isosteric enthalpy of adsorption (ΔH) is calculated from the slope of this plot (slope = ΔH/R) [10].
Differentiating Physisorption and Chemisorption via TPD
Temperature-Programmed Desorption (TPD) is a powerful technique to assess reversibility and binding strength.
Procedure:
- Adsorption Phase: Expose the clean adsorbent surface to the adsorbate gas at a specific temperature and pressure until saturation is reached.
- Purging: Remove the gas phase and flush the system with an inert gas (e.g., He, Ar) to remove any physisorbed species.
- Desorption Phase: Linearly increase the temperature of the sample at a constant rate (e.g., 10-30 K/min) while monitoring the desorbing species with a mass spectrometer.
- Data Interpretation:
- Low-Temperature Peaks (typically below 100-150 K): Correspond to the desorption of physisorbed molecules, indicating reversible adsorption with low enthalpy.
- High-Temperature Peaks (typically above 300 K): Correspond to the desorption of chemisorbed molecules, indicating strong, often irreversible binding with high enthalpy. The temperature of the peak maximum is directly related to the strength of the adsorption bond.
Advanced Considerations and Theoretical Framework
Multiscale Modeling of Adsorption
Under industrially relevant conditions (high temperature and pressure), the local densities of gas molecules near the catalyst surface can be hundreds of times their bulk values. A multiscale modeling approach that integrates Kohn-Sham density functional theory (KS-DFT) for predicting surface bonding energy with classical DFT (cDFT) to evaluate gas distribution provides a more comprehensive framework [11]. This method accounts for both bond formation (chemisorption) and non-bonded interactions (physisorption) of gas molecules with the catalyst surface, revealing that surface composition is determined by the accessibility of surface sites and their interactions with the surrounding gas phase [11]. The adsorption grand potential (Ωad) in this framework is given by:
Ωad = Gad + ΩcDFT-ad
where Gad is the adsorption free energy from KS-DFT, and ΩcDFT-ad is the penalty grand potential from cDFT, representing the free energy change due to the displacement of gas-phase species during chemisorption [11].
The Role of Rigidity in Thermodynamics
Recent research highlights that classical thermodynamics has historically omitted the role of rigidity, which is a key property distinguishing solids from fluids. The elastic behavior of a solid represents a significant energy reservoir. A theoretical framework links the energy density of sublimation (ρΔHsub/M) to Young's elastic modulus (ϒ), demonstrating that the elastic energy reservoir of solids is large and foundational to understanding their energetics [12]. This perspective is crucial when considering processes like sublimation where rigidity is fully lost.
Workflow and Logical Relationships
The following diagram illustrates the logical decision process for characterizing an unknown adsorption mechanism based on the key differentiating factors.
Diagram 1: Adsorption Characterization Workflow
Application in Research and Development
The strategic selection of adsorption processes is critical across numerous scientific and industrial domains. In catalyst development, chemisorption is used to quantify active metal surface area, metal dispersion, and the number of active sites, which are critical parameters for optimizing catalytic performance [13]. In drug development, understanding physisorption is vital for designing drug delivery systems where controlled release is desired, while chemisorption principles guide the development of targeted therapies where specific molecular binding is required. For gas storage and separation applications (e.g., H₂, CH₄, CO₂), materials with high surface areas that operate via reversible physisorption are typically preferred due to their lower energy requirements for adsorbent regeneration [10]. The continued refinement of measurement protocols and theoretical models, including multiscale modeling approaches, ensures that researchers can accurately characterize and tailor adsorption properties for advanced applications [11].
In surface science, the interaction between gas or liquid molecules and a solid surface is governed by adsorption processes. The fundamental distinction lies between physisorption (physical adsorption) and chemisorption (chemical adsorption), which differ in the nature of the bonding forces, the number of layers formed, and their overall energetics [14]. Physisorption involves weak van der Waals forces, is reversible, and can lead to multilayer formation. In contrast, chemisorption involves the formation of strong chemical bonds, is often irreversible, and is limited to a monolayer because the chemical bonds saturate the surface active sites [15] [4]. Accurately distinguishing between these mechanisms is critical for researchers and drug development professionals in designing and optimizing processes in catalysis, environmental remediation, and pharmaceutical product development [16] [17]. This application note details the core principles, experimental protocols, and data interpretation methods for characterizing these distinct adsorption behaviors.
Theoretical Background and Key Differences
The primary distinction between these processes lies in the type of adsorbent-adsorbate interaction. Physisorption is characterized by weak, non-specific van der Waals forces, with low adsorption enthalpies typically in the range of 5–50 kJ/mol [14]. As these forces are operative even after the first layer is formed, physisorption can proceed to form multiple layers on the surface. Conversely, chemisorption involves the formation of strong, covalent or ionic chemical bonds, with higher enthalpy changes, often exceeding 50-100 kJ/mol [15]. This process is highly specific to the chemical nature of the adsorbent and adsorbate, occurring only on specific "active sites" and ceasing once a single layer of molecules has formed a chemical bond with these sites [4].
The following table summarizes the characteristic differences between the two processes.
Table 1: Characteristic Differences Between Physisorption and Chemisorption
| Feature | Physisorption | Chemisorption |
|---|---|---|
| Binding Force | Weak van der Waals forces [14] | Strong chemical bonds (covalent/ionic) [15] |
| Enthalpy (ΔH) | Low (5–50 kJ/mol) | High (50–100+ kJ/mol) [15] |
| Reversibility | Reversible [14] | Often irreversible [15] |
| Layer Formation | Multilayer possible [18] | Monolayer only [4] |
| Specificity | Non-specific | Highly specific to surface sites [4] |
| Temperature Dependence | Occurs at lower temperatures | Often requires higher temperatures [15] |
| IUPAC Isotherm Types | II, III, IV, V, VI [18] | I (Langmuir-type) [18] |
Visualizing the Adsorption Mechanisms
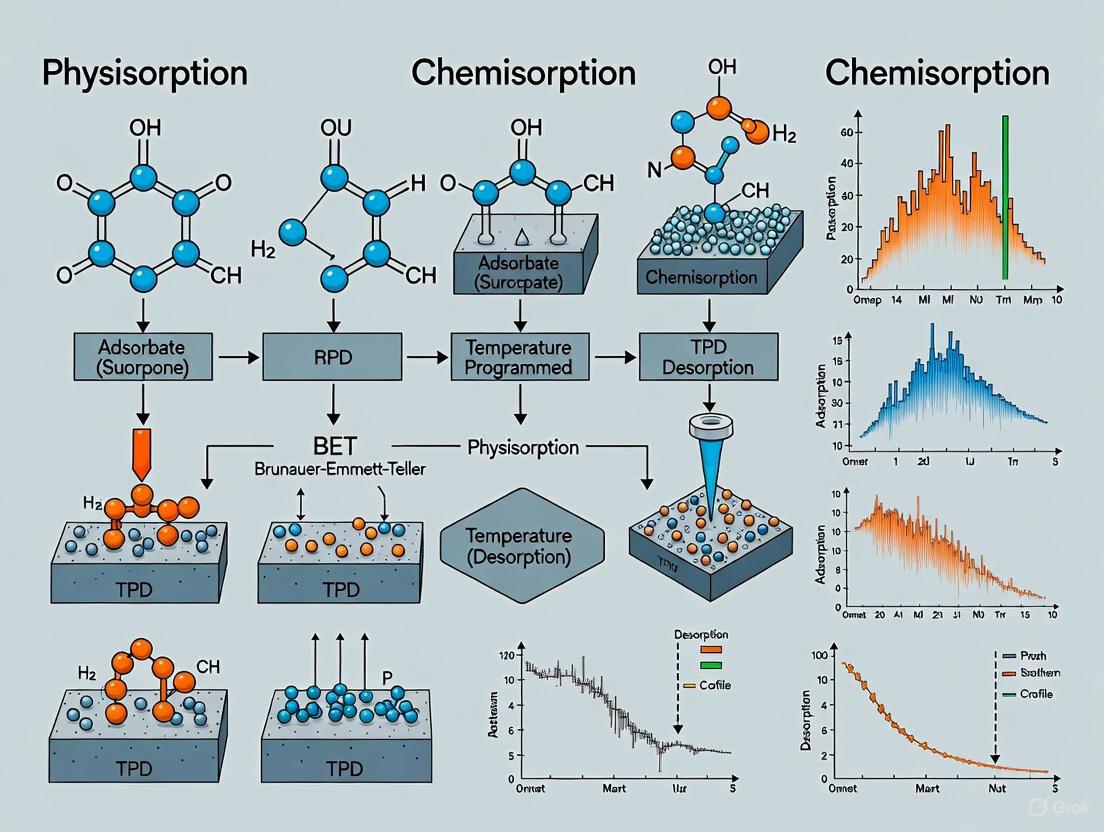
The following diagram illustrates the fundamental differences in layer formation and the nature of interactions at the surface in each process.
Diagram 1: A comparison of multilayer physisorption, where weak van der Waals forces allow for multiple layers to form, and monolayer chemisorption, where strong chemical bonds form exclusively at specific active sites on the surface.
Experimental Protocols for Adsorption Measurement
Distinguishing between physisorption and chemisorption requires a combination of techniques that probe the quantity adsorbed, the strength of adsorption, and the energetic changes involved.
Protocol for Gas Sorption Analysis
This protocol outlines the general steps for characterizing porous materials using gas sorption analyzers, such as the Micromeritics 3Flex or ASAP 2020 Plus [14] [15].
Objective: To determine the surface area, pore size distribution, and chemisorption properties of a solid sample.
Materials:
- Gas Sorption Analyzer: Equipped with high-vacuum system, pressure transducers, and a cryostat (typically liquid N₂ at 77 K) [14].
- Sample Tubes: With sealed ends for outgassing and analysis.
- High-Purity Gases: N₂, Ar, or Kr for physisorption; CO, H₂, O₂, or NH₃ for chemisorption [4].
- Sample: 50–500 mg of dry, powdered material [4].
Procedure:
- Sample Preparation (Outgassing):
- Weigh an appropriate amount of sample into a clean, dry sample tube.
- Attach the tube to the analyzer's preparation port.
- Apply vacuum and heat to the sample according to material-specific protocols (e.g., 150–300 °C for several hours) to remove moisture and contaminants from the surface [19].
Physisorption Isotherm Measurement:
- Transfer the degassed sample tube to the analysis port.
- Immerse the sample tube in a cryogenic bath (e.g., liquid N₂ at 77 K).
- Introduce doses of an inert gas (e.g., N₂) and measure the equilibrium pressure at each dose.
- Continue from low pressure (~0.00001 torr) up to saturation pressure (~760 torr) to obtain the full adsorption branch.
- Measure the desorption branch by progressively lowering the pressure [14].
Chemisorption Measurement (Static Volumetric Method):
- After physisorption analysis, evacuate the system to remove the physisorbed gas.
- Set the analysis station to a controlled, elevated temperature relevant to the chemisorption process.
- Introduce small, controlled doses of a reactive probe gas (e.g., CO, H₂).
- After each dose, allow the system to reach equilibrium and record the pressure.
- The amount of gas that remains strongly adsorbed (chemisorbed) at the set temperature is used for calculations [15] [4].
Temperature-Programmed Desorption (TPD):
- Saturate the sample surface with the probe gas at the analysis temperature.
- Evacuate the system to remove any physisorbed molecules.
- Program the furnace to heat the sample at a constant rate (e.g., 10 °C/min) under a flow of inert gas.
- Use a thermal conductivity detector (TCD) to monitor the desorption of the probe gas as a function of temperature.
- The temperature and area of desorption peaks provide information on the strength and density of active sites [15] [4].
Data Analysis and Calculations
For Physisorption (Surface Area & Porosity):
- BET Surface Area: Use the linearized BET equation with N₂ adsorption data in the relative pressure (P/P₀) range of 0.05–0.30 to calculate the monolayer capacity and specific surface area [14] [18].
- Pore Size Distribution: Apply mathematical models such as Density Functional Theory (DFT) or the Barrett-Joyner-Halenda (BJH) method to the adsorption or desorption isotherm to calculate pore size distribution [14].
For Chemisorption (Active Sites & Dispersion):
- Active Metal Surface Area: From the volume of chemisorbed gas (e.g., H₂ or CO) and assuming a stoichiometry (e.g., one H atom per surface metal atom), calculate the metal dispersion and active surface area [4].
- Active Site Strength: The peak temperature in a TPD profile indicates the strength of binding; higher temperatures correspond to stronger bonds [15].
Application Case Studies
Case Study 1: Pharmaceutical Pollutant Removal via Multilayer Physisorption
A hybrid adsorbent (AC/KCC-1/DEX) was developed for removing Acetaminophen (ACE) and Amoxicillin (AMOX) from water [16].
Findings:
- The adsorption kinetics were best described by the Elovich model, indicative of a heterogeneous surface.
- Advanced statistical physics modelling confirmed a multilayer physisorption mechanism, with additional contributions from chemisorption.
- The material exhibited high adsorption capacities of 87.97 mg/g for ACE and 77.31 mg/g for AMOX [16].
Table 2: Quantitative Adsorption Data for Pharmaceutical Removal [16]
| Parameter | Acetaminophen (ACE) | Amoxicillin (AMOX) |
|---|---|---|
| Adsorption Capacity | 87.97 mg/g | 77.31 mg/g |
| Percentage Removal | 94% | 81% |
| Best-Fit Kinetic Model | Elovich | Elovich |
| Identified Mechanism | Multilayer Physisorption | Multilayer Physisorption |
| Gibbs Free Energy (ΔG) | Negative (Spontaneous) | Negative (Spontaneous) |
Case Study 2: Dye Adsorption via Monolayer Chemisorption
Phyto-synthesized CuO nanoparticles were used for the adsorption of Congo red (CR) dye [17]. In a separate study, a CA@Lap hydrogel adsorbed Crystal Violet (CV) and Methylene Blue (MB) via monolayer chemisorption [20].
Findings for CuO Nanoparticles:
- Kinetic studies showed the adsorption followed a pseudo-second-order model (R² = 0.9997), which is characteristic of chemisorption.
- The maximum adsorption capacity for CR was 6.99 mg/g.
- Thermodynamic parameters (ΔH° = –34.35 kJ mol⁻¹) supported a combination of physical and chemical adsorption mechanisms [17].
Findings for CA@Lap Hydrogel:
- The adsorption mechanisms for CV and MB were identified as monolayer chemisorption [20].
- The hydrogel achieved ultra-high adsorption capacities of 2245.7 mg/g for CV and 3840.8 mg/g for MB [20].
Case Study 3: Synergistic Physico-Chemisorption for Gas Capture
A computational study screened nitrogen-rich Covalent Organic Frameworks (COFs) for capturing radioactive methyl iodide (CH₃I) [21].
Findings:
- The mechanism involves an initial chemisorption step where CH₃I undergoes N-methylation with specific N-sites in the COF, forming a stable chemical bond.
- This chemisorbed layer then acts as a substrate for further physisorption of additional CH₃I molecules through van der Waals interactions.
- The top-performing COFs (NH₂-Th-Bta COF and PTP-COF) achieved record-high gravimetric uptakes of 0.687 g g⁻¹ and 0.557 g g⁻¹, respectively, at trace concentrations (50 ppm), demonstrating the power of a synergistic mechanism [21].
The Scientist's Toolkit: Essential Research Reagents and Materials
The following table lists key materials and their functions in adsorption studies, as derived from the cited research.
Table 3: Key Research Reagents and Materials for Adsorption Studies
| Item | Function/Description | Example Use Case |
|---|---|---|
| Fibrous Silica (KCC-1) | A support material with unique dendritic, fibre-like morphology, large pore volume, and highly accessible surface area [16]. | Hosting and dispersing adsorptive sites in hybrid adsorbents [16]. |
| Maltodextrin (DEX) | A biodegradable, hydroxyl-rich polysaccharide used as a functionalization agent to introduce hydrogen bonding and polar interactions [16]. | Improving hydrophilicity and adsorption selectivity for polar pharmaceutical molecules [16]. |
| Probe Gases (H₂, CO, O₂, NH₃) | Reactive gases used in chemisorption experiments to titrate specific types of active sites on a catalyst surface [4]. | Determining metal dispersion, active surface area, and acid/base site strength [15] [4]. |
| Congo Red (CR) | A synthetic azo dye used as a model adsorbate for testing adsorption performance in aqueous solutions [17]. | Evaluating the efficiency and capacity of novel adsorbents like CuO nanoparticles [17]. |
| Covalent Organic Frameworks (COFs) | Crystalline porous polymers with modular design and high stability, allowing for precise functionalization [21]. | Designed with specific N-sites for synergistic chemisorption and physisorption of gases like CH₃I [21]. |
| Malva sylvestris Extract | A plant extract containing bioactive chemicals (e.g., flavonoids, polyphenols) that act as reducing and stabilizing agents [17]. | Green synthesis of metal oxide nanoparticles (e.g., CuO) for environmentally friendly adsorbents [17]. |
Workflow for Mechanism Identification
A systematic approach combining multiple characterization techniques is required to conclusively identify an adsorption mechanism. The following diagram outlines a decision-making workflow.
Diagram 2: A workflow for identifying adsorption mechanisms by analyzing isotherm type, kinetic models, thermodynamic parameters, and temperature-programmed desorption data.
Temperature and Pressure Dependence in Adsorption Phenomena
Adsorption, the process by which atoms or molecules accumulate on a solid surface, is a fundamental phenomenon critical to numerous scientific and industrial applications. The efficiency and mechanism of this process are predominantly governed by two extrinsic parameters: temperature and pressure [22]. Understanding their interdependence is essential for designing adsorption systems, from gas storage and separation to catalytic reactions and drug delivery.
This application note provides a structured overview of the temperature and pressure dependence in both physisorption and chemisorption. It includes key theoretical models, summarized quantitative data, detailed experimental protocols for gravimetric analysis, and a catalog of essential research reagents. The content is framed within a broader thesis on sorption measurement methods, serving as a practical guide for researchers and scientists.
Theoretical Framework: Adsorption Isotherms
An adsorption isotherm is a curve representing the equilibrium relationship between the concentration of adsorbate on the adsorbent surface and its concentration in the bulk phase at a constant temperature [23]. They provide macroscopic insights into adsorption capacity, strength, and the nature of the surface [23].
Several models describe this relationship, each with specific assumptions about the adsorption process. The table below summarizes the most prevalent models used to interpret experimental data.
Table 1: Key Adsorption Isotherm Models and Their Characteristics
| Isotherm Model | Linear Equation Form | Fundamental Assumptions | Key Parameters & Interpretation |
|---|---|---|---|
| Langmuir [23] [24] | C<sub>e</sub>/q<sub>e</sub> = 1/(K<sub>L</sub>q<sub>m</sub>) + C<sub>e</sub>/q<sub>m</sub> |
• Homogeneous surface• Monolayer coverage• Identical sites, no adsorbate interaction | • q<sub>m</sub> (mg/g): Maximum monolayer capacity• K<sub>L</sub> (L/mg): Langmuir constant related to affinity• R<sub>L</sub>: Separation factor indicating favorability |
| Freundlich [23] | ln q<sub>e</sub> = ln K<sub>F</sub> + (1/n) ln C<sub>e</sub> |
• Heterogeneous surface• Multilayer adsorption | • K<sub>F</sub>: Freundlich constant (capacity indicator)• 1/n: Heterogeneity factor (favorability indicator) |
| Temkin [23] | q<sub>e</sub> = (RT/b<sub>t</sub>) ln K<sub>T</sub> + (RT/b<sub>t</sub>) ln C<sub>e</sub> |
• Heat of adsorption decreases linearly with coverage• Uniform binding energy distribution | • K<sub>T</sub> (L/g): Equilibrium binding constant• b<sub>t</sub>: Temkin constant related to heat of adsorption |
| Dubinin–Radushkevich (D-R) [23] | ln q<sub>e</sub> = ln q<sub>m</sub> - βε²ε = RT ln(1 + 1/C<sub>e</sub>) |
• Applies to homogeneous and heterogeneous surfaces• Based on pore-filling mechanism | • β: Activity coefficient• E (kJ/mol): Mean sorption energy, distinguishing physical (E < 8 kJ/mol) vs. chemical (8 < E < 16 kJ/mol) adsorption |
Temperature and Pressure Dependence in Practice
The interplay between temperature (T) and pressure (P) directly dictates adsorption capacity. The general trends and underlying mechanisms are visualized below.
Diagram 1: T and P Effect on Adsorption Capacity
For physisorption, which relies on weak van der Waals forces, adsorption is exothermic. Consequently, capacity decreases as temperature increases, as the adsorbate molecules possess greater thermal energy to overcome the surface potential well. Higher pressure increases the driving force for mass transfer to the surface, enhancing capacity [22] [25].
In chemisorption, which involves the formation of stronger chemical bonds, the relationship is more complex. While still exothermic, the higher energy barrier means it often requires a specific activation energy and may occur within a narrower temperature window. The dependence on pressure follows a similar trend to physisorption but is also influenced by the surface coverage of chemically active sites [25].
Experimental data consistently validates these principles. For instance, a study on methane adsorption in transitional facies shale found that adsorption capacity increased with pressure but decreased with rising temperature across a range of 40–70 °C [24]. Furthermore, a linear relationship was observed between the Langmuir volume (VL, indicating capacity) and Langmuir pressure (PL, related to affinity) as temperature changed [24].
Experimental Protocol: Gravimetric Method
The following detailed protocol for conducting high-pressure isothermal adsorption experiments is adapted from studies on shale gas [24] and gas adsorption in Metal-Organic Frameworks (MOFs) [26], using a magnetic suspension balance (MSB) system.
Materials and Equipment
- Adsorbent: e.g., synthesized Cu-BTC particles [26] or crushed shale samples (40-60 mesh) [24].
- Adsorbate Gas: High-purity methane, CO₂, N₂, or H₂, depending on the study.
- Instrumentation: Rubotherm magnetic suspension balance (MSB) or equivalent gravimetric system.
- Auxiliary Systems: High-pressure chamber, vacuum system, ISCO pump for gas injection, precision temperature control system, data acquisition computer [24].
Step-by-Step Procedure
Diagram 2: Gravimetric Adsorption Experiment Workflow
Key Calculations:
- Buoyancy Correction: The true mass of adsorbed gas is derived from the balance reading, corrected for the buoyant force exerted by the fluid on the sample and sample holder [24]: ( m{\text{ads}} = m{\text{measured}} + \rho{\text{gas}} \cdot V{\text{sample+holder}} )
- Adsorption Capacity: The amount adsorbed per unit mass of adsorbent is calculated as ( q = m{\text{ads}} / m{\text{sample}} ).
The Scientist's Toolkit: Research Reagent Solutions
Table 2: Essential Materials and Reagents for Adsorption Studies
| Reagent/Material | Function/Description | Example Application |
|---|---|---|
| Cu-BTC (Basolite C300) | A metal-organic framework (MOF) with high surface area and tunable porosity, used as a benchmark adsorbent. | Equilibrium and kinetic studies of CO₂, CH₄, and N₂ adsorption [26]. |
| Transitional Facies Shale | A complex, heterogeneous natural adsorbent with high organic carbon content, used for studying gas occurrence in reservoirs. | High-pressure methane adsorption/desorption experiments [24]. |
| Amine-Functionalized MOFs | MOFs post-synthetically modified with amine groups to introduce strong, specific chemisorption sites for acidic gases like CO₂. | Selective CO₂ capture from flue gas or direct air capture, even under humid conditions [25] [27]. |
| Ni-decorated C12N12 Nanoclusters | A synthetic carbon-based nanomaterial where transition metals act as primary sites for H₂ adsorption via electrostatic and orbital interactions. | Hydrogen storage research; can bind up to eight H₂ molecules with favorable energetics for reversibility [28]. |
| Helium (Ultra-high Purity) | An inert, non-adsorbing gas used for dead volume calibration and buoyancy correction in volumetric and gravimetric systems. | Determination of the sample volume during the buoyancy test prior to adsorption measurement [24]. |
| Magnetic Suspension Balance (MSB) | A key instrument for gravimetric analysis that physically separates the microbalance from the high-pressure environment, ensuring accuracy. | High-pressure isothermal adsorption measurements up to 30 MPa [24]. |
The Role of Surface Area, Porosity, and Surface Chemistry
In the fields of material science and drug development, the interfacial properties of solids—specifically surface area, porosity, and surface chemistry—are critical parameters that dictate material performance and functionality. These properties directly influence a wide range of behaviors including catalytic activity, adsorption capacity, drug dissolution rates, and stability. Within the broader context of physisorption and chemisorption measurement methods research, accurate characterization of these properties provides fundamental insights into material behavior across diverse applications. Surface area determines the available space for molecular interactions, porosity defines the architecture and accessibility of this space, while surface chemistry governs the nature and strength of these interactions. This application note details standardized protocols and analytical methodologies for the comprehensive characterization of these essential material properties, with particular emphasis on techniques relevant to pharmaceutical development and advanced material design.
Surface Area Analysis
Theoretical Foundations
The Brunauer-Emmett-Teller (BET) theory is the most widely applied method for determining the specific surface area of porous and non-porous materials. The theory extends the Langmuir model to account for multilayer adsorption and is based on several key assumptions: gas molecules physically adsorb on a solid in layers infinitely, the Langmuir model applies to each layer, and the heat of adsorption for the first layer is unique while subsequent layers equal the heat of liquefaction [29].
The linearized BET equation takes the form: [ \frac{P/Po}{W(1-P/Po)} = \frac{1}{WmC} + \frac{C-1}{WmC}(P/Po) ] where (P/Po) is the relative pressure, (W) is the mass of adsorbed gas, (Wm) is the monolayer capacity, and (C) is the BET constant related to the adsorption energy [29]. For materials with polar surfaces, such as pharmaceuticals and food products, the Guggenheim-Anderson-de Boer (GAB) equation extends the applicability of the BET model to higher relative pressures (up to 0.8 (P/Po)) by introducing a constant (k) that corrects for the modified properties of molecules in layers beyond the first monolayer [29].
Experimental Protocol: BET Surface Area Measurement
Principle: The method determines the specific surface area by measuring the quantity of inert gas (typically nitrogen at 77 K) adsorbed as a monolayer on a solid surface, following the BET theory [30] [31].
Equipment and Reagents:
Sample Preparation (Degassing):
- Weigh an appropriate amount of sample into a clean, dry sample tube.
- Secure the tube to the degas port of the analyzer.
- Apply heat and vacuum to remove physisorbed contaminants (e.g., water vapor, hydrocarbons). Typical conditions are 423 K (150 °C) for 10 hours under vacuum, though parameters must be optimized based on material thermal stability [30] [33]. For temperature-sensitive pharmaceuticals, lower temperatures and extended times may be used.
Analysis Procedure:
- Transfer the degassed sample tube to the analysis port.
- Immerse the sample tube in a liquid nitrogen bath (77 K) to maintain isothermal conditions.
- The analyzer introduces incremental doses of nitrogen gas into the sample cell.
- The system measures the volume of gas adsorbed at each equilibrium pressure, typically across a relative pressure ((P/P_o)) range of 0.05 to 0.35 [33].
- The software constructs an adsorption isotherm (volume adsorbed vs. relative pressure).
Data Analysis:
- The software applies the BET equation to the linear region of the isotherm (usually (P/P_o = 0.05-0.35)).
- The monolayer capacity ((W_m)) is derived from the slope and intercept of the BET plot.
- The specific surface area ((S{BET})) is calculated using the equation: [ S{BET} = \frac{W_m \cdot N \cdot \sigma}{M} ] where (N) is Avogadro's number, (\sigma) is the cross-sectional area of the adsorbate molecule (0.162 nm² for N₂), and (M) is the molecular weight of the adsorbate.
Quality Control:
- Use certified surface area reference materials for instrument calibration.
- Ensure the correlation coefficient (R²) of the BET plot is >0.9999.
- The C constant should be positive for valid analysis.
The experimental workflow for BET surface area analysis is summarized in the diagram below.
Advanced Considerations
For microporous materials (pores < 2 nm), standard BET analysis may overestimate surface area. The BET Assistant AI tool can help identify the appropriate linear region for more accurate results [33]. For ultramicroporous characterization, probe gases like carbon dioxide at 273 K are recommended due to their higher diffusivity at higher temperatures, allowing them to access pores smaller than 0.5 nm [32] [33].
Table 1: Standard Gases for Surface Area and Porosity Analysis
| Gas | Analysis Temperature | Primary Application | Advantages |
|---|---|---|---|
| N₂ | 77 K | BET Surface Area, Meso/Micropores | Standard method, high accuracy, well-established protocols |
| Kr | 77 K | Very Low Surface Area (< 1 m²/g) | Higher sensitivity due to lower vapor pressure |
| CO₂ | 273 K (Ice Bath) | Ultramicropores (< 0.7 nm) | Faster diffusion into smallest pores at higher temperature |
| Ar | 77 K | Micropore Analysis | Avoids quadrupole moment issues with N₂ on certain surfaces |
Porosity Characterization
Pore Classification and Measurement Techniques
Porosity refers to the void spaces within a material, which are classified by IUPAC based on their width: micropores (< 2 nm), mesopores (2–50 nm), and macropores (> 50 nm) [31] [34]. The pore size distribution (PSD), pore volume, and pore connectivity are critical for understanding molecular transport, accessibility of active sites, and loading capacity.
Gas Physisorption is the primary technique for characterizing micro- and mesopores. It involves analyzing the physical adsorption and desorption of an inert gas to generate an isotherm, which is then interpreted using various models to extract pore structural information [35] [31]. Mercury Intrusion Porosimetry is used complementary for macroporous materials, relying on the non-wetting behavior of mercury forced into pores under high pressure [35] [34].
Experimental Protocol: Pore Size Distribution by Gas Physisorption
Principle: The method determines pore size distribution by analyzing the capillary condensation of gas (typically N₂ at 77 K) within the pores of a material. The pressure at which condensation occurs is directly related to the pore diameter via the Kelvin equation [31].
Equipment and Reagents:
- Gas adsorption analyzer (e.g., Quantachrome NOVA-e, Micromeritics 3Flex)
- High-purity nitrogen gas
- Liquid nitrogen Dewar
- Pre-degassed sample (see Section 2.2)
Analysis Procedure:
- After degassing, the sample is cooled to 77 K using liquid nitrogen.
- The relative pressure ((P/P_o)) is gradually increased from near-zero (e.g., 10⁻⁵) to 0.995, and the quantity of gas adsorbed is measured at each equilibrium point to generate the adsorption branch.
- The pressure is then progressively decreased to measure the desorption branch, creating a full adsorption-desorption isotherm [31].
- For high-resolution analysis, 40 or more data points are collected [33].
Data Analysis and Pore Size Models:
- Barrett-Joyner-Halenda (BJH) Method: The most common method for mesopore size distribution. It applies the Kelvin equation to the desorption isotherm (or adsorption isotherm) to calculate pore volumes and diameters, assuming cylindrical pore geometry [31].
- Density Functional Theory (DFT) and Non-Local DFT (NLDFT): These advanced models provide more accurate PSDs, especially for microporous materials, by considering the molecular-level structure of the adsorbed fluid. Quenched Solid DFT (QSDFT) is a further refinement for heterogeneous surfaces like carbons [31] [33].
- NLDFT Dual Isotherm Deconvolution: This method combines isotherms from two different probe gases (e.g., N₂ and CO₂) to generate a continuous PSD from ultramicropores into the mesopore range, providing the most complete picture for complex porous networks like activated carbons [32] [33].
Table 2: Models for Pore Size Distribution Analysis from Gas Physisorption
| Model | Applicable Pore Range | Principle | Best For |
|---|---|---|---|
| BJH | Mesopores (2–50 nm) | Kelvin equation for capillary condensation | Quality control, comparative studies of mesoporous materials |
| NLDFT | Micro- and Mesopores (0.5–50 nm) | Molecular statistical approach assuming idealized pore geometry | Zeolites, ordered silicas, MCM-type materials |
| QSDFT | Micro- and Mesopores (0.5–50 nm) | Accounts for surface roughness and heterogeneity | Activated carbons, disordered porous polymers, biochars |
Advanced Porosity Analysis
The 3Flex analyzer allows for sequential and combined analysis using multiple techniques (physisorption, chemisorption, vapor sorption) on a single sample without removal, providing a comprehensive material characterization profile [32]. For a complete pore analysis from micro- to macropores, data from gas physisorption can be combined with mercury intrusion porosimetry results in the software to create a seamless PSD over several orders of magnitude [32].
Surface Chemistry and Chemisorption
The Role of Surface Chemistry
While surface area and porosity define the physical landscape, surface chemistry determines the nature and energy of interactions between the solid and surrounding molecules. Specific chemical functional groups, acid/base sites, and metal centers govern processes like catalyst activity and selectivity, binding of APIs to excipients, and non-specific adsorption in analytical systems [36] [32].
Mitigating Non-Specific Adsorption: An Application Note
Challenge: Oligonucleotides, critical in genetic research and therapeutics, are prone to non-specific adsorption onto metal surfaces (e.g., stainless-steel HPLC systems and columns) due to interactions with their electron-rich phosphodiester backbone. This leads to poor recovery, peak tailing, and irreproducible results [36].
Solution:
- Traditional Passivation: A time-consuming process of masking active metal sites by repeatedly injecting a high concentration of the analyte or a passivating agent. This is not a longstanding solution [36].
- MaxPeak High Performance Surfaces (HPS) Technology: Employs hardware and columns with a proprietary surface chemistry that minimizes interaction with metal-sensitive analytes. This provides "out-of-the-box" performance without passivation, significantly improving recovery and reproducibility for oligonucleotides in HILIC analysis [36].
Experimental Data: A study compared the performance of traditional stainless-steel systems versus systems with MaxPeak HPS Technology for analyzing a MassPREP OST Standard oligonucleotide.
- Stainless-System + Steel Column: Initial recovery was low (~0%) and increased only after 20 passivation injections, demonstrating significant adsorption [36].
- HPS System + HPS Column: Achieved an average recovery of 98% from the initial injections, with excellent peak shape and reproducibility, effectively eliminating non-specific adsorption [36].
Experimental Protocol: Static Chemisorption for Active Metal Surface Area
Principle: Chemisorption involves the formation of chemical bonds between a probe gas and specific active sites on a surface. Static volumetric chemisorption measures the quantity of gas chemisorbed to determine active metal surface area, dispersion, and particle size in catalysts [32].
Equipment:
- Chemisorption analyzer (e.g., Micromeritics 3Flex with chemisorption option)
- High-purity probe gases (e.g., H₂, CO, O₂) and inert carrier gas (He, Ar)
- High-temperature furnace.
Sample Preparation (In-situ Reduction):
- The sample is placed in a quartz cell and heated under vacuum or inert gas flow.
- A reducing gas (e.g., 5% H₂ in Ar) is introduced while the temperature is ramped (e.g., to 400 °C) to reduce surface metal oxides to their active metallic state.
- The sample is then evacuated to remove any physisorbed species.
Analysis Procedure (Titration Method):
- The sample is exposed to repeated small, pulsed doses of the probe gas (e.g., H₂ for metals) at the analysis temperature (e.g., 35 °C).
- Each dose is allowed to equilibrate, and the pressure change is monitored.
- The process continues until no further adsorption is detected, indicating saturation of the active sites.
- The system is then evacuated to measure the amount of strongly chemisorbed gas.
Data Analysis:
- The total volume of chemisorbed gas is used to calculate the number of surface metal atoms.
- The active metal surface area is calculated assuming a stoichiometry (e.g., 1 H atom per surface metal atom) and a cross-sectional area for the metal atom.
- Metal dispersion (% of metal atoms on the surface) and average crystallite size are calculated from these values.
The logical relationship between measurement techniques and the material properties they characterize is outlined below.
The Scientist's Toolkit
Table 3: Essential Research Reagent Solutions and Materials
| Item | Function/Application | Key Considerations |
|---|---|---|
| High-Purity N₂ Gas (≥99.99%) | Primary adsorbate for BET surface area and meso/micropore analysis. | Essential for generating accurate, contaminant-free isotherms. Low purity can lead to skewed results. |
| Liquid N₂ | Cryogenic bath (77 K) for maintaining isothermal conditions during N₂ adsorption. | Level must be kept constant during analysis for stable temperature and pressure readings. |
| High-Purity CO₂ Gas | Adsorbate for characterizing ultramicropores (< 1.5 nm). | Used at 273 K (ice-water bath) for faster diffusion kinetics into the smallest pores [33]. |
| Micromeritics 3Flex Analyzer | High-performance instrument for physisorption, chemisorption, and vapor sorption. | Features a 0.1 torr transducer for ultramicropore analysis and three independent analysis ports [32]. |
| Degassing Station | Sample preparation for removal of physisorbed contaminants (e.g., H₂O). | Parameters (temperature, time) must be optimized to prevent altering or degrading the sample [30]. |
| MaxPeak HPS Columns/Systems | LC hardware with modified surface chemistry to mitigate non-specific adsorption. | Critical for accurate bioanalysis of metal-sensitive molecules like oligonucleotides and phosphorylated proteins [36]. |
| Quantachrome NOVA-e Series | Gas adsorption analyzer for surface area and porosity. | Designed to comply with standardized protocols like the European Biochar Certificate [33]. |
| Certified Reference Materials | Calibration and validation of surface area and pore size measurements. | Necessary for quality control and ensuring data integrity across different instruments and labs. |
The rigorous characterization of surface area, porosity, and surface chemistry is foundational to advancing research in catalysis, material science, and pharmaceutical development. The application notes and detailed protocols provided herein—from standard BET surface area analysis and advanced NLDFT pore size modeling to specialized chemisorption and surface passivation techniques—offer a framework for obtaining reliable and meaningful data. As evidenced by the integration of machine learning for material screening [37] and the development of advanced surface technologies to solve analytical challenges [36], this field continues to evolve. Employing these standardized methods allows researchers to deepen their understanding of structure-property relationships, ultimately guiding the rational design of more effective materials, catalysts, and therapeutic agents.
Core Measurement Techniques: From BET Analysis to Temperature-Programmed Methods
Physisorption Analysis with BET (Brunauer-Emmett-Teller) for Surface Area and Porosity
Physisorption analysis based on the Brunauer-Emmett-Teller (BET) theory provides a fundamental methodology for determining the specific surface area and porosity of solid materials, forming a crucial component of surface characterization techniques in both academic research and industrial applications [38] [39]. First published in 1938 by Brunauer, Emmett, and Teller, this theory extends Langmuir's concept of monolayer adsorption to multilayer adsorption systems, enabling accurate surface area measurements for diverse materials ranging from pharmaceuticals to advanced catalysts [38]. The widespread adoption of BET analysis across scientific disciplines stems from its ability to provide critical information about material properties that directly impact performance characteristics such as dissolution rates, catalytic activity, moisture retention, and shelf life [38].
Within the broader context of physisorption and chemisorption measurement methods research, BET theory specifically addresses physical adsorption (physisorption), where gas molecules adhere to solid surfaces primarily through van der Waals forces without forming chemical bonds [14]. This contrasts with chemisorption, which involves stronger chemical bonds and typically results in irreversible adsorption [14]. The BET method's particular strength lies in its applicability to both porous and non-porous materials regardless of particle size and shape, making it an indispensable tool for researchers characterizing novel materials and optimizing industrial processes [38].
Theoretical Principles of BET Analysis
Fundamental Concepts and Equations
The BET theory is founded on several key hypotheses that extend the Langmuir model for monolayer adsorption to multilayer systems. The fundamental assumptions include: (1) gas molecules physically adsorb on a solid in theoretically infinite layers; (2) gas molecules interact only with adjacent layers; (3) the Langmuir theory can be applied to each layer; (4) the enthalpy of adsorption for the first layer is constant and greater than that for subsequent layers; and (5) the enthalpy of adsorption for the second and higher layers equals the enthalpy of liquefaction [39]. These premises lead to the derivation of the classic BET equation:
[ \frac{p/p0}{v[1-(p/p0)]} = \frac{c-1}{vm c} \left( \frac{p}{p0} \right) + \frac{1}{v_m c} ]
where (p) is the equilibrium pressure, (p0) is the saturation pressure of the adsorbate at the analysis temperature, (v) is the adsorbed gas quantity, (vm) is the monolayer capacity, and (c) is the BET constant related to the adsorption energy [39]. The term (c) is exponentially related to the difference between the heat of adsorption of the first layer ((E1)) and the heat of liquefaction ((EL)) according to:
[ c = \exp\left( \frac{E1 - EL}{RT} \right) ]
where (R) is the gas constant and (T) is the absolute temperature [39].
For most solids using nitrogen as the adsorbate, the linear relationship described by the BET equation is restricted to a relative pressure ((p/p0)) range of 0.05 to 0.35 [38]. Within this region, a plot of (1/[v(p0/p)-1]) versus (p/p0) yields a straight line with slope (s = (c-1)/(vm c)) and intercept (i = 1/(vm c)) [38] [39]. The monolayer capacity (vm) is then calculated from:
[ v_m = \frac{1}{s + i} ]
The specific surface area (S_{BET}) is subsequently determined using:
[ S{BET} = \frac{vm N \sigma}{m} ]
where (N) is Avogadro's number, (\sigma) is the cross-sectional area of the adsorbate molecule, and (m) is the sample mass [38] [39]. For nitrogen adsorption at 77 K, the generally accepted value for (\sigma) is 16.2 Ų/molecule (0.162 nm²) [38].
Comparison of Physisorption and Chemisorption
Understanding BET analysis requires distinguishing between physisorption and chemisorption processes, as both represent important but distinct gas-solid interaction mechanisms with different applications in materials characterization.
Table 1: Comparison between Physisorption and Chemisorption Processes
| Parameter | Physisorption | Chemisorption |
|---|---|---|
| Binding Forces | Weak van der Waals forces | Strong chemical bonds |
| Reversibility | Reversible | Often irreversible |
| Temperature Range | Typically occurs at cryogenic temperatures (e.g., 77 K for N₂) | Can occur across a wide temperature range, often up to 1100°C |
| Application in BET | Primary mechanism for surface area and porosity measurements | Used for catalyst characterization, surface modification studies |
| Typical Gases | N₂, Ar, Kr, CO₂ | CO, H₂, NH₃, O₂, SO₂ |
| Enthalpy of Adsorption | Similar to liquefaction enthalpy | Significantly higher, similar to chemical bond energies |
Experimental Protocols for BET Analysis
Sample Preparation and Degassing
Proper sample preparation is critical for obtaining accurate and reproducible BET surface area measurements. The initial and most crucial step involves sample degassing to remove moisture and other contaminants from the sample surface [41]. This process typically involves subjecting the sample to elevated temperatures and vacuum conditions to eliminate physically bonded surface impurities [41]. For most materials, degassing is performed under vacuum at temperatures high enough to remove contaminants without altering the sample's intrinsic structure [41]. The Autosorb Degasser, for instance, offers pretreatment in vacuum from room temperature up to 350°C across six independent stations [40]. Special consideration must be given to hydrate materials susceptible to phase transformation during degassing, as conventional degassing may induce dehydration and alter the material's properties [42].
Measurement Procedure
Following proper degassing, the BET analysis proceeds through a systematic workflow to obtain the adsorption isotherm:
The specific experimental parameters must be carefully controlled throughout this process. The sample is cooled using a cryogenic liquid, typically liquid nitrogen at 77 K for nitrogen adsorption measurements [38] [41]. The temperature of the solid sample is maintained constant under isothermal conditions while the pressure or concentration of the adsorbing gas is systematically increased [38]. The amount of gas adsorbed at each pressure point is monitored to create the adsorption isotherm, which represents the foundation for all subsequent calculations [41].
Gas Selection and Sample Quantity Considerations
Appropriate selection of adsorbate gas and sample quantity is essential for obtaining accurate BET surface area measurements. The choice depends primarily on the expected surface area of the material.
Table 2: Gas Selection and Sample Requirements for BET Analysis
| Parameter | Nitrogen (N₂) | Krypton (Kr) |
|---|---|---|
| Typical Application | Materials with surface area >1 m²/g | Low surface area materials (<1 m²/g) |
| Analysis Temperature | 77 K (liquid nitrogen) | 77 K (liquid nitrogen) |
| Vapor Pressure at 77 K | 760 mmHg | 2.5 mmHg |
| Advantages | Widely used, well-characterized | Greater accuracy for low surface areas due to lower vapor pressure |
| Typical Sample Amount | 500 mg to 1 g (depending on expected surface area) | Smaller amounts may be sufficient |
| Cross-sectional Area | 0.162 nm²/molecule | 0.202 nm²/molecule |
The optimal sample amount depends on the instrument type, sample tube size, and the desired measurement accuracy. Generally, the total surface area of the sample should be at least 7.62 m² to maintain uncertainty below 5% for analysis in a ½" OD sample tube using nitrogen at 77 K [43]. For materials with an expected specific surface area of 10 m²/g, this translates to approximately 0.762 g of sample [43]. Single-point measurements are typically offered for quality control of established materials with known specific surface area, while multi-point analysis is recommended for unknown materials to ensure accuracy [41].
Data Interpretation and Analysis
BET Isotherm Interpretation
The adsorption isotherm obtained from BET measurements provides critical information about the material's surface and pore characteristics. A typical BET isotherm displays the relationship between the relative pressure (P/P₀) and the volume of gas adsorbed. The linear region of the BET plot generally falls within the relative pressure range of 0.05 to 0.35 for most solids using nitrogen as the adsorbate [38]. Beyond surface area determination, the complete isotherm shape yields valuable insights into porosity and adsorption mechanisms, with different isotherm classifications (Type I-VI) indicating distinct material characteristics and pore structures.
Porosity Analysis
Gas adsorption enables comprehensive characterization of a material's porosity, revealing structural insights that complement surface area information. As gas pressure increases, pores within the material fill systematically, beginning with smaller pores and progressing to larger ones until saturation occurs [14]. Gas adsorption is generally applicable to pores ranging from approximately 0.35 nm to 400 nm in diameter [14].
Table 3: Porosity Characterization by Gas Adsorption
| Pore Classification | Size Range | Typical Calculation Models |
|---|---|---|
| Micropore | < 2 nm | Density Functional Theory (DFT), M-P Method, Dubinin Plots (D-R, D-A), Horvath-Kawazoe (H-K), t-plot |
| Mesopore | 2-50 nm | Barrett, Joyner, and Halenda (BJH), Density Functional Theory (DFT), Dollimore-Heal (DH) |
| Macropore | > 50 nm | Barrett, Joyner, and Halenda (BJH), Density Functional Theory (DFT), Dollimore-Heal (DH) |
| Special Cases | > 400 nm | Mercury intrusion porosimetry (3 nm to 1100 µm) |
The following diagram illustrates the complete workflow from experimental data to comprehensive material characterization:
Research Reagent Solutions and Materials
Successful BET analysis requires specific reagents and instrumentation tailored to the material properties and information requirements.
Table 4: Essential Research Reagents and Instruments for BET Analysis
| Reagent/Instrument | Function/Specification | Application Notes |
|---|---|---|
| Nitrogen Gas (N₂) | Primary adsorbate for standard surface area measurement | High purity (99.99%+), suitable for materials with SSA >1 m²/g, cross-sectional area: 0.162 nm²/molecule |
| Krypton Gas (Kr) | Adsorbate for low surface area materials | Preferred for SSA <1 m²/g, lower vapor pressure enables greater accuracy for small surface areas |
| Liquid Nitrogen | Cryogen for maintaining 77 K analysis temperature | Standard coolant for N₂ and Kr adsorption measurements |
| Degassing Station | Sample preparation under vacuum and elevated temperature | Removes moisture and contaminants; typically 6 stations, up to 350°C |
| Physisorption Analyzer | Measures gas adsorption at controlled pressures and temperatures | Static volumetric method; examples: Autosorb iQ, ASAP series, 3Flex |
| Sample Tubes | Containers for solid samples during analysis | Various sizes (¼" to ½" OD); with/without filler rods depending on application |
Modern physisorption analyzers such as the Autosorb iQ2 offer comprehensive capabilities for both physisorption and chemisorption measurements, with temperature ranges from 77-120 K for physisorption and up to 1100°C for chemisorption studies [40]. The ASAP 2020 Plus provides a high-resolution surface area and porosity analyzer suitable for research, development, and quality control applications, while the TriStar II Plus enables highest-throughput automated BET surface area analysis through three-sample parallel measurements [14].
Applications in Pharmaceutical and Material Sciences
Pharmaceutical Development
BET surface area analysis plays a critical role in pharmaceutical development, where specific surface area significantly impacts product performance. Many pharmaceutical powder blend ingredients, including active pharmaceutical ingredients (APIs), binders, lubricants, and excipients are characterized by their BET surface area to ensure optimal dissolution rates, cohesion, and bio-availability [38]. The surface area directly influences drug dissolution behavior, as higher surface area typically enhances dissolution rates, potentially improving bioavailability [38]. This is particularly important for poorly soluble drugs where dissolution rate-limited absorption may occur.
Special considerations apply for hydrate-anhydrate systems susceptible to phase transformation during conventional BET analysis. Standard degassing under low pressure may induce dehydration in certain pharmaceutical hydrates, altering their physical structure and compromising measurement accuracy [42]. For such sensitive materials, inverse gas chromatography (IGC) has emerged as a reliable alternative technique, allowing SSA measurement under controlled relative humidity conditions that maintain physical stability [42]. Studies on trehalose dihydrate and thiamine HCl non-stoichiometric hydrate have demonstrated that these materials undergo partial phase transformation to anhydrous forms during conventional BET analysis but remain stable during IGC measurements [42].
Advanced Material Characterization
Beyond pharmaceutical applications, BET analysis supports diverse fields through characterization of material properties that dictate performance:
Catalysis: Heterogeneous catalysts, primarily solids, are used in many industrial chemical processes and typically comprise a reactive species on a non-reactive or inert support [38]. The surface area of both components influences the reaction rate and yield, with higher surface area providing more active sites that generally improve reaction efficiency [38] [44].
Battery Technology: The performance of various battery components, including anodes, cathodes, and separator membranes, is significantly affected by their surface areas [38]. Properties such as charging and discharging rates, impedance, and capacity correlate with the surface areas of these materials [38]. Electrodes with high surface area can enhance charge transfer and energy storage capacity [44].
Carbon Materials and Graphene: BET analysis serves as a quality control tool for characterizing graphene and graphite powders [45]. The theoretical surface area of monolayer graphene is 2630 m²/g, and as layers stack to form non-porous graphitic materials, the specific surface area decreases proportionately with increasing number of layers (S = 2630/N m²/g) [45]. This relationship enables estimation of layer numbers in graphitic materials, though accuracy can be affected by factors such as amorphous carbon content and aggregation upon drying [45].
Ceramics and Construction Materials: Ceramics used in applications ranging from everyday items to advanced technical products like semiconductors and microchips are characterized for surface area to understand impacts on sintering behavior, thermal properties, and moisture retention [38]. Similarly, the fineness of cement and concrete directly influences their performance characteristics and is routinely monitored using BET analysis [41].
Method Validation and Quality Considerations
For regulatory applications, particularly in pharmaceutical development, proper method validation is essential for BET measurements. Under GMP conditions, method validation confirms that an analytical procedure's performance suits its intended purpose, with assessment of characteristics including specificity, accuracy, precision, limit of detection/quantification, linearity, and range [46]. A fit-for-purpose validation approach adjusts validation requirements according to the development phase, ensuring appropriate rigor without unnecessary resource expenditure [46].
For compendial methods referenced in pharmacopeias such as Ph. Eur. or USP, method verification rather than full validation is typically required. Compendial method verification confirms that the established method is suitable and reliable for its intended purpose under the specific conditions of the laboratory where it will be employed [46]. The extent of verification depends on the method type and the specific product or matrix being tested [46].
Quality control laboratories offering BET analysis services typically provide various measurement options, including multipoint surface area using nitrogen or krypton gas (following ISO 9277), specific surface area measurements according to ASTM D6556, comprehensive adsorption-desorption isotherms, high-resolution micropore analysis, and specialized isotherms using alternative gases like CO₂ or at user-defined conditions [14]. These standardized approaches ensure reproducibility and reliability of BET measurements across different laboratories and applications.
Static Volumetric Chemisorption for Active Site and Metal Dispersion Analysis
Static volumetric chemisorption is a foundational technique in heterogeneous catalysis research for quantitatively determining the number of active sites on catalyst surfaces and calculating metal dispersion. This method operates under high-vacuum conditions where precise pressure-volume-temperature (P-V-T) measurements allow accurate quantification of gas molecules strongly chemisorbed onto active metal sites [47]. Unlike physical adsorption (physisorption) which involves weak van der Waals forces, chemisorption involves the formation of strong chemical bonds through electron sharing between the adsorbate gas and the solid catalyst surface, typically with heats of adsorption ranging from 80-800 kJ/mole [48]. This strong, specific interaction forms at most a monolayer, making it ideal for counting surface active sites [49] [48].
Within the broader context of physisorption and chemisorption measurement methods research, static volumetric chemisorption provides complementary information to physical adsorption techniques. While physisorption characterizes the total surface area and porous structure of catalyst supports, chemisorption selectively probes only the catalytically active surfaces capable of forming chemical bonds with specific probe molecules [48]. This selectivity makes it indispensable for determining structure-activity relationships in catalyst design and evaluation.
Theoretical Principles
Fundamental Mechanism
The static volumetric method measures gas uptake by monitoring pressure decrease in a system of known volume at constant temperature. When a catalyst sample is exposed to a specific probe gas, molecules form strong covalent or ionic bonds with surface metal atoms, creating a monolayer of chemisorbed species [49]. The number of gas molecules consumed corresponds directly to the number of surface metal atoms available, following the ideal gas law (PV = nRT) which applies accurately at the sub-atmospheric pressures employed [47].
The process is highly selective and depends on both the chemical nature of the catalyst surface and the choice of probe molecule [48]. Unlike physisorption, which can form multilayers and occurs on all surfaces, chemisorption requires specific chemical compatibility between adsorbate and adsorbent, typically forms only a monolayer, and is often irreversible under standard conditions [48].
Quantitative Relationship to Catalyst Properties
The fundamental measurement obtained is the chemisorption uptake (n_ads), representing moles of gas chemisorbed per gram of catalyst. This value relates directly to key catalyst parameters through established equations:
Metal Dispersion (D): The fraction of total metal atoms present on the surface.
Active Metal Surface Area (S_A): The specific surface area of the active metal component.
Where N_A is Avogadro's number, σ is the cross-sectional area of metal atom, and SF is the stoichiometry factor.
Average Crystallite Size (d): Assuming spherical crystallites,
Where K is a geometric factor (typically 6 for spheres) and V_m is the atomic volume of the metal [47].
The critical parameter linking uptake to surface metal atoms is the adsorption stoichiometry (nads:Ms), which represents the number of gas molecules adsorbed per surface metal atom. This ratio must be established through independent calibration studies for each metal-adsorbate system [47].
Table 1: Established Adsorption Stoichiometries for Common Catalyst Systems
| Metal | Adsorbate | Stoichiometry (nads:Ms) | Binding Mode | Reference |
|---|---|---|---|---|
| Nickel (Ni) | H₂ | 1:1 | Dissociative | [47] |
| Nickel (Ni) | CO | 0.5-3:1 | Linear/Bridged | [47] |
| Platinum (Pt) | H₂ | 1:1 | Dissociative | [47] |
| Platinum (Pt) | CO | 1:1 | Linear | [50] |
Experimental Protocol
Instrumentation and Materials
Essential Instrument Components:
- High-vacuum system capable of reaching pressures < 10⁻³ Torr
- Calibrated volume chambers with precise temperature control
- High-accuracy pressure transducers
- Sample manifold with heating/cooling capabilities
- Gas handling system for ultra-pure probe gases
- Temperature-programmable furnace
Common Probe Gases and Applications:
- Hydrogen (H₂): For metals like Pt, Ni, Ru [47] [48]
- Carbon Monoxide (CO): For Pt, Pd, Rh [51] [50]
- Oxygen (O₂): For titration studies and specific metals [52]
- Nitrous Oxide (N₂O): For metals with low H₂/CO affinity (Cu, Ag) [50]
Step-by-Step Methodology
Figure 1: Experimental workflow for static volumetric chemisorption analysis.
Sample Preparation and Pretreatment
- Loading: Precisely weigh (typically 0.1-1.0 g) catalyst sample into a known sample tube volume (V_s) [47].
- Pretreatment: Apply specific thermal treatment under vacuum or flowing gas to remove contaminants:
- Temperature: Variable depending on catalyst (often 150-400°C)
- Duration: Typically 1-4 hours
- Environment: Vacuum, inert gas, or reducing/oxidizing atmosphere
- Activation: For reduced metal catalysts, activate surface sites using H₂ reduction at elevated temperatures (e.g., 350°C for 2-4 hours) followed by evacuation to remove residual hydrogen [48].
Measurement Procedure
- System Calibration: Precisely determine the volumes of all system components (Vk, Vs) using helium expansion [47].
- Gas Dosing: Introduce a known amount of probe gas (ni) into the calibrated volume (Vk) at initial pressure (P_i) and temperature (T) [47].
- Expansion and Equilibration: Expand the gas into the sample volume (Vs) and allow the system to reach adsorption equilibrium, monitoring the pressure decrease until stable (Pf). Equilibrium time varies from minutes to hours depending on the system [47].
- Uptake Calculation: Calculate moles adsorbed using the ideal gas law: where R is the ideal gas constant [47].
- Isotherm Construction: Repeat dosing steps at various pressures to construct an adsorption isotherm (n_ads vs. P).
Data Analysis
- Isotherm Interpretation: Extrapolate the linear portion of the isotherm to zero pressure to determine total chemisorption capacity [47].
- Reversible/Irreversible Uptake: For some systems, a second isotherm measures reversible adsorption. The difference between first and second isotherms gives irreversible uptake [49].
- Parameter Calculation: Apply appropriate stoichiometry factors to calculate dispersion, active surface area, and crystallite size.
Comparative Data and Applications
Method Validation Studies
Table 2: Comparison of Static Volumetric and Dynamic Pulse Chemisorption for Supported Pt Catalysts [51]
| Catalyst Description | Pt Loading (wt%) | Method | CO Uptake (μmol/g) | Analysis Time |
|---|---|---|---|---|
| ASTM Standard Pt/Al₂O₃ | 0.5 | Volumetric Chemisorption | 10.2 | >6 hours |
| ASTM Standard Pt/Al₂O₃ | 0.5 | Pulse Chemisorption | 8.8 | <30 minutes |
| In-house Pt/Al₂O₃ | 0.3 | Volumetric Chemisorption | 10.0 | >6 hours |
| In-house Pt/Al₂O₃ | 0.3 | Pulse Chemisorption | 9.1 | <30 minutes |
Table 3: Comparison of Static Volumetric and TPD Methods for Supported Co Catalysts [51]
| Catalyst Description | Promoter | Method | H₂ Uptake (μmol/g) |
|---|---|---|---|
| 20 wt% Co/Al₂O₃ | None | Volumetric Chemisorption | 41 |
| 20 wt% Co/Al₂O₃ | None | TPD | 42 |
| 20 wt% Co/0.5 wt% Ru/Al₂O₃ | Ru | Volumetric Chemisorption | 164 |
| 20 wt% Co/0.5 wt% Ru/Al₂O₃ | Ru | TPD | 188 |
Advantages and Limitations
Advantages of Static Volumetric Method:
- High-resolution measurements from very low to atmospheric pressure
- Direct application of ideal gas law for precise quantification
- Ability to distinguish between reversible and irreversible adsorption [49]
- Established as reference method for many catalyst systems
Limitations:
- Significant time requirement (typically several hours to complete) [51]
- Complex instrumentation requiring high-vacuum capabilities
- Sensitivity to temperature fluctuations and system leaks
- Equilibrium times can be lengthy for slow-adsorbing systems [47]
The Scientist's Toolkit
Essential Research Reagent Solutions
Table 4: Key Reagents and Materials for Static Volumetric Chemisorption
| Reagent/Material | Function | Application Notes |
|---|---|---|
| Ultra-high Purity H₂ (99.999%) | Reductive pretreatment & probe gas | Remove O₂ and H₂O traces; use with appropriate safety precautions |
| Ultra-high Purity CO (99.995%) | Probe gas for specific metals | Toxic gas requiring proper ventilation; linear binding on Pt [50] |
| Ultra-high Purity O₂ (99.998%) | Oxidative pretreatment & titration | For surface oxidation studies and titration measurements [52] |
| Ultra-high Purity He (99.999%) | System calibration & purging | Chemically inert; used for dead volume determination |
| Liquid N₂ (77 K) or other coolants | Temperature control | For low-temperature adsorption studies |
| Reference Catalyst Materials | Method validation | ASTM standards (e.g., 0.5% Pt/Al₂O₃) for quality control [51] |
Instrumentation Solutions
Commercial static volumetric analyzers include the Micromeritics 3Flex and ASAP 2020 Plus, which automate the precise dosing and pressure measurement steps [49]. These systems integrate high-vacuum capabilities, precise pressure transducers, calibrated volume chambers, and temperature control for reproducible measurements. The 3Flex instrument additionally combines static chemisorption with physical adsorption capabilities for comprehensive catalyst characterization [49].
Critical Parameters and Troubleshooting
Optimization Guidelines
Adsorption Stoichiometry: Always use the stoichiometry factor established for the specific experimental conditions (temperature, pressure) being employed, as these ratios are temperature-dependent [47].
Equilibrium Time: Ensure sufficient time is allowed at each pressure point to reach true equilibrium, which may range from minutes to hours depending on the metal-adsorbate system [47].
Pretreatment Conditions: Follow established protocols for specific catalyst systems, as inadequate pretreatment is a common source of error in uptake measurements.
Data Interpretation Considerations
The distinction between "reversible" and "irreversible" chemisorption is system-dependent. For example, with hydrogen adsorption on Ni or Rh catalysts, total adsorption (reversible + irreversible) is used for crystallite size calculations, while for Ru catalysts, only the irreversible adsorption is counted [47]. This reflects differences in how weakly held hydrogen interacts with various metal surfaces.
Figure 2: Data analysis pathway from gas uptake to catalyst parameters.
Static volumetric chemisorption remains the reference method for determining active metal surface area and dispersion in heterogeneous catalysts, providing fundamental quantitative data linking catalyst structure to performance. While dynamic methods like pulse chemisorption offer advantages in speed and simplicity for quality control applications [51], the static volumetric technique provides higher resolution data and the ability to distinguish between strongly and weakly chemisorbed species. When properly applied with appropriate stoichiometric factors and experimental conditions, this technique yields reliable, reproducible parameters essential for catalyst design, optimization, and deactivation studies in both research and industrial applications.
Dynamic Flow (Pulse) Chemisorption for Catalyst Saturation Capacity
Within the broader research on physisorption and chemisorption measurement methods, dynamic flow (pulse) chemisorption stands as a pivotal technique for quantifying the active surface area and saturation capacity of heterogeneous catalysts. Unlike physisorption, which involves weak van der Waals interactions, chemisorption involves strong, specific, and often irreversible covalent or ionic bonds that form a monolayer on the solid surface [50] [53] [54]. This specificity makes chemisorption techniques essential for determining fundamental catalyst properties, including the number, nature, and strength of active sites [13]. The pulse chemisorption method provides critical parameters such as metal dispersion, metallic surface area, and active crystallite size, which are indispensable for evaluating catalyst activity and designing more efficient catalytic materials [50] [53].
Working Principle of Pulse Chemisorption
The pulse chemisorption technique operates on the principle of sequentially dosing a known quantity of probe gas onto a catalyst sample until the surface active sites are saturated [50]. The process involves several key stages, as illustrated in the workflow below.
Figure 1: Pulse Chemisorption Workflow for Catalyst Saturation Capacity Analysis.
Initially, the catalyst sample is pretreated with a reducing gas mixture (e.g., H₂ in Ar) at an elevated temperature to reduce the active metal surface [50]. Subsequently, an inert purge gas flows through the sample bed to remove any residual reductant. The sample is then cooled to the analysis temperature (often ambient temperature). The core of the technique involves injecting precise pulses of a probe gas (e.g., H₂, CO, O₂, N₂O) into the inert carrier gas stream flowing over the catalyst [50]. A Thermal Conductivity Detector (TCD) located downstream measures the amount of unadsorbed gas from each pulse. The process continues until the difference in area between consecutive peaks is within a predefined tolerance (typically 5%), indicating that the catalyst surface has reached its saturation capacity [50].
Experimental Protocols
Sample Preparation and Pretreatment
- Sample Loading: Weigh approximately 0.1-0.5 g of catalyst powder into a quartz U-tube sample holder. For consistency, use a sample mass that provides a total active metal surface area of 1-10 m² [50].
- In-Situ Reduction: Activate the catalyst by heating (typically 300-400°C) under a flowing stream of 10% H₂/Ar (20-30 mL/min) for 1-2 hours to reduce surface metal oxides to their active metallic state [50].
- Purging: After reduction, flush the sample with an inert gas (e.g., He or Ar) at the reduction temperature for 30 minutes to remove any physisorbed hydrogen or reduction products [50].
- Cooling: Cool the sample in the inert gas stream to the desired analysis temperature (often 35°C). Maintain a constant flow rate throughout the experiment.
Pulse Chemisorption Analysis
- Probe Gas Selection: Choose an appropriate probe gas based on the active metal. Common gases include 10% H₂/Ar, 10% CO/He, or 10% N₂O/He [50].
- Calibration: Calibrate the sample loop volume by injecting multiple pulses of the probe gas into the inert carrier stream without the sample present. Calculate the volume per pulse using the known concentration and the integrated peak areas.
- Saturation Dosing: Inject repeated pulses of the probe gas into the carrier stream flowing over the catalyst sample. Maintain a constant time interval between pulses (typically 5-10 minutes) to allow for complete adsorption.
- Endpoint Determination: Continue dosing until the peak areas from the TCD detector stabilize, indicating no further adsorption is occurring. The saturation endpoint is typically defined when the difference in area between three consecutive peaks is less than 5% [50].
Data Processing and Calculations
The raw data from pulse chemisorption consists of a sequence of peaks corresponding to unadsorbed gas from each pulse. The first peak is often completely consumed by the sample, with subsequent peaks showing increasing breakthrough until saturation is achieved [50]. The following dot script illustrates this data interpretation logic.
Figure 2: Data Processing Workflow for Pulse Chemisorption Results.
Key parameters are calculated as follows [50]:
- Total Gas Uptake: ( V{ads} = V{pulse} \times \sum (1 - Ai/A{cal}) ) where ( V{pulse} ) is the calibrated pulse volume, ( Ai ) is the area of the ith peak, and ( A_{cal} ) is the average calibration peak area.
- Metal Dispersion (%D): ( %D = \frac{(V{ads} \times SF \times Mw \times 100)}{(m \times Mf \times 22400)} ) where ( SF ) is the stoichiometry factor, ( Mw ) is the atomic weight of metal, ( m ) is the sample mass, and ( M_f ) is the mass fraction of metal in the catalyst.
- Metallic Surface Area: ( SAm = \frac{(V{ads} \times SF \times NA \times Am)}{22400} ) where ( NA ) is Avogadro's number and ( Am ) is the cross-sectional area of the metal atom.
Case Study: Platinum on Alumina Catalyst
To demonstrate the practical application of pulse chemisorption for determining catalyst saturation capacity, a standard 0.5% Pt/Al₂O₃ reference material was analyzed using both H₂ and CO as probe gases on a ChemiSorb Auto instrument [50]. The specification for this material is a metal dispersion of 31% ±5%.
Table 1: Pulse Chemisorption Results for 0.5% Pt/Al₂O₃ Using Different Probe Gases [50]
| Experiment | Run 1 | Run 2 | Run 3 | Average (x̄) | Std Dev (σ) |
|---|---|---|---|---|---|
| Metal Dispersion (%), CO | 31.88 | 32.22 | 30.06 | 31.39 | 1.16 |
| Metal Dispersion (%), H₂ | 34.73 | 34.21 | 34.94 | 34.63 | 0.37 |
The data shows that the choice of probe gas influences the calculated metal dispersion due to different adsorption stoichiometries. Hydrogen dissociatively adsorbs on Pt with a stoichiometry of H:Ptₛ = 1:1 (where Ptₛ is a surface Pt atom), giving a stoichiometric factor of 2 [50]. In contrast, CO typically adsorbs linearly on Pt/Al₂O₃ with a stoichiometry of 1:1 (stoichiometric factor of 1) [50]. The 0.5% Pt/Al₂O₃ metal loading does not imply all platinum participates in reactions; measurement revealed only approximately 31-35% of platinum is accessible and actively involved in surface reactions [50]. The remaining platinum may be embedded within the bulk material or trapped inside the support structure, making it inaccessible for catalytic activity.
The Scientist's Toolkit: Essential Research Reagents and Materials
Table 2: Key Research Reagent Solutions for Pulse Chemisorption Experiments
| Reagent/Material | Function | Application Notes |
|---|---|---|
| 10% H₂/Ar Blend | Reduction gas and probe gas | Reduces metal oxides; dissociatively adsorbs on Pt, Pd, Ni. Stoichiometry factor of 2 for Pt [50]. |
| 10% CO/He Blend | Alternative probe gas | Binds linearly or in bridged fashion to metals; preferred for Pd-based catalysts to avoid hydride formation [50]. |
| 10% N₂O/He Blend | Selective oxidation probe gas | Used for metals with low H₂/CO affinity (e.g., Cu, Ag) via surface oxidation [50]. |
| High-Purity Inert Gases (He, Ar) | Carrier and purge gas | Provides inert environment; removes residual reactants between steps [50]. |
| Certified Reference Catalyst | Method validation | 0.5% Pt/Al₂O₃ with known dispersion verifies instrument performance [50]. |
| Thermal Conductivity Detector (TCD) | Detection of unadsorbed gas | Measures concentration differences based on thermal conductivity; effective with H₂/Ar due to large conductivity difference [50]. |
Critical Parameters and Method Optimization
Probe Gas Selection and Stoichiometry
The appropriate selection of probe gas is critical for accurate saturation capacity measurement and depends on both the stoichiometric factor and binding affinity for the specific metal [50]. The following table summarizes recommended probe gases for common catalytic metals.
Table 3: Probe Gas Selection Guide for Common Catalyst Metals [50]
| Metal | Recommended Probe Gases | Alternative/Notes | Stoichiometry Factor |
|---|---|---|---|
| Pt | H₂, CO | H₂ dissociates (H:Ptₛ = 1:1); CO typically linear (CO:Ptₛ = 1:1) | H₂: 2; CO: 1 |
| Pd | CO | Avoid H₂ due to hydride formation with bulk Pd | CO: 1-2 (depends on configuration) |
| Cu, Ag | N₂O | H₂ and CO have negligible binding affinity | N₂O: 2 (for surface oxidation) |
| Ni | H₂ | Standard choice for nickel catalysts | H₂: 2 |
Factors Influencing Saturation Capacity Measurements
Several methodological considerations can impact the accuracy and reproducibility of saturation capacity determinations:
- Temperature Control: Adsorption isotherms and stoichiometry are temperature-dependent; maintain stable analysis temperature [50].
- Reduction Conditions: Incomplete reduction of metal oxides leads to underestimated active surface area; optimize temperature and duration [50].
- Support Interference: Carbon supports may significantly adsorb hydrogen, leading to inaccurate measurements; select appropriate probe gas [50].
- Pulse Size and Frequency: Very large pulses may not allow complete adsorption; optimize pulse size to ensure equilibrium in each dose [50].
Pulse chemisorption provides a robust and reproducible method for determining catalyst saturation capacity, metal dispersion, and active metallic surface area. The technique's reliance on specific chemical interactions differentiates it from physisorption methods and provides more relevant data for predicting catalytic performance in reactive environments. The detailed protocols and case studies presented herein demonstrate that proper selection of probe gases, careful experimental execution, and appropriate data interpretation are essential for obtaining accurate catalyst characterization data. When implemented within a comprehensive research methodology for physisorption and chemisorption measurements, pulse chemisorption serves as an indispensable tool for advancing catalyst development and optimization.
Temperature-Programmed Techniques represent a cornerstone of modern surface science and catalysis research, providing critical insights into the interactions between gases and solid surfaces. These techniques are indispensable for characterizing catalysts, adsorbents, and various functional materials within the broader context of physisorption and chemisorption measurement methods. As research advances toward more complex and efficient material systems, precise understanding of surface properties—including active site distribution, redox behavior, and adsorption/desorption kinetics—has become increasingly crucial. Temperature-Programmed Desorption (TPD), Reduction (TPR), and Oxidation (TPO) form a powerful suite of characterization methods that reveal these fundamental properties under controlled thermal conditions, enabling researchers to establish critical structure-activity relationships essential for catalyst design and optimization [13].
The significance of these techniques extends across multiple disciplines, from heterogeneous catalysis and energy storage to environmental science and pharmaceutical development. For catalysis researchers specifically, TPD, TPR, and TPO provide actionable data on active site concentration, strength, and accessibility—parameters that directly govern catalytic performance, selectivity, and durability. The integration of these methods with complementary characterization approaches allows for comprehensive material assessment, bridging the gap between fundamental surface properties and practical application performance [55] [56] [57].
Theoretical Foundations
Fundamental Principles
Temperature-Programmed Techniques share a common operational principle: monitoring a specific process while applying a controlled temperature ramp to a sample. The resulting profiles contain rich information about surface reactivity, kinetics, and mechanism. The temperature at which events occur indicates the strength of interactions, while the quantity of consumed or released gases provides quantitative data on active site densities.
In TPD, pre-adsorbed molecules desorb from specific surface sites as temperature increases, revealing information about adsorption strength, surface heterogeneity, and desorption kinetics. TPR profiles the reduction of metal oxides by tracking hydrogen consumption, providing insights into oxide reducibility, metal-support interactions, and the presence of multiple reducible species. Conversely, TPO monitors oxygen consumption during oxidation processes, valuable for studying carbon deposition, catalyst regeneration, and oxidation catalysis [32] [58].
The interpretation of these profiles relies on mathematical analysis of peak positions, shapes, and areas. For TPD, the Polanyi-Wigner equation describes the desorption rate as a function of surface coverage, temperature, and activation energy for desorption. In TPR/TPO, quantitative analysis of peak areas directly correlates with the amount of reducible/oxidizable species, while temperature maxima reflect the relative ease of these processes.
Distinguishing Chemisorption and Physisorption
Understanding the distinction between chemisorption and physisorption is fundamental to interpreting temperature-programmed experiments. These differ significantly in binding energy, specificity, and temperature range of occurrence, which directly influences their characterization using thermal techniques.
Table 1: Characteristics of Physisorption and Chemisorption
| Property | Physisorption | Chemisorption |
|---|---|---|
| Binding Energy | Weak (5-50 kJ/mol) | Strong (40-800 kJ/mol) |
| Specificity | Non-specific | Highly specific to chemical composition |
| Temperature Range | Low temperatures (often < 150K) | Can occur at much higher temperatures |
| Reversibility | Fully reversible | Often irreversible or partially reversible |
| Role in TPD | Appears as low-temperature peaks | Appears as high-temperature peaks |
Physisorption involves weak van der Waals forces and typically occurs at low temperatures, often manifesting as low-temperature peaks in TPD spectra. Chemisorption involves the formation of stronger chemical bonds and is highly specific to surface chemical composition, appearing as higher-temperature events in thermal profiles [13]. This distinction is critically important in catalysis research, as chemisorption typically occurs at active sites responsible for catalytic activity, while physisorption is more relevant to separation processes and material texture characterization.
Technique Specifications and Applications
Temperature-Programmed Desorption (TPD)
TPD investigates the interaction strength between adsorbates and surfaces by monitoring desorption products during controlled heating. The technique reveals information about surface heterogeneity, active site distribution, and desorption kinetics. Recent studies demonstrate TPD's versatility in characterizing both acidic/basic and metallic sites through probe molecules including NH₃, CO₂, NO, and CO [13] [58].
In catalytic applications, TPD provides critical insights into reaction mechanisms and active site characterization. For instance, MBY-TPD (2-methyl-3-butyn-2-ol temperature-programmed desorption) has been employed to study Ni/TiO₂ catalysts for alkynol semi-hydrogenation, revealing adsorption characteristics directly correlated with catalytic performance [57]. Similarly, O₂-TPD has proven valuable for characterizing oxygen vacancy formation and lattice oxygen mobility in Pt@MnO₂ catalysts for VOC oxidation, where the release of lattice oxygen at specific temperatures directly influences catalytic activity [55].
Table 2: Common Probe Molecules and Applications in TPD
| Probe Molecule | Surface Property Analyzed | Representative Application |
|---|---|---|
| NH₃ | Acid site strength and distribution | Zeolite acidity characterization |
| CO₂ | Basic site strength and distribution | Basic catalyst characterization |
| CO | Metal surface sites | Metal dispersion and coordination |
| O₂ | Oxygen vacancies and lattice oxygen mobility | Transition metal oxide catalysts [55] |
| Specific reactants | Reactant adsorption/desorption behavior | MBY adsorption on Ni/TiO₂ [57] |
Temperature-Programmed Reduction (TPR)
TPR profiles the reduction behavior of catalytic materials by monitoring hydrogen consumption during temperature ramping. The technique is particularly valuable for characterizing metal oxide systems, quantifying reducible species, identifying multiple reduction events, and probing metal-support interactions. TPR profiles provide fingerprints of reduction processes, with peak temperatures indicating reduction ease and peak areas corresponding to reducible species quantity.
H₂-TPR has been instrumental in elucidating the reduction characteristics of promoted inverse ZrO₂/Ni catalysts for CO₂ methanation. In these systems, yttrium promotion significantly modifies reduction profiles, lowering reduction temperatures and enhancing reducibility—key factors in optimizing catalytic performance [56]. Similarly, H₂-TPR analysis of Pt@MnO₂ catalysts has revealed how MnO₂ crystal phase affects redox properties, with Pt@Mn[δ] exhibiting promoted redox cycles crucial for photothermal catalytic activity [55].
The information derived from TPR extends beyond mere reducibility assessment. shifts in reduction temperatures indicate strong metal-support interactions, while changes in peak profiles suggest structural modifications or promoter effects. These insights are invaluable for designing reduction protocols and understanding catalyst activation processes.
Temperature-Programmed Oxidation (TPO)
TPO monitors oxygen consumption during temperature-programmed oxidation processes, providing critical information about carbon deposition, catalyst regeneration, and oxidation catalysis. The technique is particularly valuable for studying catalyst deactivation by coking, quantifying carbonaceous deposits, and determining optimal regeneration conditions.
In environmental catalysis applications, TPO helps characterize soot oxidation catalysts, where the technique identifies temperature windows for efficient particulate matter removal. The method also finds application in studying metal oxidation states and their transformations under oxidizing conditions, complementing the information obtained from TPR studies under reducing atmospheres.
While the specific search results don't provide detailed TPO applications, the technique is often coupled with TPD and TPR in comprehensive catalyst characterization systems like the Micromeritics 3Flex, which integrates all three techniques for complete redox characterization [32]. This multi-technique approach provides a holistic view of material behavior under various atmospheric conditions.
Experimental Protocols
General Workflow and Instrumentation
The following diagram illustrates the generalized workflow for temperature-programmed analysis, highlighting the common steps and decision points across TPD, TPR, and TPO techniques:
Modern instrumentation for temperature-programmed analysis has evolved significantly, with integrated systems like the Micromeritics 3Flex providing comprehensive capabilities for physisorption, chemisorption, and temperature-programmed methods. This advanced system features three parallel analysis ports, ultra-high sensitivity transducers (0.1 torr), and temperature programming up to 1100°C with precise control (±1°C) [32]. The integration of thermal conductivity detectors (TCD) enables dynamic chemisorption measurements including TPR, TPO, and TPD, while automated gas handling systems with up to sixteen gas inlets facilitate complex experimental sequences without manual intervention.
Detailed TPD Protocol for Acid-Base Characterization
Objective: Determine acid/base site distribution and strength on catalyst surfaces using NH₃ and CO₂ as probe molecules.
Materials and Equipment:
- Micromeritics 3Flex or similar adsorption analyzer with TCD
- High-purity NH₃ (for acid sites) and CO₂ (for basic sites)
- Quartz U-tube sample cell
- High-vacuum system (<10⁻⁶ torr)
- Mass flow controllers for precise gas dosing
Procedure:
- Sample Preparation: Load 50-200 mg of catalyst powder into quartz cell. Secure with quartz wool.
- Pretreatment: Activate sample in situ under helium flow (30 mL/min) with temperature ramp (10°C/min) to 500°C, hold for 2 hours.
- Adsorption: Cool to 100°C under helium. Expose to 5% NH₃/He (acid sites) or 5% CO₂/He (basic sites) for 30 minutes.
- Purge: Flush with helium (50 mL/min) for 1-2 hours to remove physisorbed species.
- Desorption: Program temperature ramp (typically 10°C/min) to 800°C under helium flow (30 mL/min).
- Detection: Monitor desorbed species with TCD and/or mass spectrometer.
- Quantification: Integrate peak areas and calibrate with standard gas pulses.
Critical Parameters:
- Heating rate significantly affects resolution (typically 5-20°C/min)
- Sample mass must be optimized to avoid mass transfer limitations
- Flow rate must provide adequate purge without causing premature desorption
Detailed TPR Protocol for Metal Oxide Reduction Studies
Objective: Characterize reduction behavior of metal oxide catalysts and determine reducible species concentration.
Materials and Equipment:
- TPR system with TCD and cryogenic trap (remove water)
- 5% H₂/Ar mixture (reducing gas)
- High-purity argon (purge gas)
- Cold trap (isopropanol/liquid nitrogen)
Procedure:
- Sample Preparation: Load 50 mg catalyst in quartz reactor.
- Pretreatment: Oxidize in 5% O₂/He at 500°C for 1 hour, then cool to 50°C under argon.
- Stabilization: Flow 5% H₂/Ar (30 mL/min) through bypass until stable baseline.
- Reduction: Switch gas flow through sample, initiate temperature ramp (5-10°C/min) to 900°C.
- Detection: Monitor H₂ consumption with TCD, using cold trap to remove water.
- Calibration: Inject known H₂ pulses for quantitative analysis.
Data Interpretation:
- Peak temperature indicates reduction ease (lower temperature = easier reduction)
- Peak area corresponds to total H₂ consumption, quantifying reducible species
- Multiple peaks suggest sequential reduction of different species or influenced by particle size
Advanced Integration: Coupled Techniques
Advanced characterization often involves coupling multiple temperature-programmed techniques with complementary methods. The autoSKZCAM computational framework represents a significant advancement, combining multilevel embedding approaches with correlated wavefunction theory to predict adsorption enthalpies with experimental accuracy [59]. This integration of theoretical and experimental approaches provides atomic-level insights into surface processes, resolving debates about adsorption configurations that single techniques cannot address definitively.
Research Reagent Solutions and Materials
Successful temperature-programmed analysis requires carefully selected materials and reagents optimized for specific applications. The following table details essential components and their functions in typical experimental setups.
Table 3: Essential Research Reagents and Materials for Temperature-Programmed Analysis
| Category | Specific Examples | Function/Purpose |
|---|---|---|
| Probe Gases | 5% H₂/Ar (TPR), 5% O₂/He (TPO), NH₃, CO₂ (TPD) | Selective interaction with specific surface sites |
| Catalyst Supports | TiO₂ (anatase, rutile), MnO₂ (α, β, γ, δ), ZrO₂ | Structural and electronic promotion of active phases [55] [57] |
| Active Metals | Pt, Ni, Pd, promoted systems (Y, La, Sr, Pr) | Primary catalytic active sites [55] [56] |
| Instrumentation | Micromeritics 3Flex, Mass Spectrometers, TCD | Detection and quantification of gas consumption/evolution [32] |
| Sample Containers | Quartz U-tubes, high-temperature reactors | Inert environment for high-temperature treatments |
The choice of support material significantly influences temperature-programmed profiles, as demonstrated by the profound effect of MnO₂ crystal phase (α, β, γ, δ) on TPD and TPR profiles in Pt@MnO₂ catalysts [55]. Similarly, TiO₂ phase (anatase vs. rutile) substantially alters TPR profiles and reduction characteristics in Ni/TiO₂ catalysts [57]. These support effects originate from differences in specific surface area, defect concentration, and metal-support interactions that modify redox properties and adsorption characteristics.
Data Interpretation and Analysis
Quantitative Analysis Methods
Extracting meaningful quantitative information from temperature-programmed experiments requires sophisticated analysis approaches. For TPD, activation energies for desorption can be determined using the Redhead method, which relates peak temperature to desorption energy at constant heating rate. More advanced analysis involves modeling entire desorption traces to extract coverage-dependent kinetic parameters.
In TPR/TPO, quantitative analysis begins with careful calibration of detector response using standard gas pulses. The total consumption is obtained by integrating peak areas after baseline correction. For complex profiles with overlapping peaks, deconvolution methods are employed to resolve individual reduction/oxidation events corresponding to distinct species.
The Micromeritics 3Flex software suite includes advanced analysis capabilities including peak integration, deconvolution, and calculation of active surface area, crystallite size, and dispersion [32]. These automated tools facilitate rapid comparison of multiple samples and ensure consistency in data processing.
Correlation with Catalytic Performance
The ultimate value of temperature-programmed techniques lies in their ability to predict and explain catalytic performance. Strong correlations exist between TPD/TPR/TPO parameters and catalytic activity/selectivity. For example, in CO₂ methanation over inverse ZrO₂/Ni catalysts, TPR profiles reveal how yttrium promotion enhances reducibility, while CO₂-TPD identifies increased medium-strength basic sites—both factors contributing to superior catalytic performance [56].
Similarly, in Pt@MnO₂ catalysts for VOC oxidation, O₂-TPD demonstrates enhanced lattice oxygen mobility in the δ-phase, which facilitates oxidation following the Mars-van Krevelen mechanism [55]. These correlations enable rational catalyst design by identifying optimal characterization parameters that predict high performance.
Emerging approaches combine experimental temperature-programmed data with computational modeling, as demonstrated by the autoSKZCAM framework, which achieves CCSD(T)-level accuracy in predicting adsorption enthalpies [59]. This integration of computation and experiment provides unprecedented atomic-level understanding of surface processes, resolving long-standing debates about adsorption configurations and enabling truly predictive catalyst design.
Temperature-Programmed Techniques remain indispensable tools in the surface scientist's arsenal, providing critical insights into adsorption, redox processes, and catalytic mechanisms. As instrumentation advances and computational methods become increasingly integrated with experimental approaches, these techniques continue to evolve, offering ever-deeper understanding of surface chemical processes. The ongoing development of automated systems, standardized protocols, and sophisticated data analysis methods ensures that TPD, TPR, and TPO will maintain their central role in catalysis research, materials science, and pharmaceutical development for the foreseeable future.
Physisorption and chemisorption are fundamental processes where molecules (adsorbates) accumulate on a solid surface (adsorbent). The distinction between these mechanisms dictates their applications across diverse scientific and industrial fields. Physisorption is a physical process driven by weak van der Waals forces, resulting in low adsorption enthalpies (typically 20-40 kJ/mol, often less than 80 kJ/mol) [60] [61]. This process is reversible, non-specific, can form multilayers, and occurs rapidly at low temperatures without an activation energy barrier [61]. It is predominantly used for characterizing surface area and porosity.
In contrast, chemisorption involves the formation of strong chemical bonds (covalent or ionic) between the adsorbate and specific active sites on the adsorbent surface [60] [62]. The enthalpy of chemisorption is significantly higher (typically around 200 kJ/mol), making the process often irreversible and specific to particular surface sites [62]. Chemisorption typically results in a monolayer of adsorbed molecules, may involve bond dissociation in the adsorbate, and plays a crucial role in processes like heterogeneous catalysis [60] [62]. The following table summarizes the key differences between these two fundamental mechanisms.
Table 1: Fundamental Characteristics of Physisorption and Chemisorption
| Characteristic | Physisorption | Chemisorption |
|---|---|---|
| Binding Forces | Weak van der Waals forces [61] | Strong chemical bonds (covalent/ionic) [60] |
| Enthalpy (ΔH) | Low (≈20–80 kJ/mol) [61] | High (≈200 kJ/mol) [62] |
| Reversibility | Reversible [61] | Often irreversible [60] |
| Specificity | Non-specific | Highly specific to active sites [62] |
| Layer Formation | Multilayer possible [61] | Typically monolayer [60] |
| Temperature Dependence | Occurs at lower temperatures [61] | Can require higher temperatures |
Application Note 1: Catalyst Development and Characterization
Protocol: Chemisorption for Active Site Quantification
Principle: Probe molecules (e.g., CO, H₂, NH₃) selectively chemisorb to metallic or acidic/basic active sites on catalyst surfaces. Measuring the volume of gas adsorbed allows for quantification of active site density, metal dispersion, and metal surface area [62] [13].
Materials & Equipment:
- Analytical Instrument: High-precision gas adsorption analyzer (e.g., Micromeritics 3Flex or ASAP 2020) capable of static chemisorption measurements [14] [13].
- Gases: High-purity (>99.99%) probe gases (e.g., H₂ for metal sites, CO₂ for basic sites, NH₃ for acidic sites) and an inert carrier gas (e.g., He, Ar) [13].
- Sample: Catalyst powder (50-200 mg).
- Accessories: High-vacuum system, sample preparation manifold, analysis tubes.
Procedure:
- Sample Preparation: Weigh an appropriate amount of catalyst into a clean, dry analysis tube. Secure the tube in the preparation port.
- Pre-Treatment (In-situ Activation): Subject the catalyst to a temperature-programmed pre-treatment under a flow of inert gas or vacuum to remove moisture and contaminants. Common conditions involve heating to 300-500°C for 1-2 hours [13]. This step is critical to expose clean active sites.
- Reduction (for Metal Catalysts): If characterizing supported metal catalysts, reduce the sample under a flow of H₂ at a specified temperature and duration (e.g., 400°C for 4 hours) to convert metal oxides to their active metallic state.
- Evacuation and Cooling: Evacuate the system under high vacuum to remove any physisorbed species. Cool the sample to the analysis temperature (typically 35°C for H₂ chemisorption).
- Pulse Chemisorption: a. Introduce small, calibrated pulses of the probe gas into the carrier gas stream flowing over the catalyst. b. Monitor the detector signal (e.g., TCD) after each pulse. The active sites will adsorb the probe gas until saturation. c. The process is complete when two consecutive pulses show identical peak areas, indicating no further adsorption. d. The total volume of chemisorbed gas is calculated from the sum of the adsorbed pulses.
- Data Analysis: Calculate the metal dispersion (%), active metal surface area (m²/g), and average particle size based on the total gas adsorbed, stoichiometry of adsorption, and sample weight.
Diagram 1: Pulse chemisorption workflow
Key Data and Applications
Chemisorption is a cornerstone technique in catalysis research and industrial quality control for petroleum refining, biofuel production, and environmental catalysis [62] [13]. It provides quantitative data essential for understanding catalyst structure-property relationships.
Table 2: Key Quantitative Metrics from Catalyst Chemisorption Analysis
| Metric | Description | Calculation Basis | Application Significance |
|---|---|---|---|
| Metal Dispersion (%) | Fraction of metal atoms exposed on the surface [13] | (Atoms on Surface / Total Atoms) × 100 | Correlates with catalytic activity and efficiency. |
| Active Metal Surface Area (m²/g) | Total surface area of active metal per gram of catalyst [13] | (Atoms on Surface × Cross-sectional Area) | Directly related to the number of available reaction sites. |
| Average Crystallite Size (nm) | Estimated size of metal particles. | Assumes a particle geometry (e.g., spherical). | Links dispersion to physical nanostructure; affects stability. |
Application Note 2: Gas Storage and Separation
Protocol: Physisorption for Hydrogen Storage Capacity
Principle: Porous materials with high surface areas, such as Metal-Organic Frameworks (MOFs) and activated carbons, physisorb H₂ molecules via van der Waals forces at cryogenic temperatures (e.g., -196°C). High-pressure gas adsorption analyzers measure the excess adsorption capacity to evaluate storage potential [61] [63].
Materials & Equipment:
- Analytical Instrument: High-pressure gas sorption analyzer (e.g., Micromeritics ASAP 2060 or 3Flex) rated for pressures relevant to H₂ storage (e.g., up to 200 bar) [14].
- Gases: Ultra-high purity (UHP) Hydrogen (H₂) and Helium (He).
- Sample: Porous adsorbent (e.g., MOF, activated carbon; ~1 g).
- Accessories: Cryostat (for maintaining 77 K with liquid N₂), high-pressure sample cell, vacuum system.
Procedure:
- Sample Activation: Weigh the adsorbent into a high-pressure sample cell. Activate the sample in-situ by heating under dynamic vacuum (e.g., 150-300°C for several hours) to remove all solvent and guest molecules from the pores. Proper activation is critical for achieving maximum capacity.
- Free Space Measurement: Cool the sample to the analysis temperature (77 K). Introduce a known amount of non-adsorbing helium gas to measure the dead volume (free space) of the sample cell.
- High-Pressure Isotherm Measurement: a. After evacuating the He, introduce precise doses of H₂ gas into the sample cell at a controlled temperature (77 K). b. For each dose, allow the system to reach equilibrium and record the equilibrium pressure and quantity of H₂ adsorbed. c. Repeat this process, incrementally increasing the pressure up to the target maximum (e.g., 200 bar). d. The instrument software calculates the absolute or excess adsorption based on the dose pressure, system volumes, and the previously determined free space.
- Data Analysis: Plot the adsorption isotherm (quantity adsorbed vs. pressure). The total hydrogen storage capacity is typically reported as gravimetric uptake (wt%) at a specific pressure, often 1 bar and a high pressure (e.g., 100 bar).
Diagram 2: Physisorption for gas storage
Key Data and Applications
Physisorption is vital for developing advanced energy storage systems, including hydrogen storage for fuel cells and methane storage for vehicular fuel [61] [63]. The performance is directly linked to the textural properties of the adsorbent, which are also characterized by physisorption (e.g., using N₂ at 77 K).
Table 3: Physisorption-Based Characterization of Porous Materials for Gas Storage
| Material | Typical Surface Area (BET, m²/g) | Pore Characteristics | H₂ Storage Mechanism & Performance |
|---|---|---|---|
| Activated Carbon | Up to 3000 [61] | Micropores, broad PSD | Physisorption in micropores; high capacity at cryogenic T. |
| Metal-Organic Frameworks (MOFs) | Exceptionally high [61] | Tunable pore size/chemistry | Physisorption; high surface area enables high volumetric capacity [61]. |
| Zeolites | Moderate-High [61] | Crystalline, uniform micropores | Physisorption; selectivity based on molecular sieving. |
Emerging Platform: Porous Liquids (PLs): A recent innovation involves creating Porous Liquids (PLs)—fluids containing permanent, well-defined pores. These materials combine the fluidity of liquids with the selective adsorption properties of solids, offering a promising platform for integrated gas storage and catalytic transformation by overcoming solubility and mass transfer limitations [64].
Application Note 3: Drug Delivery Systems
Protocol: Batch Adsorption for Drug Loading in Mesoporous Carriers
Principle: Drug molecules are loaded into porous carriers via adsorption from a solution. Interactions can range from physisorption (e.g., electrostatic, van der Waals) to chemisorption (e.g., complexation). Kinetic and isotherm studies determine the optimal loading conditions and mechanism [65].
Materials & Equipment:
- Adsorbent: Mesoporous carrier (e.g., Mesoporous Silica Nanococoons (MSNCs), MgO-doped MSNCs) [65].
- Adsorbate: Drug of interest (e.g., Indomethacin (IMC) as a model acidic drug).
- Solvent: Appropriate solvent (e.g., methanol, buffer).
- Equipment: Temperature-controlled shaker/incubator, centrifuge, UV-Vis spectrophotometer (or HPLC), microcentrifuge tubes.
Procedure:
- Preparation of Stock Solutions: Prepare a concentrated stock solution of the drug in a suitable solvent. Prepare serial dilutions for isotherm studies.
- Batch Adsorption Experiment: a. Pre-weigh a fixed mass of the porous carrier (e.g., 10 mg) into a series of microcentrifuge tubes. b. Add a fixed volume (e.g., 2 mL) of the drug solution at varying initial concentrations to each tube. c. Seal the tubes to prevent solvent evaporation and place them in a temperature-controlled shaker. d. Agitate at a constant speed for a predetermined time or until equilibrium is reached. Sample at specific time intervals (e.g., 0, 10, 20, 30, 45, 60, 120, 180, 240 min) for kinetic studies [65].
- Separation and Analysis: a. At each time point (kinetics) or after equilibrium (isotherm), centrifuge the tubes to separate the solid carrier from the solution. b. Analyze the concentration of the drug remaining in the supernatant using UV-Vis spectrophotometry (or HPLC). c. The amount of drug adsorbed per gram of carrier at time t, q_t (mg/g), is calculated as: q_t = (C₀ - Cₜ) * V / m, where C₀ and Cₜ are the initial and time t concentrations (mg/L), V is the solution volume (L), and m is the mass of adsorbent (g).
- Data Modeling: a. Kinetics: Fit data to pseudo-first-order and pseudo-second-order models. A better fit to the pseudo-second-order model suggests chemisorption is involved [65]. b. Isotherms: Fit equilibrium data to Langmuir (homogeneous monolayer) and Freundlich (heterogeneous surface) models. The Temkin isotherm can provide further support for chemisorption [65].
Diagram 3: Drug loading via batch adsorption
Key Data and Applications
The controlled loading and release of drugs from inorganic carriers like mesoporous silica depend heavily on surface interactions. Modifying the carrier's surface chemistry can shift the dominant mechanism and optimize performance.
Table 4: Adsorption Mechanisms and Outcomes in Drug Delivery
| Carrier System | Dominant Adsorption Mechanism | Evidence & Characterization | Outcome for Drug Delivery |
|---|---|---|---|
| MSNCs | Predominantly Physisorption | Fit to Freundlich isotherm (heterogeneous surface) [65]. | Standard loading and release profile. |
| MgO-MSNCs | Chemisorption (Complexation) | Fit to pseudo-second-order kinetics and Temkin isotherm; FTIR for bond analysis [65]. | Enhanced loading for acidic drugs; adjustable, sustained release rate [65]. |
The Scientist's Toolkit: Essential Research Reagents and Materials
Table 5: Key Reagents and Materials for Adsorption Studies
| Item | Function/Application | Examples & Notes |
|---|---|---|
| Probe Gases | Selective characterization of surface properties. | N₂ (77 K): BET surface area, physisorption isotherms. Kr: Low surface area materials. CO/H₂: Metal site chemisorption. NH₃/CO₂: Acid/base site chemisorption [14] [13]. |
| Porous Host Materials | High-surface-area substrates for adsorption. | MOFs/COFs: Tunable pores for gas storage [61]. Zeolites: Molecular sieving. Mesoporous Silica (SBA-15, MCM-41): Drug delivery, catalyst support [65]. Activated Carbon: Broad-use adsorbent. |
| Porous Liquids (PLs) | Emerging platform combining fluidity and permanent porosity. | Types I-IV: Integrate porous hosts (MOFs, zeolites, porous cages) with liquid phases (ionic liquids, bulky solvents) for combined gas storage and catalysis [64]. |
| Analytical Instruments | Quantification of adsorbed volumes and surface properties. | Gas Sorption Analyzers: (e.g., Micromeritics 3Flex, ASAP 2020, TriStar) for surface area, porosity, chemisorption [14]. Quadrupole Mass Spectrometers: (e.g., Hiden Analytical) for temperature-programmed reaction studies [62]. |
Optimizing Adsorption Experiments: Sample Preparation and Data Integrity
Selecting the Right Probe Molecule and Experimental Conditions
The precise characterization of solid-state materials, such as catalysts and adsorbents, is paramount in numerous industrial and research applications, from chemical synthesis to environmental technology. Chemical adsorption (chemisorption) is a surface-specific analytical technique wherein a gas or vapor molecule (the adsorptive) forms a strong, localized chemical bond with a solid surface (the adsorbent), resulting in a surface complex or compound [48] [66]. This process is characterized by high binding energies, typically in the range of 200–800 kJ/mol, and is often irreversible under standard conditions [66]. Unlike physisorption, which involves weak, non-specific van der Waals forces and can form multiple molecular layers, chemisorption is highly selective and typically results in a monomolecular layer [48] [67]. This specificity makes chemisorption an indispensable tool for probing the number, strength, and distribution of active sites on a material's surface—properties that directly dictate performance in catalytic reactions and separation processes [13] [48].
The core principle of this methodology is the selective interaction between a carefully chosen probe molecule and the specific active sites on the material's surface. The probe molecule acts as a molecular ruler, quantitatively measuring surface properties such as metallic dispersion, active metal surface area, and acidic or basic site density [13]. The selection of an appropriate probe is therefore critical; it must form a stoichiometric and selective bond with the target active site. Common examples include carbon monoxide (CO) for metallic sites and ammonia (NH₃) for acidic sites. The subsequent sections of this application note provide a detailed framework for selecting optimal probe molecules and implementing robust experimental protocols to extract accurate and meaningful surface characterization data.
Core Principles: Physisorption vs. Chemisorption
A clear understanding of the distinctions between physisorption and chemisorption is a prerequisite for designing effective characterization experiments. The fundamental differences between these two phenomena govern their respective applications, the nature of the information they provide, and the experimental conditions required.
Table 1: Key Differences Between Physisorption and Chemisorption
| Characteristic | Physisorption | Chemisorption |
|---|---|---|
| Binding Forces | Weak van der Waals forces [48] [66] | Strong chemical bonds (covalent/ionic) [48] [66] |
| Binding Energy | Low (typically < 100 kJ/mol) [66] | High (typically 200–800 kJ/mol) [66] |
| Selectivity | Non-specific, occurs on all surfaces [48] | Highly selective to specific adsorbent-adsorptive pairs [48] [66] |
| Reversibility | Fully reversible [48] [66] | Often irreversible or difficult to reverse [66] |
| Layer Formation | Multi-layer adsorption possible [48] [66] | Limited to a mono-layer [48] [66] |
| Temperature Dependence | Occurs at lower temperatures, decreases with temperature [48] | May require elevated temperatures, can increase with temperature [48] [66] |
| Primary Application | Measurement of total surface area, pore volume, and pore size distribution [48] | Characterization of active sites (e.g., metallic, acidic, basic) [13] [48] |
The potential energy diagram for an adsorbate approaching a surface provides a visual representation of these differences. Physisorption is characterized by a shallow minimum at a larger distance from the surface, with no activation energy barrier. In contrast, chemisorption features a deep, short-range potential well, and in many cases, a significant activation energy barrier must be overcome for the reaction to proceed [67]. In practice, both processes can occur simultaneously. For instance, a molecule may first physisorb, followed by chemisorption, or a chemisorbed layer may have subsequent physisorbed layers on top of it [48] [68]. Advanced studies, such as those on alcohol adsorption on iron oxide, explicitly model and quantify both contributions to the overall adsorption isotherm [68].
Figure 1: Potential energy curves for physisorption and chemisorption. The physisorption path shows a shallow, long-range well, while the chemisorption path has a deeper, short-range well and may involve an activation energy barrier (Eₐ). The equilibrium distances for physisorbed and chemisorbed species are d_ph and d_ch, respectively [67].
Probe Molecule Selection Guide
The choice of probe molecule is the most critical parameter in a chemisorption experiment. The probe must be selectively and stoichiometrically reactive with the specific surface site of interest. An inappropriate choice will yield data that does not accurately represent the material's true surface properties.
Table 2: Common Probe Molecules for Surface Characterization
| Target Active Site | Recommended Probe Molecules | Interaction Mechanism | Key Applications & Notes |
|---|---|---|---|
| Metallic Sites | Carbon Monoxide (CO) [48] | Coordination bond via carbon atom to metal sites [66] | Determination of metal dispersion and active metal surface area [48]. |
| Hydrogen (H₂) [48] | Dissociative chemisorption on metals like Pt, Pd, Fe [66] | Requires a surface capable of breaking the H-H bond. Used for metal surface area calculation [48]. | |
| Oxygen (O₂) | Uptake or titration | Often used in pulse chemisorption for supported metal catalysts. | |
| Acidic Sites | Ammonia (NH₃) [13] | Coordinates to Lewis acid sites; protonates on Brønsted acid sites [13] | Temperature-Programmed Desorption (TPD) to quantify acid site density and strength distribution [13]. |
| Pyridine | Coordinates to Lewis acid sites via nitrogen lone pair | IR spectroscopy allows distinction between Lewis and Brønsted acidity. | |
| Basic Sites | Carbon Dioxide (CO₂) [25] | Interacts with surface hydroxyls or oxygen anions | TPD to quantify basic site density and strength. |
| Sulfur Dioxide (SO₂) | Acid-base interaction | Less common than CO₂ for basicity measurements. | |
| Dual-Functional / Special Cases | Methyl Iodide (CH₃I) [21] | N-methylation chemisorption on N-rich frameworks (e.g., COFs) [21] | Radioactive iodine capture; synergistic physico-chemisorption mechanism [21]. |
| Hydrogen Sulfide (H₂S) [69] | Coordination to unsaturated metal sites (e.g., Ti⁴⁺, Zn²⁺) [69] | Gas purification; often involves both chemisorption and physisorption in materials like MOFs [69]. |
When selecting a probe, several additional factors must be considered. The molecular size of the probe must allow access to the active sites within the material's pore structure; a bulky molecule cannot access micropores or small mesopores, leading to an underestimation of active sites [48]. The probe must also be sufficiently reactive to form a bond under the chosen experimental conditions, but not so reactive that it causes irreversible degradation of the sample material. Furthermore, the assumed stoichiometry between the probe molecule and the active site (e.g., CO:Metal atom ratio) is a fundamental parameter for quantitative calculations and should be based on well-established literature for the specific material system under investigation [48].
Experimental Protocols and Methodologies
Robust experimental protocols are essential for generating reliable and reproducible chemisorption data. The following sections detail two primary analytical techniques and a suite of temperature-programmed methods.
Static Volumetric Chemisorption
The static volumetric method, conducted in a closed system, is the standard technique for obtaining high-resolution chemisorption isotherms and is highly recommended for calculating metal dispersion and active metal surface area.
Protocol: Static Volumetric Chemisorption with CO or H₂
- Sample Preparation (~100-500 mg): Weigh an appropriate amount of catalyst or adsorbent into a known-weight sample tube.
- Sample Pre-treatment (In-situ Activation): Subject the sample to a specific pre-treatment to create a clean, well-defined surface. This typically involves:
- Heating to a defined temperature (e.g., 150-500°C) under a flow of inert gas (e.g., He) or vacuum to remove physisorbed water and contaminants.
- Reduction/Oxidation: For metal catalysts, reduce the sample in a flow of H₂ (e.g., 5% H₂/Ar) at a specified temperature and duration (e.g., 350°C for 2 hours) to convert metal oxides to the active metallic state [48].
- Evacuation: Cool to the analysis temperature (e.g., 35°C) under high vacuum (< 10⁻⁵ mbar) to remove any pre-treatment gases.
- Dosing and Equilibrium: Introduce small, precise doses of the pure probe gas (e.g., CO, H₂) into the calibrated sample volume. After each dose, allow the system to reach pressure equilibrium. The quantity of gas adsorbed is calculated from the pressure drop using the ideal gas law [48].
- Isotherm Construction: Repeat the dosing process until no further adsorption is detected, indicating surface saturation. Plot the volume of gas adsorbed (at STP) against the equilibrium pressure to construct the chemisorption isotherm.
- Evacuation and Second Isotherm: After saturation, evacuate the system at the analysis temperature for a fixed period (e.g., 30-60 minutes) to remove only the physisorbed molecules. A second isotherm is then measured, which represents reversible physisorption.
- Data Analysis: Subtract the second isotherm (physisorption) from the first isotherm (total adsorption) to obtain the chemisorption isotherm. The monolayer capacity is typically determined from the knee-point of this isotherm or by applying the Langmuir model [48].
Dynamic Flow (Pulse) Chemisorption
The dynamic flow technique operates at ambient pressure and is faster and simpler than the volumetric method. It is ideal for quality control and rapid screening of catalyst materials.
Protocol: Dynamic Pulse Chemisorption with CO or H₂
- Sample Preparation and Pre-treatment: As described in the volumetric protocol (Steps 1 & 2). The sample is typically pre-treated in-situ within a U-shaped quartz tube.
- Carrier Gas Stabilization: After pre-treatment and cooling to the analysis temperature under an inert gas (e.g., He), switch to a dedicated carrier gas stream (e.g., He) and allow the thermal conductivity detector (TCD) signal to stabilize.
- Pulse Chemisorption: Inject a series of small, calibrated pulses of the probe gas (e.g., 5% CO/He) into the carrier gas stream flowing over the sample.
- Detection and Quantification: The TCD downstream of the sample measures the quantity of probe gas in each pulse that was not adsorbed by the sample. The area of each detected peak is compared to the area of a calibration pulse bypassing the sample.
- Saturation and Calculation: Continue pulsing until the TCD signal for two consecutive peaks is identical, indicating that the sample is saturated and no further chemisorption is occurring. The total chemisorbed gas volume is the sum of the gas adsorbed from each pulse [48].
Temperature-Programmed Techniques
Temperature-Programmed (TP) techniques provide insights into the strength and distribution of active sites, as well as the redox properties of materials.
Protocol: Temperature-Programmed Desorption (TPD) of NH₃ or CO₂
- Adsorption: After standard sample pre-treatment, the probe molecule (e.g., NH₃ for acidity, CO₂ for basicity) is adsorbed onto the sample surface at the desired temperature until saturation is achieved.
- Purging: The system is purged with an inert gas (He, Ar) at the adsorption temperature to remove any physisorbed and gas-phase molecules, leaving only the chemisorbed layer.
- Controlled Desorption: The sample temperature is increased linearly (e.g., 10-30°C/min) under a constant flow of inert gas.
- Detection: A TCD (or a mass spectrometer for more complex systems) monitors the desorption rate of the probe molecule as a function of temperature.
- Data Analysis: The resulting TPD profile (desorption rate vs. temperature) reveals the number of distinct active sites (from peak areas) and their relative strength (from peak temperature). Higher desorption temperatures indicate stronger binding sites [48] [15].
Other Common TP Techniques:
- Temperature-Programmed Reduction (TPR): The sample is heated in a flow of dilute H₂ while consumption of H₂ is monitored. Identifies the temperature and hydrogen consumption for the reduction of metal oxides [48] [15].
- Temperature-Programmed Oxidation (TPO): The sample is heated in a flow of dilute O₂ while O₂ consumption (or CO₂ production) is monitored. Used to study catalyst oxidation or to quantify coke deposits on spent catalysts [48] [15].
Figure 2: A generalized workflow for chemisorption analysis, outlining the key steps for sample preparation and the primary analytical pathways.
The Scientist's Toolkit: Key Research Reagents and Materials
A successful chemisorption analysis relies on a suite of specialized reagents, gases, and materials. The following table details the essential components of the experimental toolkit.
Table 3: Essential Research Reagents and Materials for Chemisorption
| Item | Function / Purpose | Examples & Specifications |
|---|---|---|
| Probe Gases | To selectively interact with and quantify specific active sites on the material surface. | Ultra-high purity (≥99.995%) CO, H₂, NH₃, CO₂, O₂. Gas mixtures (e.g., 5% CO/He, 10% H₂/Ar) for pulse chemisorption [48]. |
| Inert / Carrier Gases | To act as a carrier for pulse chemisorption, purge physisorbed species, and provide an inert atmosphere during pre-treatment. | Ultra-high purity (≥99.999%) Helium (He), Argon (Ar), Nitrogen (N₂). Must be free of O₂ and H₂O (< 1 ppm) [48]. |
| Sample Tubes / U-Tubes | To hold the solid sample within the analysis system, capable of withstanding high temperatures and vacuum. | Quartz glass tubes for high-temperature (up to 1000°C) applications in TPR/TPO/TPD [48]. |
| Sample Pretreatment Ovens / Furnaces | To provide controlled high-temperature environments for in-situ sample activation (calcination, reduction). | Tube furnaces with programmable temperature controllers (RT to 1100°C). |
| Reference Materials | To validate instrument performance, calibration, and experimental methodology. | Certified reference materials with known metal dispersion and surface area (e.g., certified Pt/Al₂O³, Ni/SiO₂). |
| Chemisorption Analyzer | The core instrument for performing static, dynamic, and temperature-programmed analyses with high precision and automation. | Commercial systems (e.g., Micromeritics AutoChem III, ChemiSorb Auto) equipped with a vacuum system, dosing manifold, TCD, and software for data analysis [15]. |
Advanced Considerations and Synergistic Mechanisms
Modern material characterization increasingly recognizes the importance of complex adsorption behaviors that go beyond simple models. A significant development is the study of synergistic physico-chemisorption, where both mechanisms operate concurrently or sequentially to enhance capture capacity and selectivity. For example, in metal-organic frameworks (MOFs) used for CO₂ capture, the large surface area and porosity facilitate initial physisorption, while unsaturated metal sites or amine functional groups provide strong, selective chemisorption sites [25]. Similarly, in covalent organic frameworks (COFs) designed for methyl iodide capture, a multi-step mechanism is observed: initial chemisorption via N-methylation creates a modified surface, which then promotes further physisorption of additional CH₃I molecules, leading to record-high uptake capacities [21].
The presence of water vapor in gas streams is another critical practical consideration. Its impact on chemisorption can be dualistic. In some cases, such as with certain amine-functionalized MOFs (e.g., MOF-808-Pas), moisture can dramatically promote the reaction with CO₂, increasing capture capacity by 97% under 50% relative humidity by driving the formation of bicarbonate species [25]. Conversely, water can compete with the target molecule for adsorption sites, reducing efficiency, or even hydrolyze and degrade the adsorbent's structure [25]. Strategies to mitigate this include protecting chemisorption sites with hydrophobic groups, as demonstrated with Boc-protected diamine-MOFs, which maintain performance in humid flue gas streams [25]. These advanced scenarios underscore the necessity of testing probe molecule interactions under conditions that closely mimic the material's intended operational environment.
Addressing Challenges in Sample Preparation and Contamination
Sample preparation is a pivotal stage in the analytical process, serving as the critical bridge between a raw sample and reliable quantitative data. Within research focused on physisorption and chemisorption measurement methods, the challenges of sample preparation and contamination are particularly pronounced, as the surface properties and reactivity of materials are highly sensitive to their environment and history [70]. A fundamental impediment to progress in this area is an underdeveloped understanding of the fundamentals of extraction, especially when dealing with complex natural samples where native analyte-matrix interactions differ significantly from those of spiked standards [70]. This document outlines detailed application notes and protocols designed to help researchers in drug development and material science mitigate these challenges, thereby ensuring the integrity and accuracy of their sorption measurements.
Key Challenges and Fundamental Principles
Optimizing sample preparation parameters often relies on trial and error rather than systematic scientific methodologies [70]. A careful consideration of the underlying principles, however, is essential for creating more efficient and environmentally friendly technologies. The core challenges can be categorized as follows:
- Analyte-Matrix Interactions: The physiochemically complex systems in natural samples present a greater challenge than the simpler models used in separation and quantification steps like chromatography [70]. Native analytes can be strongly bound to the matrix, leading to poor recovery if the extraction method is not designed to overcome these specific interactions.
- Mass Transfer Limitations: The efficiency of any extraction technique is governed by the rate of mass transfer of the analyte from the sample matrix to the extracting phase. Inefficient mass transfer can result in prolonged preparation times and incomplete extraction.
- Contamination and Interference: The introduction of contaminants during sample handling can alter the surface chemistry of a material, leading to erroneous results in subsequent physisorption or chemisorption analyses. This is especially critical when working with trace-level analytes or highly porous materials with large surface areas.
The following workflow diagram illustrates the strategic approach to managing these challenges, from fundamental considerations to final analysis.
Research Reagent and Material Solutions
The selection of appropriate reagents and materials is fundamental to overcoming sample preparation challenges. The following table details key solutions used in advanced sample preparation for sorption studies.
Table 1: Essential Research Reagents and Materials for Sample Preparation
| Item | Primary Function & Application |
|---|---|
| Bimetallic Metal-Organic Frameworks (BMOFs) | Highly promising adsorbents for contaminant removal due to exceptional porosity, tunable structures, and superior stability. Used in solid-phase extraction to pre-concentrate analytes or remove interfering species from sample solutions [71]. |
| Solid-Phase Microextraction (SPME) Fibers | A solvent-free extraction technique that integrates sampling, extraction, concentration, and sample introduction into a single step. Crucial for extracting volatile and semi-volatile compounds while minimizing contamination [70]. |
| Molecularly Imprinted Polymers (MIPs) | Synthetic polymers with tailor-made recognition sites for a specific analyte. Used as highly selective sorbents in solid-phase extraction (SPE) to isolate target analytes from complex matrices, reducing interference [70]. |
| Internal Standard Solutions | Compounds added to the sample in a known constant amount. They are used to correct for variability in sample processing, extraction efficiency, and instrument response, thereby improving quantitative accuracy [70]. |
| High-Purity Solvents & Sorbents | Solvents (e.g., LC-MS grade) and sorbents (e.g., silica, alumina) with minimal impurity levels are critical to prevent the introduction of contaminants that could skew sorption data or damage sensitive instrumentation. |
| Chemical Stabilizers & Antioxidants | Reagents such as ascorbic acid or sodium azide added to sample matrices to prevent analyte degradation, oxidation, or microbial growth during storage and processing, preserving sample integrity. |
Quantitative Comparison of Sample Preparation Techniques
The choice of sample preparation technique significantly impacts the efficiency, cost, and applicability of a method. The table below provides a structured comparison of common techniques relevant to sorption research.
Table 2: Comparison of Common Sample Preparation Techniques
| Technique | Principle | Best For | Typical Recovery Range | Key Challenge |
|---|---|---|---|---|
| Solid-Phase Extraction (SPE) | Analyte adsorption onto a solid sorbent cartridge, followed by washing and elution. | Pre-concentration and clean-up of analytes from liquid samples [70]. | 70-120% (method-dependent) | Sorbent selection and conditioning are critical; can be prone to clogging with dirty samples. |
| Solid-Phase Microextraction (SPME) | Equilibrium partitioning of analytes between the sample and a coated fiber [70]. | Volatile and semi-volatile organic compounds; headspace analysis. | Based on partitioning equilibrium. | Fiber cost and fragility; equilibrium conditions must be carefully controlled. |
| Liquid-Liquid Extraction (LLE) | Partitioning of analytes between two immiscible liquids. | Broad-range applications for extracting organic compounds from aqueous matrices. | 60-100% | Requires large volumes of high-purity solvents; emulsion formation. |
| QuEChERS | Dispersive SPE following acetonitrile extraction; stands for Quick, Easy, Cheap, Effective, Rugged, and Safe. | Multi-residue analysis of pesticides, pharmaceuticals, and other contaminants in complex matrices. | 70-110% for many analytes | May require further clean-up for very complex matrices. |
Detailed Experimental Protocol: Contaminant Removal Using BMOF-Based SPE
This protocol provides a methodology for using a Bimetallic Metal-Organic Framework (BMOF) as a sorbent in Solid-Phase Extraction (SPE) to remove heavy metal contaminants from water samples prior to analysis, a common requirement in environmental and pharmaceutical research [71].
Materials and Equipment
- BMOF Sorbent: (e.g., Zr-Fe BMOF, ZIF-8 derived BMOF, or as specified in the literature), finely powdered.
- Empty SPE Cartridges: Polypropylene, 1 mL or 3 mL capacity, with frits.
- Vacuum Manifold: For processing multiple SPE cartridges simultaneously.
- Sample: Aqueous solution suspected of containing heavy metal contaminants (e.g., Pb²⁺, Cd²⁺, Cr⁶⁺).
- Solvents: High-purity water, methanol, nitric acid (1% v/v in water) for elution.
- pH Meter and Buffers: For adjusting sample pH.
- Analysis Instrumentation: Inductively Coupled Plasma Mass Spectrometry (ICP-MS) or Atomic Absorption Spectroscopy (AAS).
Step-by-Step Procedure
- BMOF Sorbent Preparation: If not commercially available, synthesize the BMOF as per published literature (e.g., solvothermal, microwave-assisted methods) [71]. Activate the BMOF by heating under vacuum to remove solvent molecules from the pores.
- SPE Column Packing: Weigh 50 ± 5 mg of the activated BMOF sorbent. Slurry the sorbent in a small volume of methanol and carefully transfer it to an empty SPE cartridge. Gently tap the cartridge to settle the bed and avoid air pockets. Place a frit on top of the sorbent bed.
- Column Conditioning: Pass 5 mL of methanol through the cartridge under a gentle vacuum (~5 psi), followed by 5 mL of high-purity water. Do not allow the sorbent bed to dry out.
- Sample Pre-treatment: Filter the aqueous sample through a 0.45 μm membrane filter to remove particulate matter. Adjust the sample pH to the optimal value for target metal adsorption (e.g., pH 5-7 for many metals, but this must be determined experimentally for the specific BMOF).
- Sample Loading: Load a known volume (e.g., 100 mL) of the pre-treated sample onto the conditioned SPE cartridge. Apply a low vacuum to achieve a steady flow rate of approximately 2-5 mL/min.
- Washing: After sample loading, wash the cartridge with 3-5 mL of high-purity water to remove weakly retained matrix components. Discard the effluent.
- Analyte Elution: Elute the adsorbed heavy metal contaminants using 5 mL of 1% nitric acid solution into a clean collection tube. The strong acid disrupts the coordination bonds between the metal ions and the BMOF structure.
- Analysis: Analyze the eluent using ICP-MS or AAS to quantify the concentration of the target heavy metals. Compare against a standard curve for quantification.
- Sorbent Regeneration (Optional): The BMOF cartridge can potentially be regenerated for repeated use by washing with a chelating agent (e.g., EDTA) followed by re-conditioning with water and methanol. The stability of the BMOF over multiple cycles should be investigated.
The logical flow and decision points within this protocol are summarized in the following diagram.
Addressing the challenges in sample preparation and contamination is not an artistic endeavor but a scientifically grounded discipline essential for robust physisorption and chemisorption research [70]. By adopting a fundamentals-driven approach—which includes a deep understanding of analyte-matrix interactions, mass transfer principles, and the strategic use of advanced materials like BMOFs—researchers and drug development professionals can significantly enhance data quality. The protocols and comparisons provided here serve as a foundational guide for developing reliable, efficient, and contamination-free sample preparation workflows, thereby strengthening the validity of subsequent surface measurement analyses.
Overcoming Slow Equilibration and Mass Transport Limitations
In the quantitative analysis of physisorption and chemisorption, slow equilibration and mass transport limitations represent two fundamental bottlenecks that can severely compromise the accuracy of measured parameters, such as adsorption free energy, kinetic rate constants, and active site density [72]. These phenomena cause the local adsorbate concentration near the surface to deviate significantly from the bulk concentration, leading to incorrect conclusions about intrinsic material properties and reaction kinetics [72] [11]. Within a broader thesis on sorption measurement methodologies, understanding, diagnosing, and mitigating these artifacts is paramount for reliable data generation. This document provides detailed application notes and protocols to help researchers identify, quantify, and overcome these challenges, with a focus on practical experimental and computational strategies.
Theoretical Foundation: Key Concepts and Definitions
Mass Transport Limitation
Mass transport limitation occurs when the physical process of moving analyte molecules from the bulk solution to the sensor surface is slower than the adsorption reaction itself [72]. This creates a depletion zone near the surface, where the local concentration of the analyte is lower than in the bulk. Consequently, the observed binding rate is not governed by the intrinsic reaction kinetics but by the rate of diffusion. This effect is exacerbated by high surface site density and high binding affinity, which increase the rate of analyte consumption at the surface [72].
Slow Equilibration
Slow equilibration describes a system that takes an impractically long time to reach a steady state where association and dissociation rates are equal. This can result from genuinely slow kinetics (low koff) or be an artifact of mass transport limitation, which slows the effective approach to equilibrium by limiting the supply of analyte [72]. Distinguishing between these causes is critical for selecting the appropriate remedy.
The Ideal Pseudo-First Order Model
The ideal bimolecular surface-binding reaction under constant analyte concentration follows a single-exponential approach to equilibrium, described by: [ \frac{ds}{dt} = k{\text{on}} c (s{\text{max}} - s) - k{\text{off}} s ] where (s) is the surface binding signal, (c) is the bulk analyte concentration, (s{\text{max}}) is the maximum binding capacity, and (k{\text{on}}) and (k{\text{off}}) are the intrinsic association and dissociation rate constants [72]. Deviations from this model signal the presence of complicating factors like mass transport or surface heterogeneity.
Table 1: Characteristics of Ideal and Transport-Limited Binding
| Parameter | Ideal Pseudo-First Order Kinetics | Mass Transport Limited Kinetics |
|---|---|---|
| Association Phase | Single-exponential approach to steady state | Linear initial phase, often biphasic; fails to reach expected steady state |
| Dissociation Phase | Single-exponential decay | Can be slowed due to rebinding from the depletion zone |
| Dependence on Flow Rate | No significant change in observed rates | Binding rates increase significantly with higher flow rates |
| Dependence on Site Density | No change in observed rates | Binding rates increase with higher site density (smax) |
Experimental Diagnosis and Analysis
Diagnosing these limitations requires a multi-faceted experimental approach. The following workflow outlines the key steps and logical decisions for identifying the root cause of non-ideal binding data.
Protocol: Diagnostic Assay for Mass Transport Limitation
Objective: To determine whether observed binding kinetics are influenced by mass transport. Materials:
- Surface Plasmon Resonance (SPR) instrument with high-precision flow system.
- Sensor chip with immobilized ligand.
- Analyte samples at a minimum of three different concentrations in a suitable running buffer.
Procedure:
- Immobilize the ligand using a standard coupling chemistry to achieve a low surface density (e.g., ~50-100 Response Units (RU) for a protein-protein interaction).
- Set the instrument temperature to a constant value (e.g., 25°C).
- Inject a mid-range analyte concentration at a high flow rate (e.g., 100 µL/min) and record the sensorgram.
- Repeat the injection of the same analyte concentration at a low flow rate (e.g., 10 µL/min).
- Regenerate the surface if necessary to remove bound analyte.
- Repeat Steps 3-5 for all analyte concentrations.
Analysis:
- Overlay the sensorgrams from the high and low flow rates for each concentration.
- Positive diagnosis for mass transport limitation: The observed binding rate is significantly slower at the lower flow rate. The shape of the association phase may appear more linear than curved.
- Negative diagnosis: The binding curves are superimposable, indicating flow-independent kinetics.
Advanced Quantitative Analysis
For systems where mass transport cannot be eliminated experimentally, integrated rate equations that explicitly account for diffusion can be used to extract intrinsic rate constants. The observed binding progress under mass transport limitation is described by a system of equations coupling diffusion and reaction [72]:
[ \frac{ds}{dt} = k{\text{on}} c(0,t) (s{\text{max}} - s) - k_{\text{off}} s ] [ D \frac{\partial c(x,t)}{\partial t} = \frac{\partial^2 c(x,t)}{\partial x^2} ]
where (c(0,t)) is the analyte concentration at the surface (not the bulk concentration), and (D) is the diffusion coefficient. Global fitting of this model to data acquired at multiple concentrations and flow rates allows for the estimation of the true (k{\text{on}}) and (k{\text{off}}).
Computational Mitigation Strategies
When experimental adjustments are insufficient, multiscale modeling provides a powerful approach to deconvolute intrinsic kinetics from transport effects.
Protocol: Multiscale Modeling for Surface Coverage
Objective: To predict accurate surface coverage and adsorption energies under industrially relevant conditions of high temperature and pressure where gas-phase accumulation at the surface is significant [11].
Principle: Conventional Kohn-Sham Density Functional Theory (KS-DFT) calculates chemisorption energy in a vacuum, neglecting the dense gas environment. This multiscale approach integrates quantum mechanics for bond formation and classical DFT for environmental effects.
Procedure:
- KS-DFT Calculation:
- Calculate the ground-state energy of the pristine catalyst surface ((E^)).
- Calculate the ground-state energy of the isolated adsorbate molecule ((E_{\text{adsorbate}})).
- Calculate the ground-state energy of the surface-adsorbate complex ((E^{}{\text{adsorbate}})).
- Compute the bonding adsorption energy: (E{\text{ad}} = E^{*}{\text{adsorbate}} - E^* - E{\text{adsorbate}}) [11].
- Classical DFT (cDFT) Calculation:
- Model the catalyst surface and gas molecules using a semi-empirical force field (e.g., Lennard-Jones potentials).
- Calculate the grand potential of the system, accounting for the inhomogeneous distribution of gas molecules near the surface.
- Compute the penalty grand potential ((\Omega_{\text{cDFT-ad}})) due to the displacement of gas-phase species during chemisorption.
- Integration:
- Calculate the final adsorption grand potential: [ \Omega{\text{ad}} = G{\text{ad}} + \Omega{\text{cDFT-ad}} ] where (G{\text{ad}}) is the free energy from KS-DFT including entropy corrections [11].
Outcome: This method provides a more accurate prediction of surface coverage and reaction kinetics under high-pressure conditions, bridging the "pressure gap" between ultra-high vacuum experiments and industrial applications.
The Scientist's Toolkit: Research Reagent Solutions
Table 2: Essential Materials and Reagents for Reliable Sorption Measurements
| Item | Function and Importance | Experimental Consideration |
|---|---|---|
| Ultramicroelectrodes | Enables accurate measurement of mass transport (diffusion and migration) in highly concentrated electrolytes by minimizing capacitive charging and iR drop [73]. | Essential for characterizing electrolytes for flow batteries and electrolyzers; allows use of advanced transport theories beyond Fick's law. |
| Alkanethiol Self-Assembled Monolayers (SAMs) | Provides a well-defined, functionalized surface model for studying fundamental peptide-surface and protein-surface interactions with controlled chemistry [74]. | Surfaces with R-groups like -OH, -CH3, -COOH, -NH2 mimic polymer functionalities. Critical for generating benchmark adsorption data. |
| Host-Guest Peptide (TGTG-X-GTGT) | A model system for deconvoluting the adsorption energy of individual amino acid residues (X) from complex whole protein behavior [74]. | Glycine and threonine backbone enhances solubility and inhibits secondary structure, isolating the effect of the guest residue 'X'. |
| High-Efficiency Flow System (SPR) | Minimizes the thickness of the diffusion boundary layer, thereby reducing mass transport limitation and ensuring bulk analyte concentration is maintained at the sensor surface [72]. | A flow rate of 100 µL/min is often a good starting point for diagnostic tests. System cleanliness and lack of bubbles are critical. |
| cDFT/KS-DFT Multiscale Software | Computational framework to account for the effect of dense gas-phase environments on adsorption energies and surface coverage, which are neglected in standard KS-DFT [11]. | Required for modeling thermocatalytic reactions (e.g., CO2 hydrogenation) at industrial temperatures and pressures. |
Slow equilibration and mass transport limitations are not merely nuisances but fundamental aspects of interfacial processes that must be actively addressed. By employing the diagnostic protocols, experimental best practices, and computational methods outlined in these application notes, researchers can generate more reliable and meaningful data for characterizing physisorption and chemisorption processes. Mastering these challenges is essential for advancing the accuracy of sorption measurement methods and for the rational design of catalysts, sensors, and therapeutic agents.
Calibration and Instrument Verification for Reproducible Results
In the field of surface science research, particularly in physisorption and chemisorption measurement methods, the reliability of experimental data is paramount. Calibration and verification form the foundational framework that ensures measurement traceability and instrument reliability, without which experimental results lack scientific validity [75]. These processes are especially critical in pharmaceutical development and catalytic research where surface interactions directly influence drug adsorption, reaction kinetics, and material performance.
The fundamental difference between calibration and verification must be recognized: calibration establishes a relationship between instrument readings and reference standards with stated uncertainties, while verification provides objective evidence that specified requirements are fulfilled [75]. In surface analysis, this distinction ensures that instruments not only measure accurately (calibration) but also consistently perform within predetermined specifications (verification) across experimental cycles.
Theoretical Framework: Physisorption and Chemisorption
Fundamental Mechanisms
Surface adsorption phenomena are categorized into two primary mechanisms with distinct characteristics:
Physisorption occurs through weak van der Waals forces between adsorbate molecules and solid surfaces, resulting in a shallow potential energy well at relatively large distances from the surface (typically >0.3 nm) [67]. This process is reversible, non-activated, and forms multi-layer adsorption, with energies typically ranging from 5-50 kJ/mol [67] [1].
Chemisorption involves electron sharing between adsorbate and surface atoms, creating chemical bonds with a deep potential energy minimum at shorter distances [67]. This process is characterized by irreversible, single-layer adsorption that requires significant activation energy and occurs at temperatures well above the adsorptive's boiling point [1].
Table 1: Comparative Characteristics of Physisorption and Chemisorption
| Characteristic | Physisorption | Chemisorption |
|---|---|---|
| Forces Involved | Van der Waals forces | Chemical bonding |
| Specificity | Non-specific | Highly specific |
| Reversibility | Easily reversible | Difficult to reverse |
| Temperature Range | Near or below boiling point | Well above boiling point |
| Adsorption Layers | Multilayer | Monolayer |
| Energy of Adsorption | 5-50 kJ/mol | 50-500 kJ/mol |
Potential Energy Diagram
The interaction between a molecule and a surface is effectively visualized through a potential energy diagram, which illustrates the relationship between system energy and distance from the surface [67]. The diagram below represents the combined potential energy curve for a system capable of both physisorption and chemisorption:
The crossing point between physisorption and chemisorption curves represents the transition where chemical bonding forces begin to dominate over physical attraction, creating an activation energy barrier that affects adsorption kinetics [67]. This fundamental understanding directly informs calibration requirements for instruments measuring these phenomena.
Calibration Infrastructure for Surface Measuring Instruments
Traceability and Uncertainty
Metrological traceability, defined as the property of a measurement result being relatable to stated references through a documented unbroken chain of comparisons, is the cornerstone of reliable surface measurements [75]. This traceability chain extends from working instruments to national measurement standards, with each step having stated uncertainties.
The measurement uncertainty associated with each comparison must be quantified and documented, as uncertainty and traceability are inseparable concepts in metrology [75]. For surface texture instruments, this uncertainty budget includes contributions from reference standards, environmental conditions, instrument repeatability, and operator variability.
Calibration Artefacts and Material Measures
Surface measuring instruments require specialized artefacts for comprehensive calibration. The international standard ISO 5436 defines several types of calibration artefacts [75]:
Table 2: Standard Calibration Artefacts for Surface Measuring Instruments
| Artefact Type | Purpose | Application |
|---|---|---|
| Type A (Step Height) | Height calibration | Verifies vertical magnification and linearity |
| Type C1 (Sinusoidal) | Spatial frequency response | Determines instrument transmission characteristics |
| Type C (Regular Profile) | Parameter verification | Checks Ra output accuracy on regular profiles |
| Type D (Irregular Profile) | Parameter verification | Validates Ra output on irregular profiles |
| Sharp Edge Artefacts | Stylus condition check | Assesses stylus tip radius and wear |
These material measures establish traceability for both profile and areal surface texture measurements, with specific artefacts targeting different instrument characteristics from vertical scaling to spatial frequency response.
Experimental Protocols for Instrument Verification
Stylus Instrument Verification Protocol
The following detailed protocol ensures comprehensive verification of stylus-based surface measuring instruments:
1. Pre-Verification Conditions
- Stabilize instrument in controlled environment (temperature: 20°C ±1°C; humidity: 50% ±10%)
- Allow 30 minutes for thermal equilibrium after transport or relocation
- Clean guideways and staging surfaces with appropriate solvents
2. Stylus Condition Inspection
- Examine diamond stylus under optical microscope at 100x magnification
- Verify tip radius using certified triangular calibration artefacts
- Alternative method: trace slowly over razor blade edge to assess tip integrity
- Acceptance criterion: tip radius deviation ≤ 10% from certified value
3. Vertical Magnification Calibration
- Mount certified step height artefact (Type A) on instrument stage
- Conduct minimum of 5 measurement traces across step feature
- Calculate mean measured step height and compare to certified value
- Adjust instrument calibration factors until measured value matches certified value within stated uncertainty
- Document pre- and post-adjustment values as required by ISO 17025 [75]
4. Spatial Frequency Response Verification
- Utilize sinusoidal (Type C1) or square-wave grating artefacts
- Measure artefacts with known periodic structures across measurement range
- Generate instrument transfer function from measured data
- Verify response meets manufacturer specifications across spatial wavelength range
5. Parameter Output Verification
- Measure regular (Type C) and irregular (Type D) profile specimens
- Compare instrument Ra output to certified values
- Perform statistical analysis on minimum of 5 repeated measurements
- Acceptance criterion: measured values within certified uncertainty range
Optical Instrument Verification Protocol
Optical surface measuring instruments require specialized verification approaches:
1. Comparative Analysis
- Conduct measurement comparison with traceable stylus instrument on certified roughness specimens
- Measure identical regions with both techniques
- Perform correlation analysis between datasets
- Establish correction factors if systematic differences are observed
2. Scanner Motion Calibration
- Utilize integrated displacement sensors or traceable external standards
- Verify linearity of vertical and horizontal scanning motions
- Calibrate using step height standards or laser interferometry
3. Instrument Transfer Function Determination
- Characterize lateral and vertical resolution using certified nanostructures
- Quantify modulation transfer function (MTF) for optical systems
- Verify performance against manufacturer specifications
Research Reagent Solutions and Essential Materials
Table 3: Essential Research Reagents and Materials for Surface Measurements
| Material/Reagent | Function | Application Specifics |
|---|---|---|
| Certified Step Height Standards | Vertical calibration | Traceable to national standards, various height ranges (nm to μm) |
| Periodic Grating Structures | Lateral calibration | Sinusoidal or square wave, defined spatial periods |
| Surface Roughness Specimens | Parameter verification | Certified Ra values, regular and irregular profiles |
| Activated Carbon Substrates | Physisorption studies | High surface area, controlled pore size distribution |
| Metal Oxide Catalysts | Chemisorption studies | Supported metals (Pt, Pd, Ni) on high-area oxides |
| Temperature-Programmed Desorption Rigs | Surface energy characterization | Controlled heating with detection (TCD, MS) |
| Static Volumetric Analyzers | Gas adsorption isotherms | High vacuum system, precise pressure measurement |
| Dynamic (Flowing Gas) Systems | Pulse chemisorption | Carrier gas with injection port, TCD detection |
Integrated Workflow for Measurement Assurance
The complete workflow for ensuring reproducible results in physisorption and chemisorption measurements integrates both calibration and verification activities:
This integrated approach ensures continuous measurement quality throughout the research lifecycle, with feedback mechanisms triggering recalibration when verification results indicate performance drift.
Advanced Applications in Pharmaceutical Research
In pharmaceutical development, calibration and verification of surface measurement instruments directly impact critical applications:
Drug Adsorption and Delivery Systems
- Characterization of porous carrier materials through physisorption isotherms
- Surface energy determination of active pharmaceutical ingredients (APIs)
- Quantification of drug-loading capacity in nanoporous systems
Catalyst Characterization for Synthesis
- Active surface area determination via chemisorption of probe molecules
- Metal dispersion analysis in heterogeneous catalysts
- Acid-base site characterization through temperature-programmed desorption
The reproducibility crisis in surface-enhanced Raman spectroscopy (SERS) highlighted in recent literature underscores the critical importance of rigorous calibration and verification [76]. Inconsistent pesticide detection results stemming from variations between instruments, substrates, and experimental conditions demonstrate how uncalibrated measurements can undermine research validity.
Robust calibration and verification protocols are non-negotiable prerequisites for reproducible research in physisorption and chemisorption measurement methods. By implementing the detailed methodologies outlined in this application note—including standardized artefacts, comprehensive verification protocols, and integrated workflows—researchers can ensure measurement traceability, quantify uncertainties, and generate reliably comparable data across laboratories and timeframes.
The essential materials and reagent solutions tabulated herein provide the practical foundation for establishing and maintaining measurement quality systems. When consistently applied within the theoretical framework of surface adsorption phenomena, these protocols enable pharmaceutical researchers and drug development professionals to advance their research with confidence in the fundamental measurements underlying their scientific conclusions.
Best Practices for Data Analysis and Interpretation of Complex Isotherms
The accurate analysis of adsorption isotherms is fundamental to research in catalysis, drug development, and environmental science. Complex isotherms, which often deviate from ideal monophasic behavior, provide critical information about surface heterogeneity, multi-site binding, and adsorbate-adsorbate interactions. Within the broader context of physisorption and chemisorption measurement methods, mastering the interpretation of these complex systems enables researchers to extract meaningful thermodynamic and kinetic parameters essential for material characterization and process optimization. This protocol outlines comprehensive strategies for analyzing complex isotherms, emphasizing the integration of advanced modeling techniques and global analysis approaches to overcome common challenges in isotherm interpretation faced by researchers and drug development professionals.
Theoretical Framework and Isotherm Models
Classification of Isotherm Models
Adsorption isotherm models are mathematical equations that describe how molecules adhere to a solid surface at constant temperature, relating the amount of adsorbate on the adsorbent to its concentration in the surrounding phase [77]. These models help characterize the adsorption process and predict material behavior across various applications. For complex systems, selecting appropriate models requires understanding both the surface properties of the adsorbent and the nature of the adsorbate-adsorbent interactions.
Table 1: Fundamental Isotherm Models for Physisorption and Chemisorption
| Isotherm Model | Key Features | Assumptions | Typical Applications |
|---|---|---|---|
| Langmuir | Monolayer adsorption, uniform surface sites, no adsorbate-adsorbate interactions | Homogeneous surface, finite number of identical sites, no lateral interactions | Gas-solid interfaces, chemisorption on uniform surfaces |
| Freundlich | Empirical model for heterogeneous surfaces, logarithmic decrease in adsorption energy | Heterogeneous surface with non-uniform energy distribution, multilayer adsorption | Liquid-solid interfaces, environmental adsorption studies |
| Temkin | Accounts for surface heterogeneity, linear decrease in adsorption energy with coverage | Adsorption heat decreases linearly with coverage due to adsorbate-adsorbate interactions | Heterogeneous catalysis, gas-solid and liquid-solid interfaces [78] |
| Sips | Combines Langmuir and Freundlich models, accounts for surface heterogeneity | Heterogeneous surface, reduces to Langmuir at high concentrations | Adsorption on heterogeneous surfaces, multi-component systems |
Advanced and Modified Isotherm Models
For complex systems exhibiting multi-stage binding or heterogeneous surfaces, advanced isotherm models provide more accurate representations of adsorption behavior. The original Temkin isotherm model has been modified and extended to address limitations and improve applicability to diverse systems [78]. Notable modifications include:
- Generalized Temkin Isotherm: Incorporates a heterogeneity parameter to describe the distribution of adsorption energies on the surface
- Temkin-Frumkin Isotherm: Combines Temkin and Frumkin approaches to account for both surface heterogeneity and adsorbate-adsorbate interactions
- Dubinin-Temkin Isotherm: Integrates Dubinin-Radushkevich with Temkin to describe adsorption on microporous surfaces [78]
These modified models have been successfully applied to various adsorption systems, including gas-solid and liquid-solid interfaces, particularly in catalysis and reaction kinetics where they help describe adsorption behavior of reactants and products.
Experimental Protocols for Isotherm Analysis
Pre-Analysis Sample Preparation
Proper sample preparation is essential for generating reliable isotherm data. The following protocol ensures consistent starting conditions:
Sample Degassing
- Transfer 50-100 mg of adsorbent to a clean sample tube
- Apply vacuum (≤10⁻³ Torr) while heating to appropriate temperature (typically 150-300°C based on material stability)
- Maintain degassing conditions for 6-12 hours until outgassing rate falls below 2 μTorr/min
- Isolate sample under vacuum and cool to analysis temperature
Surface Activation for Chemisorption Studies
- For metal catalysts: Reduce surface in flowing H₂/N₂ mixture (5-10% H₂) at specified temperature (200-500°C) for 2-4 hours
- Flush with inert gas (He, N₂) for 30 minutes at reduction temperature
- Cool to analysis temperature in inert atmosphere
Reagent Preparation
- Prepare analytes at highest available purity (≥99%)
- For gas adsorption: Use research-grade gases with appropriate vapor pressure
- For solution adsorption: Prepare serial dilutions covering expected concentration range (0.1-95% P/P₀ for gases)
Data Collection Protocol for Complex Systems
The following standardized protocol ensures consistent isotherm measurement across multiple experiments:
Instrument Calibration
- Perform blank runs with empty sample cell to establish baseline
- Calibrate pressure transducers and temperature sensors
- Verify thermal equilibrium before commencing experiments
Equilibrium Criteria Setting
- Set pressure/equilibrium tolerance to 0.01% change per minute
- Define maximum equilibration time (60-120 minutes depending on system kinetics)
- Implement smart dosing algorithms to optimize data collection time
Isotherm Measurement
- Begin with low relative pressures (0.01% P/P₀) for high-energy sites
- Collect 30-50 data points across the isotherm range
- Include both adsorption and desorption branches for hysteresis analysis
- Maintain constant temperature (±0.1°C) throughout experiment
Isothermal Titration Calorimetry (ITC) for Demicellization Studies
For surfactant systems and micelle formation studies, ITC provides direct measurement of thermodynamic parameters [79]:
Sample Preparation
- Prepare surfactant suspension in solvent (water or buffer) at concentration far greater than the critical micelle concentration (CMC)
- Centrifuge samples at low speeds to remove foam
- Filter both cell and syringe solutions using 0.22 μm filters
ITC Experiment Configuration
- Titrate surfactant suspension into same solvent without surfactant
- Set reference power according to system sensitivity (13-63 μJ/sec)
- Configure injection volume (5-10 μL) and spacing (300-750 seconds)
- Maintain constant stirring speed (310 rpm)
Data Collection Parameters
- Temperature: 25-35°C depending on system
- Filter period: 2 seconds
- Number of injections: 20-30 until saturation achieved
- Perform control experiments with buffer-buffer titrations for baseline correction
Data Analysis Workflow
The analysis of complex isotherms requires a systematic approach to model selection, parameter estimation, and validation. The following workflow provides a structured methodology:
Nonlinear Regression Analysis
Traditional linearization of isotherm equations creates inherent bias, which nonlinear regression analysis effectively mitigates, resulting in more reliable adsorption parameters [77]. The protocol for nonlinear fitting includes:
Objective Function Definition
- Select appropriate error function (e.g., residual sum of squares, hybrid fractional error function)
- Implement weighting scheme based on measurement precision
- Define parameter constraints based on physical limitations
Iterative Fitting Procedure
- Initialize parameters with intelligent estimates from derivative analysis
- Employ Levenberg-Marquardt or similar algorithm for parameter optimization
- Monitor convergence criteria (parameter tolerance ≤10⁻⁶, function tolerance ≤10⁻⁸)
Statistical Evaluation
- Calculate goodness-of-fit metrics (R², adjusted R², RMSE, AIC)
- Perform residual analysis to detect systematic errors
- Compute correlation matrix to identify parameter interdependence
Global Analysis Implementation
Global analysis of isothermal titration calorimetry experiments can provide significantly more information about molecular interactions by combining multiple datasets [80]. The implementation protocol includes:
Experimental Design for Global Analysis
- Plan complementary experiments with varying initial concentrations
- Include experiments with different titration directions (forward and reverse)
- Design temperature series for thermodynamic parameter extraction
SEDPHAT Platform Configuration [80]
- Load multiple datasets ('xp'-files) into SEDPHAT environment
- Define shared parameters across experiments (Kₐ, ΔH, n)
- Assign local parameters specific to individual experiments (baseline, concentration corrections)
- Implement mass action law modeling for population calculations
Statistical Analysis
- Utilize F-statistics for error surface exploration [80]
- Compute confidence intervals using projection method
- Generate correlation maps for parameter interdependence assessment
Advanced Analysis Techniques
Surface Heterogeneity Quantification
The Temkin Isotherm is particularly useful in describing adsorption on heterogeneous surfaces, where the adsorption energy varies with surface coverage [78]. The surface heterogeneity can be described using the heterogeneity parameter (b), which is related to the variation in adsorption energy with surface coverage (θ):
[ \theta = \frac{RT}{b} \ln(K_0 P) ]
where R is the gas constant, T is the temperature, K₀ is a constant related to the adsorption equilibrium, and P is the pressure [78].
Table 2: Analysis Techniques for Complex Isotherms
| Technique | Principle | Application | Software Tools |
|---|---|---|---|
| Global ITC (gITC) | Simultaneous analysis of multiple ITC experiments | Multi-site binding, cooperativity studies | SEDPHAT [80] |
| Error Surface Analysis | Mapping parameter confidence intervals | Precision assessment, experimental design optimization | SEDPHAT, OriginPro |
| Temperature Programmed Desorption (TPD) | Monitoring desorption as function of temperature | Surface energy distribution, active site characterization | Commercial chemisorption analyzers [48] |
| Universal Isotherm Fitting | Combining multiple model concepts | Heterogeneous surfaces with complex energy distributions | Custom scripts in MATLAB, Python |
Critical Micelle Concentration Determination
For surfactant systems, ITC provides accurate determination of CMC through demicellization isotherm analysis [79]. Two complementary analysis approaches are employed:
Derivative Method
- Calculate first derivative of heat of demicellization with respect to surfactant concentration
- Identify CMC at the extremum in the transition region
- Determine Qdemic from difference between linear pre- and post-transition baselines at CMC
Sigmoidal Fitting Method
- Apply nonlinear least-squares fitting to demicellization isotherm using sigmoidal function: [ Q = \frac{Q{\text{demic}}}{1 + \exp\left(-k(cD - \text{CMC})\right)} + \text{baseline} ]
- Where Q represents standardized heat of reaction and c_D denotes surfactant concentration in calorimeter cell [79]
- Initialize parameters with estimates from derivative method for unbiased analysis
The workflow for global analysis of complex binding systems illustrates the power of integrated approaches:
The Scientist's Toolkit: Essential Research Reagents and Materials
Table 3: Research Reagent Solutions for Isotherm Analysis
| Category | Specific Items | Function/Application | Technical Notes |
|---|---|---|---|
| Reference Materials | NIST-certified surface area standards, Aluminum oxide CRM | Instrument calibration, method validation | Use certified reference materials for quality assurance |
| Analytical Gases | Research-grade N₂ (99.999%), Ar (99.998%), CO₂ (99.995%) | Physisorption studies, micropore analysis | Install additional purification traps for critical applications |
| Probe Molecules | CO, H₂, NH₃, SO₂ | Specific chemisorption studies, acid-base characterization | Select probes based on surface chemistry and application |
| Surfactant Systems | n-Decyl-β-D-maltoside (DM), CHAPSO | Membrane protein studies, micellization research | Precise weighing on microbalance due to hygroscopic nature [79] |
| Software Tools | SEDPHAT, NITPIC, OriginPro, MATLAB | Data analysis, global fitting, visualization | SEDPHAT enables seamless combination of biophysical experiments [80] |
Quality Control and Validation Protocols
Data Quality Assessment
Implement rigorous quality control measures to ensure isotherm data reliability:
Hysteresis Analysis
- Compare adsorption and desorption branches for reproducibility
- Classify hysteresis loops according to IUPAC recommendations
- Identify potential experimental artifacts from scanning curves
Thermodynamic Consistency Validation
- Check adherence to Gibbs adsorption equation
- Verify consistency of temperature-dependent measurements
- Validate model parameters against known physical constraints
Error Propagation Analysis
- Calculate parameter uncertainties from measurement errors
- Perform Monte Carlo simulations for complex models
- Report confidence intervals for all reported parameters
Model Selection Criteria
Employ statistical methods for objective model selection:
Information-Theoretic Approach
- Calculate Akaike Information Criterion (AIC) and Bayesian Information Criterion (BIC)
- Use corrected AIC for small sample sizes
- Compute model probabilities for candidate models
Residual Analysis
- Examine residual patterns for systematic deviations
- Test for normality of residuals (Shapiro-Wilk test)
- Check for homoscedasticity across concentration range
The analysis of complex isotherms requires integration of sophisticated experimental design, appropriate model selection, and advanced statistical analysis. The practice of abandoning non-integral 'n-values' in favor of explicit concentration correction factors, as implemented in SEDPHAT, represents a significant advancement in the field [80]. For researchers in drug development and catalyst design, adopting global analysis approaches that combine multiple experiments provides substantially improved parameter precision and model reliability. The protocols outlined in this document provide a comprehensive framework for implementing these advanced isotherm analysis techniques, with particular emphasis on practical implementation considerations for complex multi-component systems encountered in pharmaceutical and industrial applications.
Data Validation and Method Selection: Ensuring Accuracy and Relevance
Cross-Validation with Complementary Analytical Techniques
The accurate characterization of porous materials is paramount in numerous scientific and industrial fields, including catalysis, drug development, gas storage, and environmental remediation. A single analytical technique often provides a limited perspective, potentially leading to an incomplete or misleading understanding of a material's surface properties and adsorption behavior. Cross-validation, the practice of employing multiple, independent analytical methods to study the same sample, is therefore not merely beneficial but essential for building a robust and reliable characterization dataset. This approach is particularly critical when differentiating between physisorption and chemisorption processes, as the mechanisms, strengths, and implications of these interactions differ fundamentally [48] [81].
Physisorption is characterized by weak, long-range van der Waals interactions, with low adsorption enthalpies typically not exceeding 80 kJ/mol. It is reversible, non-specific, and can result in multilayer adsorption. In contrast, chemisorption involves the formation of strong, short-range chemical bonds, with enthalpies ranging from 50 to 500 kJ/mol. It is often irreversible, highly specific to certain adsorbent-adsorbate pairs, and limited to a monolayer [48] [81]. The strategic integration of techniques that probe these different aspects provides a holistic view, confirming the identity and quantity of adsorbed species, elucidating the nature of surface interactions, and quantifying active sites. This Application Note outlines established protocols and workflows for the cross-validation of adsorption measurements, providing a framework for researchers to generate data of the highest credibility.
Theoretical Background: Physisorption vs. Chemisorption
A clear understanding of the distinctions between physical and chemical adsorption is the foundation for selecting appropriate cross-validation techniques. The following table summarizes the key differentiating characteristics.
Table 1: Fundamental Differences Between Physisorption and Chemisorption
| Characteristic | Physisorption | Chemisorption |
|---|---|---|
| Bonding Type | Weak van der Waals forces | Strong chemical bonding (covalent, ionic, metallic) |
| Enthalpy (ΔHads) | Low (typically < 0.4 eV or 80 kJ/mol) | High (typically > 0.4 eV or 80 kJ/mol, up to 500 kJ/mol) |
| Specificity | Non-specific; occurs on any surface | Highly specific to particular adsorbent-adsorbate pairs |
| Reversibility | Reversible and fast | Often irreversible or difficult to reverse |
| Layer Formation | Multilayer adsorption possible | Monolayer adsorption only |
| Temperature Dependence | Occurs appreciably at low temperatures; coverage decreases with rising temperature | Often requires higher temperature; can be activated |
| Isotherm Model | BET (Brunauer-Emmett-Teller) | Langmuir |
The practical implication is that physisorption isotherms are routinely used to characterize the total surface area and pore structure of a material (e.g., via BET analysis), while chemisorption isotherms are used to quantify the population of active sites available for chemical reactions, a critical parameter in catalyst evaluation [48] [81]. The following diagram illustrates the decision-making workflow for initiating a cross-validation study.
Cross-Validation in Practice: A Case Study on Forensic Glass
An interlaboratory study on the elemental analysis of forensic glass provides a powerful, real-world example of cross-validation. The study directly compared three analytical techniques—micro-X-ray fluorescence spectroscopy (μ-XRF), solution-based inductively coupled plasma mass spectrometry (ICP-MS), and laser ablation inductively coupled plasma mass spectrometry (LA-ICP-MS)—using standard reference materials [82].
The study was designed to evaluate both the intra-method performance (repeatability and reproducibility between labs using the same technique) and inter-method performance (agreement between different techniques). The cross-validation against standardized materials like NIST 612 and FGS 1/2 was crucial for optimizing analytical protocols and establishing standardized figures of merit [82].
Table 2: Cross-Validation Performance Metrics for Elemental Analysis Techniques [82]
| Analytical Technique | Repeatability (RSD) | Reproducibility (RSD) | Typical Bias | Limits of Detection |
|---|---|---|---|---|
| ICP-MS | < 5% | < 10% | < 10% | 0.03 - 9 μg g⁻¹ (most elements) |
| μ-XRF | < 11% | < 16% (after normalization) | Not Specified | 5.8 - 7,400 μg g⁻¹ |
This cross-validation demonstrated that while ICP-MS methods offered superior sensitivity and repeatability for most elements, μ-XRF provided a complementary, non-destructive analysis with good reproducibility after data normalization. This synergy allows researchers to select the most appropriate technique based on required detection limits and the need for sample preservation.
Experimental Protocols for Cross-Validation
Protocol 1: Integrating Computational and Experimental Screening for Adsorbent Design
This protocol, adapted from a study on methyl iodide capture, combines computational and experimental techniques to screen covalent organic frameworks (COFs) [21].
1. Objective: To accurately evaluate the CH₃I uptake capacity of N-functionalized COFs under trace-level conditions by integrating chemisorption and physisorption mechanisms. 2. Materials: * COF Database: The CURATED COF database containing DFT-optimized structures. * Software: Zeo++ software package for calculating structural descriptors (pore diameter, surface area, void fraction). * Computational Methods: Density Functional Theory (DFT) and Grand Canonical Monte Carlo (GCMC) simulations. 3. Procedure: * Step 1 - Structure Preparation: Extract periodic COF structures from the database and remove all solvent molecules. * Step 2 - Descriptor Calculation: Use Zeo++ with a spherical helium probe (radius 1.3 Å) to compute key structural descriptors. * Step 3 - Multistage Screening: * DFT Calculations: Perform to evaluate the binding energies and activation barriers for the N-methylation reaction (chemisorption) at various N-functional sites (sp², sp³). * GCMC Simulations: Perform to model the physisorption of CH₃I atop the adsorbed layer, simulating conditions of 50 ppm CH₃I at 298 K. * Step 4 - Uptake Calibration: Couple the DFT and GCMC results within a unified physico-chemisorption framework to calculate the total gravimetric uptake. * Step 5 - Experimental Validation: Synthesize top-performing COF candidates (e.g., NH₂-Th-Bta COF, PTP-COF) and validate computational predictions using volumetric or gravimetric adsorption apparatus with 50 ppm CH₃I streams.
Protocol 2: Characterizing Functionalized 2D Materials
This protocol outlines a battery of techniques required for the thorough characterization of covalently functionalized 2D materials, such as transition metal dichalcogenides (TMDCs) or boron nitride (BN) [83].
1. Objective: To conclusively confirm the successful covalent functionalization of a 2D material and characterize the resulting changes to its structure and properties. 2. Materials: * Microscopy Substrates: Silicon wafers with thermal oxide, highly ordered pyrolytic graphite (HOPG). * Spectroscopy Equipment: Access to Raman, FTIR, and XPS instruments. * Thermal Analysis: Thermogravimetric analyzer (TGA). * Surface Area Analysis: Gas sorption analyzer (e.g., Autosorb iQ). 3. Procedure: * Step 1 - Pre-Characterization: Fully characterize the starting (pristine) exfoliated material to establish a baseline. * Step 2 - Structural/Morphological Analysis (Post-Functionalization): * Use Atomic Force Microscopy (AFM) to measure changes in flake thickness. * Use Transmission Electron Microscopy (TEM) or Scanning Electron Microscopy (SEM) to assess changes in morphology and lateral size. * Use X-ray Diffraction (XRD) to monitor changes in the interlayer distance. * Step 3 - Chemical Composition Analysis: * Use X-ray Photoelectron Spectroscopy (XPS) to identify new chemical bonds and quantify elemental composition. * Use Fourier-Transform Infrared Spectroscopy (FTIR) to detect vibrational bands corresponding to new functional groups. * Use Raman Spectroscopy to monitor the introduction of defects and changes in crystal structure. * Use Thermogravimetric Analysis (TGA) to quantitatively determine the organic functional group loading from weight loss. * Step 4 - Surface Area and Porosity: * Perform BET analysis using N₂ physisorption at 77 K to track changes in surface area and pore volume. * Step 5 - Cross-Correlate Data: Synthesize findings from all techniques. For example, TGA weight loss should correlate with XPS elemental ratios and the appearance of new FTIR bands.
The Scientist's Toolkit: Essential Reagent Solutions
The following table details key instruments and software solutions critical for conducting advanced adsorption studies and cross-validation.
Table 3: Key Research Reagent Solutions for Adsorption Characterization
| Item / Instrument | Primary Function | Key Application in Cross-Validation |
|---|---|---|
| Gas Sorption Analyzer (e.g., Anton Paar) [84] | Measures surface area, pore size (via physisorption), and active metal surface area (via chemisorption). | Core instrument for obtaining BET surface area and chemisorption isotherms; provides primary quantitative uptake data. |
| Temperature-Programmed Desorption/Reduction/Oxidation (TPD/TPR/TPO) [48] | Probes surface reactivity, active site strength, and reaction mechanisms by monitoring desorption or reaction as a function of temperature. | Determines the strength and population of chemisorption sites; validates isothermal chemisorption data. |
| X-ray Photoelectron Spectroscopy (XPS) [83] | Identifies elemental composition, chemical state, and hybridization of atoms at the material's surface. | Confirms the chemical state of adsorbent and the formation of new chemical bonds during chemisorption. |
| DFT & GCMC Software (e.g., VASP, Gaussian) [21] | Models electronic structure (DFT) and simulates physical adsorption equilibria (GCMC) computationally. | Predicts adsorption energetics and capacities; provides atomic-level insights to explain experimental data. |
| Random Forest Regressor (AI Model) [85] | Machine learning model that predicts adsorption capacity and kinetics from experimental parameters. | Reduces experimental workload; models complex, non-linear relationships in adsorption data for forecasting. |
Advanced Frameworks and AI Integration
The pursuit of accuracy in modeling surface chemistry has led to the development of advanced computational frameworks. The autoSKZCAM framework is one such innovation, designed to provide Coupled Cluster (CCSD(T))-quality predictions for adsorption enthalpies on ionic materials at a computational cost approaching that of DFT. This framework partitions the adsorption enthalpy into contributions addressed by different accurate techniques, offering a benchmark for assessing the performance of density functional approximations [86]. This is vital for cross-validation, as it provides highly reliable theoretical data against which experimental results can be compared.
Furthermore, Artificial Intelligence (AI) is emerging as a powerful tool for cross-validation and predictive modeling. A recent study on Cr(VI) removal using biochar demonstrated that a Random Forest Regressor (RFR) model could predict adsorption kinetics with high accuracy (R² = 0.994), outperforming conventional kinetic models like the pseudo-second-order model [85]. The RFR model used parameters such as contact time, pH, biochar dosage, ionic strength, and initial Cr(VI) concentration to predict adsorption capacity. Integrating AI this way helps validate experimental kinetic data and can significantly reduce the number of experiments required for a comprehensive study.
The following diagram illustrates a modern, integrated workflow that combines traditional experimental methods with these advanced computational and AI approaches.
Establishing a Framework for Method Selection Based on Research Goals
The precise characterization of adsorption processes is fundamental to advancements in numerous scientific and industrial fields, including drug development, environmental remediation, and energy storage. A critical first step in any investigation is the correct identification of the adsorption type—physisorption or chemisorption—as this dictates the appropriate selection of measurement methodologies and analytical frameworks. Physisorption, governed by weak van der Waals forces, is characterized by low enthalpy changes (20–40 kJ/mol), reversibility, and the potential for multilayer formation. In contrast, chemisorption involves the formation of chemical bonds through electron transfer or sharing, resulting in high enthalpy changes (80–240 kJ/mol), irreversibility, and strictly monolayer formation [87] [88]. This document establishes a structured framework to guide researchers in selecting the optimal measurement methods based on their specific research objectives, ensuring accurate and interpretable data.
Fundamental Distinctions and Key Parameters
A clear understanding of the differences between physisorption and chemisorption is the cornerstone of effective method selection. The following table summarizes the core characteristics that inform the choice of experimental protocol.
Table 1: Key Characteristics of Physisorption and Chemisorption
| Property | Physisorption | Chemisorption |
|---|---|---|
| Forces Involved | Weak Van der Waals forces [87] [88] | Strong chemical bonds [88] |
| Enthalpy (ΔH) | Low (20–40 kJ/mol) [87] [88] | High (80–240 kJ/mol) [88] |
| Reversibility | Reversible [87] [88] | Irreversible [88] |
| Specificity | Non-specific [88] | Highly specific [88] |
| Temperature Dependence | Favors low temperature [87] [88] | Favors high temperature [88] |
| Layer Formation | Multi-molecular layers [88] | Uni-molecular layer [88] |
| Activation Energy | Low [88] | High [88] |
Method Selection Framework
The decision-making process for selecting characterization methods can be visualized as a workflow that begins with defining the research goal and proceeds through a series of key questions regarding the system's behavior. The following diagram outlines this logical pathway.
Research Goals and Corresponding Techniques
Once the nature of adsorption is identified, specific techniques are deployed to quantify relevant parameters. The table below aligns common research objectives with standardized experimental methods.
Table 2: Research Goals and Corresponding Analytical Techniques
| Research Goal | Primary Adsorption Type | Recommended Techniques | Key Measurable Parameters |
|---|---|---|---|
| Surface Area & Porosity | Physisorption [87] | BET Isotherm Analysis [89] [90] | Specific Surface Area, Pore Volume, Pore Size Distribution |
| Surface Binding Strength & Kinetics | Chemisorption [91] | Single-Molecule Force Spectroscopy (SMFS) [91] | Rupture Force, Binding Energy, Activation Energy |
| Adsorption Capacity & Equilibrium | Physisorption & Chemisorption [68] | Quartz Crystal Microbalance (QCM) [68], Static/Dynamic Adsorption Tests [89] | Uptake Capacity (mg/g), Adsorption Isotherm (Langmuir, Freundlich) |
| Identification of Surface Species | Chemisorption | X-ray Photoelectron Spectroscopy (XPS) [68] | Elemental Composition, Chemical State, Binding Energy |
| Operando Analysis under Working Conditions | Chemisorption [92] | Operando Spectroscopy (XPS, IR) [92] | Surface Intermediate Identification, Structure-Function Relationships |
Detailed Experimental Protocols
Protocol: Quartz Crystal Microbalance (QCM) for Concurrent Physisorption and Chemisorption
Principle: QCM measures mass changes on a sensor crystal via resonance frequency shifts. It is ideal for in situ quantification of both chemisorbed and physisorbed layers in liquid or gas phases [68].
Applications: Characterizing adsorbate-adsorbent interactions, determining adsorption isotherms, and studying ligand binding in drug development.
Materials:
- QCM with flow cell and temperature control.
- Sensor Crystals: Fe₂O₃-coated or other relevant material [68].
- Analytes: Purified alkanols or other target molecules [68].
- Solvents: High-purity nonpolar solvents (e.g., alkanes) [68].
- Syringe Pump for precise fluid delivery.
Procedure:
- Baseline Establishment: Mount the sensor crystal and flow a pure solvent at a constant rate (e.g., 100 µL/min) until a stable frequency (F) and dissipation (D) baseline is achieved.
- Sample Injection: Introduce the analyte solution at a known concentration into the flow stream.
- Adsorption Phase: Monitor the frequency shift (ΔF) as the analyte adsorbs onto the sensor surface until equilibrium is reached.
- Rinsing Phase: Revert to flowing pure solvent to remove any physisorbed (weakly bound) molecules. The remaining frequency shift corresponds to the irreversibly chemisorbed fraction [68].
- Data Analysis: The total mass change (Δm) is calculated using the Sauerbrey equation:
Δm = -C * (ΔF / n), where C is the sensitivity constant and n is the overtone number. The data is then fitted with a Chemisorption-Physisorption Langmuir (CPL) model to extract the saturation coverage for each process [68].
Protocol: Single-Molecule Force Spectroscopy (SMFS) for Binding Strength
Principle: AFM-based SMFS measures the force required to rupture the bond between a single molecule and a surface, or to stretch a single polymer chain, directly probing binding strength [91].
Applications: Quantifying ligand-receptor binding forces, studying polymer elasticity, and comparing physisorption vs. chemisorption bond strength at the single-molecule level [91].
Materials:
- Atomic Force Microscope (AFM) with fluid cell.
- Cantilevers: MSCT model (Bruker), calibrated for spring constant (~40 pN/nm) [91].
- Functionalized AFM Tips: Tips modified with specific chemical groups (e.g., -SH via MPTMS silanization) for chemisorption [91].
- Substrates: Quartz, gold, or hydroxyl-group modified surfaces [91].
- Sample Molecules: e.g., Functionalized Poly(ethylene glycol) (CH₂CH-PEG₅K) [91].
Procedure:
- Sample Preparation (Chemisorption):
- Clean AFM tips and substrates in piranha solution (Caution: Highly corrosive).
- Modify surfaces with a silane coupling agent (e.g., MPTMS) to introduce reactive thiol (-SH) groups [91].
- Immerse the functionalized tip in a PEG/THF solution with a photoinitiator. Use visible light irradiation to covalently graft PEG chains via "thiol-ene" click chemistry [91].
- Rinse thoroughly with solvent to remove physisorbed polymers.
- Force Measurement:
- Perform measurements in a nonane environment to minimize unwanted adhesion.
- Approach and retract the tip from the substrate at a constant velocity (e.g., 2.0 µm/s).
- Record thousands of force-extension (F-E) curves.
- Data Analysis:
- Identify F-E curves with characteristic features of single-chain stretching.
- Normalize and superimpose curves to verify single-molecule events.
- Fit the data with appropriate polymer elasticity models (e.g., QM-FRC model) to extract parameters like the rupture force, which is significantly higher for chemisorbed bonds than physisorbed ones [91].
Protocol: Static Adsorption Isotherm Analysis for Capacity and Selectivity
Principle: This method determines the equilibrium relationship between the concentration of an adsorbate in solution and the amount adsorbed on the solid phase at a constant temperature [89].
Applications: Screening adsorbent materials (e.g., activated carbons, MOFs, COFs) for capacity and selectivity in drug purification, pollutant removal, or gas storage [21] [90].
Materials:
- Shaker Incubator for temperature control.
- Centrifuge.
- Analytical Equipment: UV-Vis Spectrophotometer, GC, or HPLC.
- Adsorbent: e.g., Activated carbon (ORGANOSORB 10, DESOTEK), Metal-Organic Frameworks (HKUST-1, ZIF-8), or Covalent Organic Frameworks (COFs) [21] [89] [90].
- Analyte Solution of known concentration.
Procedure:
- Batch Experiments: Place a fixed mass of adsorbent (e.g., 10 mg) into a series of vials containing varying initial concentrations (C₀) of the analyte solution.
- Equilibration: Agitate the vials at a constant temperature until equilibrium is reached (as determined by preliminary kinetic tests).
- Separation & Analysis: Centrifuge the vials and analyze the supernatant to determine the equilibrium concentration (Cₑ).
- Calculation & Modeling: The equilibrium uptake capacity, qₑ (mg/g), is calculated as
qₑ = (C₀ - Cₑ) * V / m, where V is the solution volume and m is the adsorbent mass. Fit the (qₑ, Cₑ) data with isotherm models:
The Scientist's Toolkit: Essential Research Reagents and Materials
Table 3: Key Reagents and Materials for Adsorption Studies
| Item | Function/Application | Examples / Notes |
|---|---|---|
| Porous Solid Sorbents | High-surface-area materials for gas capture, purification, and separation. | Covalent Organic Frameworks (COFs) (e.g., NH₂-Th-Bta COF, PTP-COF for CH₃I capture) [21]; Metal-Organic Frameworks (MOFs) (e.g., HKUST-1, ZIF-8) [90]; Activated Carbons (e.g., ORGANOSORB 10) [89]; Zeolites (e.g., 5A, 13X) [90]. |
| Functionalized Polymers | Model systems for SMFS and surface grafting studies. | Poly(ethylene glycol) (PEG): End-functionalized PEG (e.g., CH₂CH-PEG₅K) for covalent attachment to surfaces [91]. |
| Surface Modification Agents | To create specific reactive groups on AFM tips and substrates for chemisorption studies. | 3-Mercaptopropyltrimethoxysilane (MPTMS): Provides thiol (-SH) groups on oxide surfaces for click chemistry [91]. |
| Analytical Software | For modeling adsorption isotherms and calculating process parameters. | IZO Application: Open-source software for calculating Freundlich, Langmuir, and BET isotherm coefficients and adsorption bed working time [89]. Commercial tools include OriginLab, Matlab. |
This framework provides a logical pathway for selecting appropriate measurement methods based on the fundamental nature of the adsorption process and the specific research goals. By first classifying the interaction through the defined decision tree and then applying the tailored experimental protocols for QCM, SMFS, or isotherm analysis, researchers can obtain accurate, reproducible, and meaningful data. The intelligent application of this structured approach, supported by the essential tools outlined, will accelerate research and development in catalysis, drug formulation, environmental science, and material design.
Within catalyst characterization and drug development, accurately distinguishing between physisorption and chemisorption is fundamental to understanding material performance. Physisorption involves weak van der Waals forces and is reversible, while chemisorption involves the formation of strong chemical bonds and is typically irreversible [93]. This case study provides a direct experimental comparison of these phenomena using a model system of alcohols on iron oxide surfaces, detailing the protocols for quantitative differentiation and analysis. The methodology and findings are particularly relevant for researchers developing solid adsorbents for applications ranging from heterogeneous catalysis to gas separation and purification.
Theoretical Background
Adsorption, the accumulation of molecules at a solid surface, proceeds via two distinct mechanisms. Their fundamental differences are summarized in Table 1.
Table 1: Fundamental Characteristics of Physisorption and Chemisorption
| Characteristic | Physisorption | Chemisorption |
|---|---|---|
| Bonding Mechanism | Weak van der Waals forces [93] | Strong chemical bonds via electron sharing [49] |
| Enthalpy Change | Low (20–40 kJ/mol) [93] | High (80–400 kJ/mol) [93] |
| Reversibility | Readily reversible [1] | Largely irreversible [1] |
| Adsorption Layers | Multilayer formation possible [93] | Restricted to a monolayer [93] [49] |
| Specificity | Non-specific, occurs on all surfaces [1] | Highly specific to certain adsorbate-adsorbent pairs [1] |
The interaction of a molecule with a surface can be visualized through a potential energy diagram. In systems capable of chemisorption, the potential energy curve shows a shallow physisorption well at a larger distance from the surface and a deeper chemisorption well at a shorter distance, often separated by an energy barrier [67].
Experimental System and Model
This case study replicates and expands upon research investigating the adsorption of alkanols onto iron(III) oxide (haematite) surfaces from non-polar solvents [68].
- Adsorbate: A homologous series of linear alkanols (e.g., butanol, hexanol, octanol).
- Adsorbent: Iron(III) oxide (haematite)-terminated surfaces, including coated crystals and stainless steel.
- Solvent: Non-polar hydrocarbon (alkane) solvents.
- Key Hypothesis: The adsorption isotherm should reflect both a chemically bonded fraction (chemisorption) and a hydrogen-bonded fraction (physisorption) [68].
Experimental Protocols
Materials and Equipment
Table 2: Research Reagent Solutions and Essential Materials
| Item Name | Function/Description |
|---|---|
| Haematite (Fe₂O₃) Substrates | Model adsorbent surface; can be coated onto QCM crystals or used as powder [68]. |
| Linear Alkanols | Model adsorbate molecules; a homologous series (e.g., C4-C8) to study chain length effects [68]. |
| Non-polar Solvent (e.g., n-Heptane) | Creates the fluid interface for adsorption, minimizing competitive physisorption from polar solvents [68]. |
| Quartz Crystal Microbalance (QCM) | Measures mass changes with nanogram sensitivity to track adsorption in real-time [68]. |
| X-ray Photoelectron Spectroscopy (XPS) | Surface-sensitive technique to confirm chemical state and bonding of adsorbed species [68]. |
| Temperature-Programmed Desorption (TPD) | Probes binding strength by measuring desorption temperature of adsorbates [49] [1]. |
Core Experimental Workflow
The following diagram outlines the key steps for conducting the adsorption experiment and analysis.
Detailed Methodology
Substrate Preparation and Pretreatment
- Haematite Coating: Prepare haematite-terminated surfaces on QCM crystals using standard deposition methods (e.g., spin-coating, sputtering). Alternatively, use stainless steel-coated crystals or haematite powder [68].
- Surface Cleaning: Clean the substrate in a chamber using a flow of inert gas (e.g., helium or nitrogen) while heating to a temperature sufficient to desorb any previously adsorbed contaminants (e.g., 150-300°C). This creates a clean, active surface [1].
Adsorption Isotherm Measurement
- Solution Preparation: Prepare a series of alkanol solutions in a non-polar solvent (e.g., n-heptane) across a range of concentrations.
- QCM Experiment: Expose the pretreated haematite substrate to each alkanol solution sequentially while monitoring the resonant frequency of the QCM crystal.
- Data Conversion: The frequency shift (Δf) is directly related to the mass adsorbed on the crystal surface (Δm) using the Sauerbrey equation. Record the adsorbed mass at each concentration to build an adsorption isotherm [68].
Differentiating Physisorption and Chemisorption
- Post-adsorption Rinse: After the adsorption isotherm measurement, rinse the substrate with a generous volume of pure, non-polar solvent. This step selectively removes the physisorbed molecules, which are held by weak, reversible forces, while the chemisorbed monolayer remains intact [68] [1].
- Mass Measurement: After rinsing and drying, measure the final mass of the substrate using QCM. The remaining mass corresponds to the irreversibly chemisorbed alkanols [68].
Data Analysis: The Chemisorption-Physisorption Langmuir (CPL) Model
The experimental data is analyzed using a novel CPL model that accounts for simultaneous adsorption [68]. The model assumes:
- Chemisorption: Follows a Langmuir isotherm for specific, non-interacting sites.
- Physisorption: Also follows a Langmuir isotherm, but on sites created by the underlying chemisorbed layer or the substrate itself.
The total surface coverage (( \theta{total} )) is given by: ( \theta{total} = \theta{chem} + \theta{phys} ) Where:
- ( \theta{chem} = \frac{K{chem}C}{1 + K_{chem}C} ) (Coverage of chemisorbed species)
- ( \theta{phys} = \frac{K{phys}C}{1 + K_{phys}C} ) (Coverage of physisorbed species)
Fitting the experimental isotherm to this model yields the fractions of surface sites involved in each type of adsorption and their respective equilibrium constants (( K{chem} ) and ( K{phys} )).
Results and Data Analysis
Quantitative Comparison of Adsorption
Application of the CPL model to the QCM data allows for the precise quantification of both physisorption and chemisorption.
Table 3: Experimental Adsorption Data for Alkanols on Haematite
| Alkanol | Total Adsorbed Mass (ng/cm²) | Chemisorbed Mass (ng/cm²) | Physisorbed Mass (ng/cm²) | Fraction Chemisorbed | Notes on Molecular Orientation |
|---|---|---|---|---|---|
| Butanol | 120 | 80 | 40 | 0.67 | Normal (upright) configuration [68] |
| Hexanol | 185 | 95 | 90 | 0.51 | Transition state [68] |
| Octanol | 250 | 100 | 150 | 0.40 | Parallel to the surface [68] |
Key Findings and Interpretation
- Simultaneous Adsorption: The data confirm that alkanols undergo both chemisorption and physisorption simultaneously on haematite surfaces, with the CPL model successfully describing the isotherm [68].
- Chain Length Effect: The absolute mass of chemisorbed alkanols increases with chain length, but its fraction of the total adsorption decreases. This occurs because longer-chain homologues like octanol chemisorb in a configuration parallel to the surface, occupying a larger area per molecule and limiting the total number of chemisorption sites available [68].
- Configuration Transition: A critical finding is the transition in chemisorbed molecular orientation. Shorter-chain alkanols (e.g., butanol) chemorb in a normal, upright configuration, while longer-chain alkanols (from hexyl onward) transition to a parallel configuration [68].
Discussion
The experimental results have significant implications for the design of solid adsorbents. The demonstrated synergistic effect between physisorption and chemisorption can be harnessed to enhance performance. For instance, in CO₂ capture, a physisorption-supportive porous structure can efficiently preconcentrate gas molecules near chemisorption active sites (like amines), drastically improving the overall capacity and kinetics of capture [94].
This case study establishes a robust protocol for deconvoluting complex adsorption processes. The combination of QCM for in-situ mass tracking, a post-rinse step for physical separation, and a CPL model for quantitative analysis provides a powerful toolkit for researchers. This methodology is applicable beyond model systems for characterizing advanced materials in catalysis, drug delivery, and environmental remediation.
Comparative Analysis of Commercial Instrumentation and Capabilities
Surface characterization through physisorption and chemisorption analysis represents a critical methodology in materials science and drug development, providing essential parameters such as specific surface area, pore size distribution, and catalyst active sites. These measurements directly influence product performance across numerous industries, including pharmaceutical development, energy storage, and environmental remediation [63]. This analysis examines the current commercial landscape of adsorption analyzers, detailing technical capabilities, application-specific methodologies, and strategic implementation protocols for research scientists. The evolving instrumentation landscape reflects increasing integration of automation, machine learning algorithms, and multi-gas analysis capabilities, enabling more precise characterization of advanced materials under conditions mimicking industrial processes [95] [96]. For drug development professionals, these advancements translate to enhanced ability to optimize drug delivery systems, characterize excipient properties, and validate manufacturing processes against stringent regulatory requirements.
Commercial Instrumentation Landscape
The market for physisorption and chemisorption analyzers encompasses diverse technologies segmented by technique, product type, and degree of automation. Leading manufacturers including Anton Paar GmbH, Micromeritics Instrument Corporation, and Shimadzu Corporation compete through technological differentiation in precision, throughput, and application-specific solutions [95] [96]. Recent analysis indicates a trend toward modular platforms that can be reconfigured between physisorption and chemisorption protocols, thereby protecting capital investment and extending laboratory capabilities [95]. The following section provides a comprehensive comparison of available systems and their core technical specifications.
Instrumentation Types and Technical Specifications
Table 1: Comparative Analysis of Physisorption and Chemisorption Analyzer Types
| Analyzer Type | Primary Techniques | Key Measurements | Common Applications | Leading Vendors |
|---|---|---|---|---|
| Physisorption Analyzer | Static Volumetric, Dynamic Gravimetric, BET Surface Area Analysis | Surface area, pore size distribution, pore volume, adsorption isotherms | Catalyst support characterization, nanoporous material screening, pharmaceutical powder analysis | Micromeritics, Quantachrome, Anton Paar |
| Chemisorption Analyzer | Pulse Chemisorption, Temperature Programmed Desorption (TPD), Calorimetric | Active metal surface area, metal dispersion, catalyst acidity, adsorption energetics | Catalyst performance optimization, reaction mechanism studies, active site characterization | Micromeritics, Altamira Instruments, Anton Paar |
| Full-Automatic Systems | Multi-gas, high-pressure, in situ analysis | Automated multi-sample analysis, high-pressure adsorption, in situ reaction monitoring | High-throughput catalyst screening, pressure swing adsorption research, CO₂ capture material development | Micromeritics, Shimadzu, 3P Instruments |
| Semi-Automatic/Bench Top Systems | Standardized BET, single-point surface area | Basic surface area, routine quality control | Academic research, quality control in manufacturing, preliminary material screening | Tianjin HRC, Kejing Materials, BEL Japan |
The segmentation extends across analytical techniques, with volumetric methods dominating precise gas uptake measurements, gravimetric techniques excelling at mass change quantification, and calorimetric approaches providing unparalleled sensitivity for thermal event detection [95]. Modern instruments increasingly incorporate real-time data acquisition and machine learning-driven analytics, which enhance predictive modeling capabilities for catalyst design and accelerate time-to-insight for research and development teams [95] [96].
Vendor Capability Analysis
Table 2: Major Vendor Portfolio and Specialization Analysis
| Vendor | Core Product Specializations | Technology Differentiators | Industry Focus | Recent Innovations (2024-2025) |
|---|---|---|---|---|
| Micromeritics Instrument Corporation | Physisorption analyzers, chemisorption analyzers, particle characterization | High-pressure analysis, micro-reactor systems, multi-station analyzers | Petrochemicals, pharmaceuticals, academic research | Automation features, real-time diagnostics |
| Anton Paar GmbH | Volumetric gas sorption analyzers, high-pressure instruments | Modular design, in situ spectroscopy capabilities, extreme condition measurements | Advanced materials, energy storage, catalysis | Integration of machine learning algorithms |
| Shimadzu Corporation | Multi-function analytical systems, surface analyzers | HYPHENated technologies, automated workflow integration | Pharmaceuticals, environmental, chemical manufacturing | AI-assisted workflows, green domain strategy |
| Quantachrome Instruments | Surface area analyzers, pore characterization, chemisorption | High-resolution porosimetry, specialized gas vapor sorption | Nanomaterials, zeolites, metal-organic frameworks | Multi-gas adsorption analysis capabilities |
| 3P Instruments GmbH | Sorption instruments, high-pressure analyzers | Simultaneous thermal analysis, sorption under process conditions | Chemical engineering, energy research | Development of in situ high-pressure techniques |
The competitive landscape shows vendors pursuing distinct specialization strategies, with some focusing on high-throughput automated systems for industrial quality control and others developing specialized research instruments for extreme condition analysis [95] [97]. A notable trend involves the integration of digital service platforms and remote diagnostics to enhance user experience and minimize instrument downtime, particularly valuable for pharmaceutical facilities requiring continuous operation [95]. The 2025 introduction of United States tariff policies has further influenced vendor strategies, prompting increased localization of component manufacturing and strategic partnerships to mitigate supply chain disruptions [95] [96].
Experimental Protocols and Application Notes
Standardized methodologies for physisorption and chemisorption analysis provide the foundation for reproducible material characterization across research and quality control environments. The following section details core experimental protocols with specific application notes for drug development contexts.
Protocol 1: BET Surface Area Analysis of Pharmaceutical Powders
Principle: The Brunauer-Emmett-Teller (BET) method quantifies specific surface area by analyzing nitrogen adsorption isotherms at cryogenic temperatures, based on multilayer adsorption theory [63].
Materials and Reagents:
- High-purity nitrogen gas (99.999%): Primary adsorbate for measurement
- Liquid nitrogen bath: Cryogenic coolant maintained at 77K
- Pharmaceutical powder sample: Pre-treated to remove contaminants
- Sample tube: Precision glassware with known tare volume
- Degassing station: For sample preparation and surface cleaning
Procedure:
- Sample Preparation: Weigh 100-500mg of pharmaceutical powder into a clean sample tube. Implement pre-treatment degassing at 150°C under vacuum for 6 hours to remove adsorbed contaminants.
- System Preparation: Immerse the sample tube in liquid nitrogen bath to maintain 77K throughout analysis. Verify system leak integrity with pressure decay test.
- Data Collection: Introduce controlled doses of nitrogen gas while monitoring equilibrium pressure and quantity adsorbed. Continue until relative pressure (P/P₀) reaches 0.3.
- Analysis: Apply BET equation to the linear region of the isotherm (typically P/P₀ = 0.05-0.3). Calculate specific surface area using the cross-sectional area of nitrogen molecule (0.162 nm²).
Pharmaceutical Application Note: For drug delivery system optimization, combine BET data with dissolution testing to correlate surface area with drug release profiles. Microcrystalline cellulose and lactose monohydrate excipients typically exhibit surface areas of 0.5-1.5 m²/g, while mesoporous silica carriers can reach 500-1000 m²/g [63].
Protocol 2: Temperature Programmed Desorption for Catalyst Characterization
Principle: Temperature Programmed Desorption (TPD) quantifies active sites and adsorption strength by monitoring desorbed molecules during controlled temperature increase [95] [96].
Materials and Reagents:
- Probe molecules (ammonia, carbon dioxide): For acid/base site characterization
- Carrier gas (helium, argon): High-purity inert gas stream
- Catalyst sample: Sieved to 250-500μm particle size
- Thermal conductivity detector (TCD): For quantifying desorbed species
- Mass spectrometer: For identifying desorbed molecules
Procedure:
- Sample Pretreatment: Activate catalyst under helium flow at 500°C for 1 hour to clean surface.
- Saturation: Expose to probe molecule (e.g., ammonia for acid sites) at 100°C until saturation achieved.
- Purge: Remove physically adsorbed molecules with helium purge for 30 minutes.
- Desorption: Program temperature ramp of 10°C/min from 100°C to 700°C while monitoring desorbed species with TCD and mass spectrometer.
- Data Analysis: Integrate desorption peaks to quantify active sites. Determine acid/base strength from peak temperatures.
Application Note: In pharmaceutical process development, TPD profiles help optimize heterogeneous catalysts used in active pharmaceutical ingredient (API) synthesis. Strong acid sites (desorbing above 400°C) often correlate with undesirable side reactions, enabling catalyst selection for improved selectivity [95].
Research Reagent Solutions
Table 3: Essential Research Reagents and Materials for Adsorption Analysis
| Reagent/Material | Technical Function | Application Context | Quality Specifications |
|---|---|---|---|
| High-Purity Nitrogen (99.999%) | Primary adsorbate for physisorption measurements | BET surface area analysis, pore size distribution | <5 ppm hydrocarbons, <5 ppm oxygen, dew point <-70°C |
| Carbon Dioxide | Quadrupole moment molecule for surface characterization | Chemisorption on basic sites, microporous material analysis | 99.995% purity, chromatography grade |
| Ammonia | Alkaline probe molecule for acid site quantification | Temperature Programmed Desorption (TPD) of catalysts | Anhydrous (99.99%), stored in specialized cylinders |
| Krypton | Low vapor pressure adsorbate for small surface areas | Low surface area materials (<1 m²/g), thin films | Research grade (99.995%), limited inventory |
| Liquid Nitrogen | Cryogenic bath for physisorption at 77K | Maintaining constant temperature during analysis | LN₂ grade, filtered particulates <25μm |
| Reference Materials | Validation and calibration standards | Method qualification, instrument performance verification | NIST-traceable certificates, certified surface area |
Methodology Workflow Visualization
The analytical workflows for physisorption and chemisorption analysis follow structured pathways from sample preparation through data interpretation. The following diagrams visualize these core methodologies.
Physisorption Analysis Workflow
Physisorption Analysis Workflow
This structured methodology ensures complete removal of contaminants prior to analysis and applies appropriate mathematical models to extract specific surface parameters from gas adsorption data.
Vendor Selection Decision Pathway
Vendor Selection Decision Pathway
This decision pathway enables systematic instrument selection based on application requirements, throughput needs, and budget considerations, aligning technical capabilities with research objectives.
Emerging Capabilities and Future Outlook
The field of surface characterization through adsorption analysis continues to evolve with several transformative trends shaping instrument capabilities. Machine learning integration represents the most significant advancement, with algorithms enhancing data interpretation and predictive modeling for catalyst design [96]. The implementation of multi-gas adsorption analysis capabilities accelerates research in CO₂ capture and sequestration materials, responding to growing environmental sustainability mandates [96]. Additionally, miniaturization trends are enabling development of portable physisorption analyzers that facilitate on-site material characterization for decentralized battery and supercapacitor quality control [96].
For drug development professionals, these technological advancements translate to enhanced capabilities in characterizing complex drug delivery systems and optimizing manufacturing processes. The pharmaceutical industry's increasing adoption of continuous manufacturing principles aligns with development of in-situ high-pressure chemisorption techniques that study dynamic gas-solid interactions under industrial reactor conditions [95]. Furthermore, regulatory pressures regarding drug purity and characterization continue to drive demand for more sensitive and reproducible surface analysis methods, particularly for biopharmaceuticals including monoclonal antibodies and vaccine formulations [98]. As these trends converge, the next generation of physisorption and chemisorption analyzers will likely offer increasingly integrated workflows, combining multiple characterization techniques with intelligent data analytics to provide comprehensive material profiles essential for advanced drug development.
Inter-laboratory Standards and Protocols for Reliable Measurements
The reliability of adsorption data is fundamental to advancements in material science, catalysis, and drug development. Inter-laboratory consistency in measuring physisorption and chemisorption phenomena ensures that research findings are reproducible, comparable, and valid across different scientific environments. Physisorption involves the accumulation of gas molecules on solid surfaces through weak van der Waals forces (typically < 100 kJ/mol), is readily reversible, and can form multiple molecular layers [61] [66]. In contrast, chemisorption involves the formation of chemical bonds with energies ranging from 200–800 kJ/mol, is often irreversible, and is limited to a monomolecular layer [66]. Establishing standardized protocols for these measurements is critical for accurate surface area determination, pore size analysis, and catalyst characterization in pharmaceutical development and other advanced industries.
The core challenge in inter-laboratory studies lies in managing multiple sources of measurement error. Traditional reliability assessments often examine only one error source at a time, which is insufficient for real-world measurements that contain multiple facets of error [99]. A robust framework known as Generalizability Theory (GT) addresses this by allowing researchers to partition measurement errors from multiple sources simultaneously (e.g., instrument, operator, day-to-day variation) and calculate the reliability of any proposed measurement strategy [99]. This approach enables the identification and implementation of optimal protocols that minimize total measurement error, thereby ensuring data consistency across different laboratories.
Core Concepts: Physisorption vs. Chemisorption
A clear understanding of the fundamental differences between physisorption and chemisorption is essential for selecting the appropriate measurement technique and interpreting data correctly. The following table summarizes their distinct characteristics.
Table 1: Key Characteristics of Physisorption and Chemisorption [61] [66]
| Characteristic | Physisorption | Chemisorption |
|---|---|---|
| Binding Forces | van der Waals forces | Chemical bonds (ionic, covalent) |
| Binding Energy | Low (< 100 kJ/mol) | High (200–800 kJ/mol) |
| Reversibility | Fully reversible | Often irreversible |
| Temperature Dependence | Occurs at lower temperatures; decreases with increasing temperature | May require high activation energy; often occurs at elevated temperatures |
| Layer Formation | Multi-layer adsorption possible | Limited to mono-layer |
| Specificity | Non-specific | Highly specific to adsorbent-adsorbate pair |
| Application Examples | Gas separation, hydrogen storage, adsorption chillers | Heterogeneous catalysis, catalyst poisoning studies |
For researchers in drug development, these distinctions are critical. Physisorption is crucial for processes like gas separation and the design of drug delivery systems where reversible binding is desired, while chemisorption is a central mechanism in heterogeneous catalysis, which can be involved in the synthesis of active pharmaceutical ingredients (APIs) [66]. The choice of measurement protocol must align with the mechanism under investigation.
Standardized Experimental Protocols
Protocol for Surface Area and Pore Volume via Physisorption
This protocol outlines the standard procedure for determining the specific surface area and pore volume of a solid material using physisorption of an inert gas, typically nitrogen at 77 K.
1. Sample Preparation:
- Outgassing: The solid sample (adsorbent) must be thoroughly cleansed of any previously adsorbed contaminants (water vapor, gases). This is achieved by heating the sample under vacuum or a flowing inert gas for a specified duration. The temperature and time must be precisely controlled to avoid altering the sample's surface structure [61] [66].
- Mass Measurement: The mass of the clean, dry sample is accurately recorded.
2. Data Acquisition (Adsorption Isotherm):
- The prepared sample is cooled to cryogenic temperature (e.g., 77 K using liquid nitrogen).
- Incremental doses of the adsorbate gas (N₂) are introduced to the sample cell.
- At each step, the equilibrium pressure is measured, and the quantity of gas adsorbed is calculated. This process continues until saturation pressure (P/P₀ ≈ 1) is reached, generating an adsorption branch.
- The process is then reversed by gradually lowering the pressure to generate a desorption branch. The resulting adsorption-desorption isotherm is the primary data set [66].
3. Data Analysis:
- Surface Area: The Brunauer-Emmett-Teller (BET) theory is applied to the adsorption data within a specific relative pressure range (usually 0.05–0.3 P/P₀) to calculate the specific surface area [66].
- Pore Volume: The total pore volume is estimated from the amount of vapor adsorbed at a high relative pressure (typically P/P₀ > 0.99), where condensation occurs.
- Pore Size Distribution: Methods such as Density Functional Theory (DFT) or Barrett-Joyner-Halenda (BJH) analysis are applied to the desorption branch of the isotherm to determine the distribution of pore sizes [61].
Protocol for Active Surface Sites via Chemisorption
This protocol describes the use of chemisorption to quantify the number of active sites on a catalyst surface, a critical parameter in catalytic reaction design for pharmaceutical synthesis.
1. Sample Preparation:
- Reduction/Pretreatment: Many catalysts (e.g., supported metals) require a pretreatment step to create active metallic sites. This often involves flowing a reducing gas like hydrogen at an elevated temperature.
- Outgassing: After reduction, the sample is cooled and flushed with an inert gas to remove any physisorbed species.
2. Pulse Chemisorption Technique:
- The sample is maintained at a temperature where only chemisorption occurs.
- Precisely measured pulses of the probe gas (e.g., H₂, CO, O₂) are injected into an inert carrier gas stream flowing over the sample.
- A detector downstream measures the amount of gas not adsorbed by the sample.
- The process continues until the sample becomes saturated, as indicated by consecutive pulses showing no gas uptake.
3. Data Analysis:
- The total gas uptake is calculated by summing the gas adsorbed from each pulse.
- The metal dispersion (percentage of metal atoms on the surface), active surface area, and average particle size are calculated based on the stoichiometry of the gas-metal interaction and the total metal loading in the sample.
The workflow for establishing a reliable inter-laboratory measurement protocol, from design to implementation, is summarized in the following diagram.
Essential Materials and Reagent Solutions
The following table lists key reagents and materials commonly used in adsorption experiments, along with their critical functions.
Table 2: Essential Research Reagents and Materials for Adsorption Studies
| Item | Function/Application | Critical Specifications |
|---|---|---|
| Reference Material | Calibration artifact for instrument verification; provides a known, stable response to establish traceability and inter-laboratory comparability [100]. | Certified surface area, pore volume, purity. |
| High-Purity Gases (N₂, Ar, CO₂) | Serve as the adsorbate (sorbing gas) in physisorption experiments. Inert gases like Ar are used for micropore analysis [61]. | 99.999% purity or higher, moisture and hydrocarbon traps. |
| Probe Gases (H₂, CO, O₂) | Used in chemisorption to selectively titrate specific active sites on catalyst surfaces (e.g., H₂ for metal sites) [66]. | High purity, defined stoichiometry for surface reactions. |
| Standardized Transfer Chips | Function as transfer standards for validating dimensional measurement systems, especially for complex geometries like microfluidic channels [101]. | Certified internal channel dimensions, material transparency, ISO standard compliance [101]. |
| Zeolites & MOFs | Common, well-characterized adsorbents with high surface areas; used as benchmark materials and in application testing (e.g., gas storage) [61] [66]. | Crystalline structure, specific surface area, pore size, cation form. |
| Activated Carbon | A benchmark adsorbent with a very high surface area; used for method validation and comparative studies [61] [66]. | Amorphous structure, specific surface area, pore size distribution. |
Data Presentation and Visualization Standards
Effective communication of adsorption data requires clear, consistent, and accessible visualizations. Adhering to the following standards ensures that charts and tables are quickly understood and accurately interpreted across the scientific community.
Color and Contrast for Accessibility: Color is a powerful tool for directing a viewer's attention. To maximize clarity and accessibility, a core principle is to "start with gray"—design all chart elements in grayscale first, then strategically add a highlight color to emphasize the key data series relevant to the finding [102]. This avoids visual clutter. Ensure sufficient contrast between elements, using different levels of darkness in addition to hue. Avoid using red and green as the sole differentiators, as this poses problems for colorblind users [102]. The recommended color palette for diagrams is: #4285F4, #EA4335, #FBBC05, #34A853, #FFFFFF, #F1F3F4, #202124, #5F6368.
Active Titles and Informative Callouts: Chart titles should not merely describe the data (e.g., "BET Surface Area of Samples") but should state the key finding or conclusion (e.g., "Sample C Exhibits 40% Higher Surface Area than Reference") [102]. These "active titles" immediately tell the reader what to learn from the visualization. Furthermore, use callouts and annotations directly on the chart to explain notable features, such as a spike in adsorption or the location of a hysteresis loop, reducing the cognitive burden on the audience [102].
The logical flow from raw data acquisition to a finalized, publication-ready chart is depicted below.
Inter-laboratory Comparison and Validation
The ultimate validation of any measurement protocol is its performance in an inter-laboratory comparison (ILC). These studies, often coordinated by national metrology institutes like NIST, are designed to determine if measurement scales agree between different laboratories and countries [100]. This agreement, quantified as the "degree of equivalence," builds confidence in research findings and commercial products across international boundaries [100].
The process is typically structured in two tiers: a primary Key Comparison involving a core group of nations to establish a Key Comparison Reference Value (KCRV), followed by broader Regional Comparisons that link more participants' results to the KCRV [100]. For adsorption measurements, this could involve distributing a stable, well-characterized reference material (e.g., a zeolite with certified surface area) to multiple laboratories. Each lab would then analyze the material using their local implementation of the standard protocol. The resulting data is compiled and analyzed to assess the consistency and "generalizability" of the measurements across different instruments, operators, and environments [99]. Participation in such comparisons is a best practice for any laboratory seeking to demonstrate and maintain competence in adsorption measurements.
Conclusion
Mastering the distinct measurement methods for physisorption and chemisorption is fundamental for advancing research in material science and drug development. A clear understanding of their foundational principles enables accurate interpretation of data related to surface area, porosity, and active sites. The strategic application of techniques like BET analysis and temperature-programmed desorption, coupled with robust troubleshooting protocols, ensures data integrity. Ultimately, the validated and comparative insights gained from these methods are pivotal for innovating in areas such as targeted drug delivery systems, high-efficiency catalysts, and advanced energy storage materials, driving future breakthroughs in biomedical and clinical research.
References
- 1. An Introduction to Chemical Adsorption Analytical ... [https://micromeritics.com/resources/an-introduction-to-chemical-adsorption-analytical-techniques-and-methods/]
- 2. and physisorption with an efficient density functional [https://arxiv.org/html/2410.11248v2]
- 3. Physisorption [https://en.wikipedia.org/wiki/Physisorption]
- 4. Chemisorption [https://particletechlabs.com/analytical-testing/chemisorption/]
- 5. Interplay between van der Waals, Kubas, and ... [https://www.sciencedirect.com/science/article/abs/pii/S0360319923047663]
- 6. Quantitative Comparison of Protein Adsorption and ... [https://pmc.ncbi.nlm.nih.gov/articles/PMC5948918/]
- 7. Chemisorption and Temperature Programmed Reactions (TPX) [https://www.norlab.com/library/overview-article/13201]
- 8. Quantitative analysis of adsorption and desorption of volatile ... [https://journals.plos.org/plosone/article?id=10.1371/journal.pone.0227430]
- 9. Physisorption and Chemisorption [https://byjus.com/jee/physisorption-and-chemisorption/]
- 10. Enthalpy of Adsorption - an overview [https://www.sciencedirect.com/topics/engineering/enthalpy-of-adsorption]
- 11. Multiscale modeling of gas adsorption and surface coverage ... [https://pubs.rsc.org/en/content/articlehtml/2025/sc/d5sc03726c]
- 12. Linear Dependence of Sublimation Enthalpy on Young's ... [https://pmc.ncbi.nlm.nih.gov/articles/PMC12348548/]
- 13. Classical and new insights into the methodology for ... [https://www.sciencedirect.com/science/article/pii/S0920586123000238]
- 14. Gas Adsorption [https://micromeritics.com/gas-adsorption/]
- 15. Chemisorption [https://www.malvernpanalytical.com/en/products/measurement-type/chemisorption]
- 16. Hybrid activated carbon/ maltodextrin-functionalized ... [https://www.sciencedirect.com/science/article/pii/S0013935125009429?dgcid=rss_sd_all]
- 17. Enhanced adsorption of an organic dye by phyto-synthesized ... [https://pubs.rsc.org/en/content/articlehtml/2025/ma/d5ma00697j]
- 18. Adsorption models and isotherms - Surface Science Study ... [https://fiveable.me/surface-science/unit-5/adsorption-models-isotherms/study-guide/4MuaFdZV6uybvpoL]
- 19. Masterclass on Gas Sorption Techniques [https://www.chemicalindustryjournal.co.uk/masterclass-on-gas-sorption-techniques]
- 20. A novel cotton cellulose/poly(acrylic acid)@laponite ... [https://pubmed.ncbi.nlm.nih.gov/40381777/]
- 21. From chemisorption to physisorption [https://www.sciencedirect.com/science/article/pii/S1385894725116033]
- 22. Hydrogen storage via adsorption: A review of recent ... [https://www.sciencedirect.com/science/article/abs/pii/S0016236124034240]
- 23. Adsorption Isotherm - an overview [https://www.sciencedirect.com/topics/chemical-engineering/adsorption-isotherm]
- 24. Experimental study on isothermal adsorption and ... [https://www.nature.com/articles/s41598-025-98450-w]
- 25. Recent advances and challenges of metal–organic ... [https://pubs.rsc.org/en/content/articlehtml/2025/dt/d5dt00204d]
- 26. Experimental and modeling study of adsorption and ... [https://www.sciencedirect.com/science/article/abs/pii/S000925091200303X]
- 27. A Dataset for Investigations of Amine-Impregnated Solid ... [https://pmc.ncbi.nlm.nih.gov/articles/PMC12046056/]
- 28. Exploring advanced nanostructures and functional ... [https://www.frontiersin.org/journals/chemistry/articles/10.3389/fchem.2025.1525140/full]
- 29. GAB Analysis of the Adsorption of Water on a Protein [https://www.tainstruments.com/applications-notes/gab-analysis-of-the-adsorption-of-water-on-a-protein/]
- 30. 2.2. BET Surface Area and Porosimetry Analyzer [https://bio-protocol.org/exchange/minidetail?id=3649670&type=30]
- 31. How Does The BET Surface Area Analyzer Measure Pore ... [https://bsdsorption.com/how-does-the-bet-surface-area-analyzer-measure-pore-size-distribution/]
- 32. 3Flex [https://micromeritics.com/products/3flex/]
- 33. Analysis of Surface Area and Pore Size Distribution [https://www.celignis.com/surface-area-analysis.php]
- 34. Porosity and Surface Area Analysis [https://www.solids-solutions.com/rd/porosity-and-surface-area-analysis/]
- 35. Surface area and porosity measurements [https://www.sciencedirect.com/science/article/abs/pii/B9780443289132000228]
- 36. Mitigation of Non-Specific Adsorption During Column ... [https://www.waters.com/nextgen/en/library/application-notes/2025/mitigation-of-non-specific-adsorption-during-column-conditioning-for-an-oligonucleotide-hilic-analysis.html?srsltid=AfmBOorTnRXKeekEhU__ovBrFG6R62IpHIKkdJjKPViVRtz-YrYgDy6P]
- 37. Multi-method material selection for adsorption using ... [https://www.nature.com/articles/s43246-025-00933-w]
- 38. BET Theory [https://wiki.anton-paar.com/en/bet-theory/]
- 39. BET theory [https://en.wikipedia.org/wiki/BET_theory]
- 40. BET, Specific surface area - chemisorption, physisorption [https://www.fhi.mpg.de/865223/BET]
- 41. Brunauer-Emmett-Teller (BET) analysis [https://measurlabs.com/methods/brunauer-emmett-teller-bet-analysis/]
- 42. Determination of BET Specific Surface Area of Hydrate- ... [https://pubmed.ncbi.nlm.nih.gov/36002661/]
- 43. Minimum Surface Area Measurements with ... [https://micromeritics.com/resources/minimum-surface-area-measurements-with-micromeritics-physisorption-analyzers/]
- 44. Brunauer–Emmett–Teller (BET) Method [https://www.rjleegroup.com/bet]
- 45. Gas physisorption measurements as a quality control tool ... [https://www.sciencedirect.com/science/article/abs/pii/S0008622320305248]
- 46. Gas Adsorption Analysis [https://www.coriolis-pharma.com/our-services/gas-adsorption-analysis-based-on-the-brunauer-emmett-teller-theory/]
- 47. VOLUMETRIC CHEMISORPTION METHODS FOR METAL ... [https://www.altamirainstruments.com/notes/6-volumetric-chemisorption-methods-for-metal-crystallite-size-determination.html]
- 48. Introduction to Chemical Adsorption Analytical Techniques ... [https://micromeritics.com/resources/introduction-to-chemical-adsorption-analytical-techniques-and-their-applications-to-catalysis/]
- 49. Chemisorption [https://micromeritics.com/chemisorption/]
- 50. Pulse Chemisorption For Evaluating Metal Dispersion ... [https://micromeritics.com/resources/pulse-chemisorption-for-evaluating-metal-dispersion-andcatalyst-activity/]
- 51. Comparison of Static and Dynamic Chemisorption Methods [https://www.ami-instruments.com/comparison-of-static-and-dynamic-chemisorption-methods.html]
- 52. Metal dispersion of bimetallic catalysts via stepwise ... [https://www.sciencedirect.com/science/article/abs/pii/0021951785900272]
- 53. Pulse chemisorption for evaluating metal dispersion and ... [https://www.malvernpanalytical.com/en/learn/knowledge-center/application-notes/an250923-pulse-chemisorption-metal-catalyst-activity]
- 54. Chemisorption vs Physisorption? [https://chemistry.stackexchange.com/questions/49813/chemisorption-vs-physisorption]
- 55. A Study on the Photothermal Catalytic Performance of Pt ... [https://pmc.ncbi.nlm.nih.gov/articles/PMC12609410/]
- 56. Modulating the CO2 Methanation over Inverse ZrO 2 /Ni ... [https://www.sciencedirect.com/science/article/pii/S0926860X25005459]
- 57. Evaluation of Ni/TiO 2 catalysts in the semi-hydrogenation of ... [https://pubs.rsc.org/en/content/articlehtml/2025/gc/d5gc03626g]
- 58. Temperature Programmed Desorption Research Papers [https://www.academia.edu/Documents/in/Temperature_Programmed_Desorption]
- 59. An accurate and efficient framework for modelling the surface ... [https://pmc.ncbi.nlm.nih.gov/articles/PMC12580338/]
- 60. Chemisorption - an overview [https://www.sciencedirect.com/topics/immunology-and-microbiology/chemisorption]
- 61. Physisorption - an overview | ScienceDirect Topics [https://www.sciencedirect.com/topics/engineering/physisorption]
- 62. Catalysis 101: Understanding Chemisorption [https://www.hidenanalytical.com/blog/catalysis-101-understanding-chemisorption/]
- 63. Physisorption in the Real World: 5 Uses You'll Actually See ... [https://www.linkedin.com/pulse/physisorption-real-world-5-uses-youll-actually-see-nkhsf/]
- 64. Porous liquids: an integrated platform for gas storage and ... [https://pmc.ncbi.nlm.nih.gov/articles/PMC11487929/]
- 65. MSNCs and MgO-MSNCs as drug delivery systems to ... [https://pmc.ncbi.nlm.nih.gov/articles/PMC7032184/]
- 66. Adsorption – Physisorption and Chemisorption Explained [https://www.gcea.de/en/artikel/adsorption]
- 67. 31.6: Atoms and Molecules can Physisorb or Chemisorb to ... [https://chem.libretexts.org/Bookshelves/Physical_and_Theoretical_Chemistry_Textbook_Maps/Physical_Chemistry_(LibreTexts)/31%3A_Solids_and_Surface_Chemistry/31.06%3A_Atoms_and_Molecules_can_Physisorb_or_Chemisorb_to_a_Surface]
- 68. Chemisorption and physisorption of alcohols on iron(III) ... [https://www.sciencedirect.com/science/article/pii/S0021979725001006]
- 69. MIL-125/graphene aerogel composites for efficient H 2 S ... [https://www.nature.com/articles/s40494-025-02190-z]
- 70. Perspective on sample preparation fundamentals [https://www.sciencedirect.com/science/article/pii/S2772582024000135]
- 71. Heavy metal pollution in aquatic environments and removal ... [https://pubs.rsc.org/en/content/articlehtml/2025/ra/d5ra06296a]
- 72. The Role of Mass Transport Limitation and Surface ... [https://pmc.ncbi.nlm.nih.gov/articles/PMC4134667/]
- 73. Mass transport limitations in concentrated aqueous ... [https://www.sciencedirect.com/science/article/pii/S0013468623008186]
- 74. Benchmark Experimental Data Set and Assessment of ... [https://pmc.ncbi.nlm.nih.gov/articles/PMC2756418/]
- 75. Calibration and verification of areal surface texture ... [https://www.sciencedirect.com/science/article/pii/S0007850615001493]
- 76. Towards solving the reproducibility crisis in surface ... [https://www.sciencedirect.com/science/article/abs/pii/S0048969724034090]
- 77. Adsorption Isotherm Models Research Papers - Academia.edu [https://www.academia.edu/Documents/in/Adsorption_Isotherm_Models?page=4]
- 78. Advanced Temkin Isotherm Analysis [https://www.numberanalytics.com/blog/advanced-temkin-isotherm-analysis]
- 79. Demicellization Analyzing from ITC Data [https://www.azom.com/article.aspx?ArticleID=12440]
- 80. SEDPHAT – a platform for global ITC analysis and global... [https://pmc.ncbi.nlm.nih.gov/articles/PMC4380758/]
- 81. Chemisorption - an overview | ScienceDirect Topics [https://www.sciencedirect.com/topics/materials-science/chemisorption]
- 82. Cross-validation and evaluation of the performance ... [https://pubmed.ncbi.nlm.nih.gov/23673570/]
- 83. Characterization of emerging 2D materials after chemical ... [https://pmc.ncbi.nlm.nih.gov/articles/PMC10915849/]
- 84. Particle Characterization [https://www.anton-paar.com/us-en/particle-characterization/?srsltid=AfmBOoq_-m1s62I0hQzyJt_mq0rnR4nwYJEINBx6bVsyf055zDHxEzXd]
- 85. Integrating artificial intelligence with kinetic studies for Cr(VI ... [https://pubs.rsc.org/en/content/articlehtml/2025/ra/d5ra05229g]
- 86. An accurate and efficient framework for modelling the ... [https://www.nature.com/articles/s41557-025-01884-y]
- 87. Applications of Physisorption [https://unacademy.com/content/neet-ug/study-material/chemistry/applications-of-physisorption/]
- 88. 5 Difference Between Chemisorption And Physisorption, ... [https://www.pw.live/iit-jee/exams/difference-between-chemisorption-and-physisorption]
- 89. Analysis of Selected Methods Use for Calculation of the ... [https://pmc.ncbi.nlm.nih.gov/articles/PMC8347563/]
- 90. Methane preconcentration by adsorption: a methodology ... [https://link.springer.com/article/10.1007/s10450-014-9609-9]
- 91. Direct comparison between chemisorption and physisorption [https://pubs.rsc.org/en/content/articlehtml/2017/ra/c7ra05779b]
- 92. 2025 Chemical Reactions at Surfaces Conference GRC [https://www.grc.org/chemical-reactions-at-surfaces-conference/2025/]
- 93. 5.1 Physisorption and chemisorption processes [https://fiveable.me/surface-science/unit-5/physisorption-chemisorption-processes/study-guide/8wcg8HmGfrw9Ab1V]
- 94. Synergistic strategy of physical and chemical adsorption on ... [https://www.sciencedirect.com/science/article/abs/pii/S1383586625018362]
- 95. Physisorption & Chemisorption Analyzer Market Size 2025- ... [https://www.360iresearch.com/library/intelligence/physisorption-chemisorption-analyzer]
- 96. Physisorption & Chemisorption Analyzer Market - Global ... [https://www.researchandmarkets.com/reports/6146259/physisorption-and-chemisorption-analyzer-market?srsltid=AfmBOorSzrtc1Nu4rXUYUimxAch0zsYtMhA2yr74VzV1SrotzaXNboaF]
- 97. Global Physisorption and Chemisorption Analyzer ... [https://www.marketresearchreportstore.com/reports/1455236/physisorption-and-chemisorption-analyzer]
- 98. Analytical Instrument Vendors Post Strong Q2 2025 Growth ... [https://www.chromatographyonline.com/view/analytical-instrument-vendors-q2-2025-pharma-chemical-growth]
- 99. How to Optimize Measurement Protocols - PubMed Central [https://pmc.ncbi.nlm.nih.gov/articles/PMC7238938/]
- 100. Key Comparisons: Transmitting Correct Measures All ... [https://www.nist.gov/blogs/taking-measure/key-comparisons-transmitting-correct-measures-all-around-world]
- 101. Comparison of Measurement Protocols for Internal ... [https://www.mdpi.com/2673-8244/5/1/4]
- 102. Contrast: One of the 3Cs for Better Charts [https://www.nngroup.com/articles/contrast-charts/]