Stabilizing Catalysts in Biomedicine: A Comprehensive Guide to Additives, Promoters, and Enhanced Performance
This article provides researchers, scientists, and drug development professionals with a detailed exploration of how chemical additives and promoters can significantly enhance catalyst stability—a critical factor in pharmaceutical synthesis, bioconjugation,...
Stabilizing Catalysts in Biomedicine: A Comprehensive Guide to Additives, Promoters, and Enhanced Performance
Abstract
This article provides researchers, scientists, and drug development professionals with a detailed exploration of how chemical additives and promoters can significantly enhance catalyst stability—a critical factor in pharmaceutical synthesis, bioconjugation, and diagnostic assay development. Covering foundational principles, methodological applications, common troubleshooting, and comparative validation, it offers a practical framework for selecting and deploying these stabilizing agents. The discussion integrates current literature and emerging trends to address challenges like sintering, poisoning, and leaching, ultimately aiming to improve reaction yields, reduce costs, and increase the reproducibility of catalytic processes in biomedical research.
Understanding Catalyst Deactivation: Why Stability is Paramount in Biomedical Applications
Welcome to the Technical Support Center for Catalyst Stability Research. This resource is designed to support researchers in the field of additives and promoters for enhanced catalyst stability. Below are troubleshooting guides, FAQs, and essential resources framed within this specific research context.
Troubleshooting Guides & FAQs
Q1: During long-term testing, my catalyst's activity declines rapidly despite using a promoter. What are the primary failure modes I should investigate? A: Rapid deactivation often points to:
- Thermal Sintering: Aggregation of active metal particles at high operating temperatures.
- Chemical Poisoning: Strong chemisorption of feed impurities (e.g., S, Cl) on active sites.
- Carbon Deposition (Coking): Formation of polymeric carbon or graphite blocking pores and sites.
- Leaching: Loss of active phase into solution (relevant in liquid-phase reactions).
- Phase Transformation: Change in the catalyst's structural or oxidation state.
Investigation Protocol:
- Post-mortem Analysis: Perform XRD on spent catalyst to check crystallite size (sintering) and phase changes.
- Temperature-Programmed Oxidation (TPO): Quantify and characterize carbon deposits.
- Elemental Analysis (ICP-MS): Measure metal content to confirm leaching.
- Surface Analysis (XPS): Examine surface composition for poisoning species.
Q2: My promoter improves catalyst lifetime but severely impacts selectivity. How can I diagnose this trade-off? A: This indicates the promoter is altering the reaction pathway. Key diagnostics:
- Microkinetic Analysis: Measure reaction rates of desired vs. side reactions.
- In-situ DRIFTS: Identify surface intermediates formed in the presence of the promoter.
- Active Site Titration: Use chemical probes to quantify different site types (e.g., acid vs. metal sites).
Investigation Protocol:
- Conduct selectivity tests at varying conversion levels (to distinguish kinetic from transport effects).
- Correlate selectivity data with promoter loading (see Table 1).
- Use isotopic labeling to track specific reaction pathways.
Q3: How do I accurately measure and define "lifetime" in a standardized way for my thesis? A: Lifetime is not a single metric. Define it operationally using:
- T50: Time (or total throughput) for activity to drop to 50% of initial.
- Deactivation Constant (kd): Calculated from activity decay models.
- Total Turnover Number (TTON): Total moles of product per mole of active site before deactivation.
Standard Protocol for Lifetime Testing:
- Establish baseline activity (X0) under reference conditions.
- Run continuous long-term experiment, monitoring conversion (X) vs. time (t).
- Model decay (e.g., first-order: -dX/dt = kdX).
- Report T50 and kd alongside operating conditions.
Table 1: Impact of Common Promoters on Model Catalytic Systems
| Catalyst System | Promoter/Additive | Key Stability Metric Change | Selectivity Change | Common Mechanism |
|---|---|---|---|---|
| Pt/Al2O3 | Sn | Lifetime (T50) ↑ ~300% | Dehydrogenation ↑ | Geometric isolation of Pt, reduces coking. |
| Co Fischer-Tropsch | Re | Sintering Resistance ↑ (Crystal Growth ↓ 70%) | C5+ selectivity ↑ ~10% | Anchors Co particles, inhibits coalescence. |
| Cu-ZnO Methanol Synthesis | Ga2O3 | Activity Decay Rate (kd) ↓ 60% | Methanol selectivity ↑ ~5% | Stabilizes Cu+ species, suppresses over-reduction. |
| Pd for Oxidation | La2O3 | Sintering Onset Temp. ↑ 150°C | CO2 selectivity unaffected | Forms surface LaPdOx perovskite, inhibits mobility. |
Experimental Protocols
Protocol: Accelerated Aging Test for Catalyst Stability Screening Objective: To rapidly compare the stabilizing effect of different additives.
- Pre-treatment: Reduce catalyst (e.g., 5% H2/Ar, 400°C, 2 h).
- Baseline Activity: Measure initial conversion (X0) and selectivity under standard conditions (T, P, WHSV).
- Aging Cycle: Expose catalyst to severe but controlled stress:
- Thermal: Cycle temperature between reaction T and T+100°C (e.g., 5 cycles).
- Chemical: Pulse a known poison (e.g., 100 ppm thiophene in feed for 1 h) or switch to a coke-inducing feed for a set period.
- Post-Aging Activity: Return to standard conditions and measure conversion (Xaged).
- Calculation: Determine % Activity Retention = (Xaged / X0) * 100. Compare across promoted/unpromoted samples.
Protocol: Chemisorption for Active Site Density & Dispersion Objective: To quantify active sites and assess if additives improve metal dispersion.
- Sample Preparation: Reduce catalyst, then purge with inert gas at reduction temperature.
- Cool: Cool to analysis temperature (e.g., 35°C for H2 on Pt) under inert flow.
- Pulse Chemisorption: Inject calibrated pulses of probe gas (H2, CO) until saturation (constant peak area).
- Calculation:
- Total Uptake = Σ (pulse areas) * calibration factor.
- Dispersion (%) = (Atoms on Surface / Total Atoms) * 100.
- Crystallite Size (nm) = f(Dispersion, metal type).
Visualizations
Title: Catalyst Stability Evaluation Workflow
Title: Additive Action on Deactivation Pathways
The Scientist's Toolkit: Research Reagent Solutions
Table 2: Essential Materials for Catalyst Stability Experiments
| Item | Function & Relevance to Stability Research |
|---|---|
| Temperature-Programmed Reaction (TPR/TPD/TPO) System | To quantify reducibility, acid site strength, and carbon deposit reactivity. Critical for understanding promoter effects on catalyst structure. |
| In-situ Cell (for DRIFTS, XRD, Raman) | To observe real-time changes in surface species, oxidation state, and crystal structure during reaction or deactivation. |
| Metallic Precursor Salts (e.g., H2PtCl6, Ni(NO3)2) | For synthesizing active phase. High-purity grades ensure reproducibility in doping/additive studies. |
| Promoter Precursors (e.g., SnCl2, (NH4)6Mo7O24, Ce(NO3)3) | To introduce stabilizing additives via impregnation. |
| Probe Molecules (e.g., CO for IR, N2O for Cu dispersion, NH3 for acidity) | To titrate and characterize active sites before/after aging. |
| Model Poison Compounds (e.g., Thiophene, Quinoline) | To conduct controlled poisoning studies and benchmark additive efficacy. |
| High-Temperature Bindery (e.g., γ-Al2O3, SiO2) | Provides mechanical and thermal stability to the active phase. Its interaction with promoters is key. |
| Catalytic Reactor System (Fixed-bed, CSTR) with On-line GC/MS | For precise, continuous measurement of activity and selectivity over extended lifetimes. |
Technical Support Center: Troubleshooting Guides & FAQs
Q1: Our supported metal catalyst shows a rapid, irreversible drop in activity at high temperature. TEM confirms larger particle sizes. Is this sintering? How can we mitigate it?
A: Yes, this is thermal sintering. To confirm, measure BET surface area (it will decrease) and CO chemisorption (metal dispersion will drop). Mitigation strategies include:
- Adding Structural Promoters: Use refractory oxides like Al₂O₃, SiO₂, or CeO₂ as supports to create strong metal-support interactions (SMSI).
- Alloying: Form bimetallic nanoparticles (e.g., Pt-Sn, Pd-Au) to raise the Tamman temperature.
- Optimize Calcination: Use the lowest effective temperature and avoid steam.
Experimental Protocol for Sintering Analysis:
- Accelerated Aging: Treat catalyst sample in a tubular furnace under relevant gas atmosphere (e.g., 10% H₂/N₂ or air) at 50-100°C above normal operating temperature for 2-24 hours.
- Characterization:
- BET Surface Area: Use N₂ physisorption. A >20% decrease indicates significant sintering.
- Chemisorption: Perform pulsed CO or H₂ chemisorption. Calculate % metal dispersion.
- TEM/STEM: Image particles pre- and post-treatment. Measure particle size distribution for 200+ particles.
Q2: After introducing a feedstock containing sulfur, catalyst activity plummets and is not restored by standard regeneration. Could this be poisoning?
A: Very likely. Strong chemisorption of electronegative elements (S, P, Pb, As) blocks active sites. Perform Temperature-Programmed Desorption (TPD) or XPS to identify surface poisons. Prevention is key:
- Feedstock Purification: Implement guard beds (e.g., ZnO for sulfur removal).
- Tolerant Catalyst Formulations: Use promoters like MoO₃ in hydrotreating catalysts which bind sulfur reversibly, or develop sulfur-tolerant alloys (e.g., Pt-Re).
Q3: We observe black deposits and pressure drop increase in our fixed-bed reactor during hydrocarbon processing. Is this coking? How do we remove it?
A: Yes, this is characteristic of coking (carbon deposition). Regeneration Protocol:
- Purge: Inert gas (N₂) purge to remove process gases.
- Controlled Combustion: Introduce 2% O₂ in N₂ at 400-450°C. CRITICAL: Monitor temperature with internal thermocouples to prevent runaway exotherms (>600°C can cause sintering).
- Hold: Continue until CO₂ in effluent returns to baseline.
- Reduction: For metal catalysts, follow with a mild H₂ reduction step (300°C, 1-2 hrs) to restore reduced metal sites.
- To prevent coking: Add K or Mg promoters to reduce acid site strength, or use steam co-feed (steam reforming).
Q4: Our liquid-phase reaction catalyst shows metal ions in the product stream. Is this leaching, and how do we prove it?
A: This indicates leaching (active species dissolving into the reaction medium). Confirmatory Protocol:
- Inductively Coupled Plasma (ICP) Analysis: Filter the product stream hot (to avoid precipitation) through a 0.2 µm membrane. Analyze the filtrate via ICP-MS/OES for the catalyst metal(s).
- Hot Filtration Test: During reaction, filter off catalyst, return clean solvent to reactor, and monitor if reaction continues. Continued reaction indicates soluble, leached species are active (heterogeneous vs. homogeneous catalysis debate).
- Solid Analysis: Post-reaction, analyze spent catalyst via XRF or ICP after digestion for metal loading loss.
Table 1: Quantitative Comparison of Catalyst Deactivation Modes
| Deactivation Mode | Typical Activity Loss Rate | Primary Cause | Reversibility | Key Diagnostic Technique |
|---|---|---|---|---|
| Sintering | Slow to Moderate (weeks/months) | High T, Steam | Irreversible | TEM, Chemisorption, BET |
| Poisoning | Rapid (hours/days) | Strong Chemisorption of Impurities | Often Irreversible | TPD, XPS, EDX |
| Coking | Moderate (days/weeks) | Side Reactions on Acid Sites | Reversible (via combustion) | TPO, TGA, Visual Inspection |
| Leaching | Variable (hours/months) | Solubility in Reaction Medium | Irreversible | ICP-MS, Hot Filtration Test |
Table 2: Research Reagent Solutions for Stability Studies
| Reagent / Material | Function in Catalyst Stability Research |
|---|---|
| Cerium(IV) Oxide (CeO₂) | Oxygen storage promoter; mitigates coking via carbon oxidation and stabilizes particles against sintering. |
| Chloroplatinic Acid (H₂PtCl₆) | Common Pt precursor for catalyst synthesis; used in studying sintering of noble metals. |
| Thiophene (C₄H₄S) | Model sulfur-containing poison used in controlled poisoning experiments. |
| Potassium Nitrate (KNO₃) | Source of K⁺ promoter; used to electronically modify surfaces, reducing coking and poisoning. |
| Tungsten(VI) Oxide (WO₃) | Solid acid and promoter; studied for its role in strong metal-support interaction (SMSI) effects. |
| 1,3-Butadiene | Model unsaturated hydrocarbon for accelerated coking studies. |
| Ammonium Perrhenate (NH₄ReO₄) | Re precursor; used with Pt to form Pt-Re alloys resistant to sintering and coking. |
Diagram 1: Catalyst Deactivation Decision Tree
Diagram 2: Catalyst Stability Enhancement Pathways
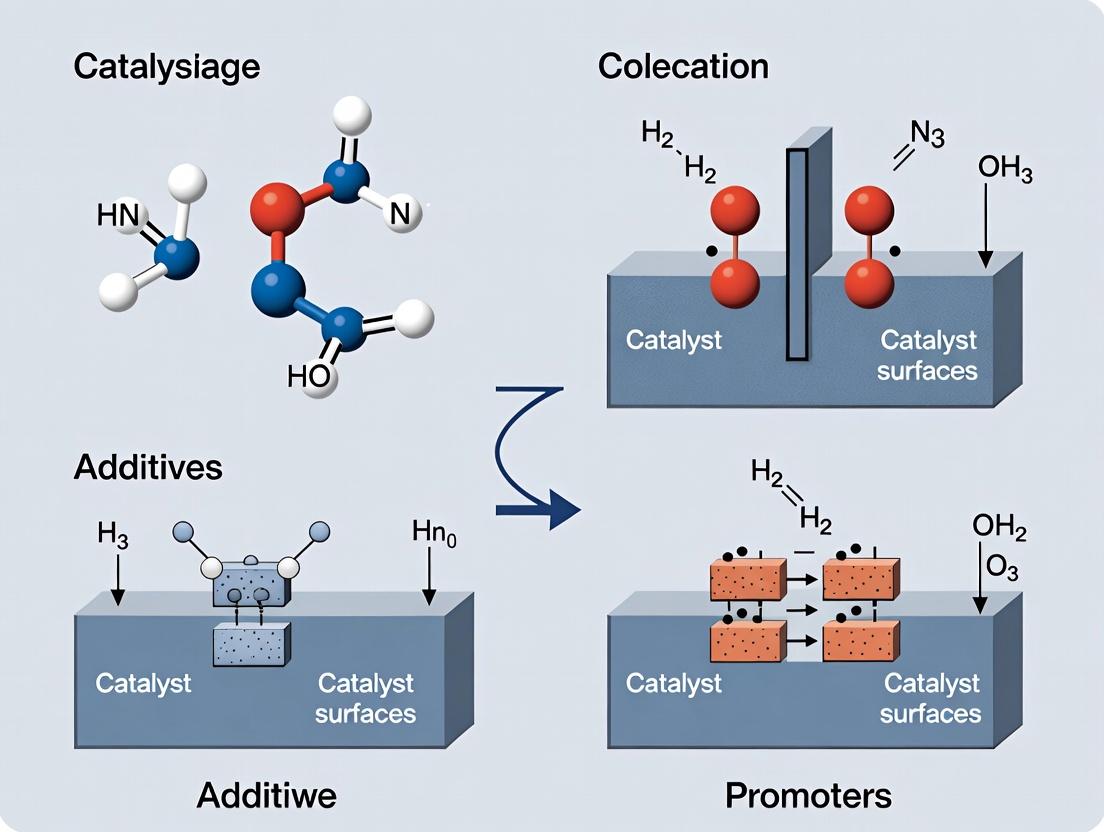
Within catalyst stability research, precise terminology is critical. Additives are substances added to a reaction mixture, often to modify the bulk reaction environment, scavenge impurities, or inhibit side reactions. Promoters are substances incorporated into the catalyst structure itself during preparation to electronically or structurally enhance its intrinsic activity, selectivity, or stability. This technical support center addresses common experimental challenges in this domain.
Troubleshooting Guides & FAQs
FAQ 1: Our catalyst deactivates rapidly in a hydrogenation reaction. Could this be a feedstock impurity issue, and should we use an additive? Answer: Rapid deactivation is often linked to feedstock impurities like sulfur compounds. A common troubleshooting step is to introduce a guard bed or a sacrificial additive (e.g., a metal oxide scavenger) to the feed. This is distinct from a promoter, which is part of the catalyst formulation. First, analyze your feedstock via GC-MS. If impurities are detected, consider adding a zinc oxide bed upstream as a scavenging additive.
Experimental Protocol: Feedstock Impurity Analysis & Mitigation
- Sample Analysis: Analyze feedstock using GC-MS (Gas Chromatography-Mass Spectrometry).
- Additive Test: If sulfur is present (>1 ppm), pack a secondary reactor tube with ZnO pellets (1-2 mm diameter) upstream of your main catalyst bed.
- Stability Test: Run the hydrogenation reaction at standard conditions (e.g., 150°C, 20 bar H₂).
- Monitor: Compare catalyst stability (conversion vs. time-on-stream) with and without the ZnO additive bed.
FAQ 2: How do we distinguish if a substance is acting as an additive or a promoter in our catalyst system? Answer: The key is the point of introduction and location of action. Promoters are added during catalyst synthesis (e.g., co-impregnation, co-precipitation). Additives are introduced to the reactor alongside reactants. Use post-reaction characterization (e.g., XPS, STEM-EDX) on spent catalyst. A promoter will be homogeneously distributed within the catalyst particles, while an additive may be found as a separate phase or only on the surface.
Experimental Protocol: Distinguishing Additive vs. Promoter
- Prepare Two Batches:
- Promoted Catalyst: Impregnate Al₂O₃ support with aqueous solutions of Ni(NO₃)₂ and Ce(NO₃)₃ (as a promoter candidate). Dry, calcine at 500°C.
- Unpromoted Catalyst + Additive: Impregnate Al₂O₃ with only Ni(NO₃)₂. Dry, calcine.
- Run Reaction: Perform a test reaction (e.g., CO₂ methanation).
- For the unpromoted catalyst, run a second experiment where Ce(NO₃)₃ is dissolved directly into the reactant feed (acting as an additive).
- Post-Reaction Analysis: Subject all spent catalysts to STEM-EDX.
- Expected Result: Ce in the first batch is uniformly distributed with Ni (Promoter). Ce in the additive experiment may appear as discrete deposits or only on the catalyst surface (Additive).
FAQ 3: We added a alkali metal as a promoter for stability, but activity plummeted. What went wrong? Answer: This is a classic case of over-promotion. Alkali metals are strong electronic promoters but can block active sites if loaded excessively. There is an optimal loading range, often below 2 wt%.
Experimental Protocol: Optimizing Promoter Loading
- Catalyst Series Synthesis: Using incipient wetness impregnation, prepare a series of Pt/Al₂O₃ catalysts with K⁺ promoter loadings of 0.5, 1.0, 1.5, and 2.5 wt%.
- Characterization & Testing: Characterize all catalysts via H₂-chemisorption (for active site count) and test for a structure-sensitive reaction like ethane dehydrogenation.
- Analysis: Plot promoter loading vs. turnover frequency (TOF) and vs. deactivation rate constant (kd). The goal is to find the loading that maximizes TOF while minimizing kd.
Data Presentation
Table 1: Comparison of Additives vs. Promoters
| Feature | Additive | Promoter |
|---|---|---|
| Primary Role | Modifies reaction environment, scavenges poisons. | Modifies intrinsic catalyst properties. |
| Introduction Point | Added to reactor feed/process stream. | Added during catalyst synthesis. |
| Location | Bulk phase or catalyst surface. | Integrated into catalyst structure. |
| Typical Examples | ZnO (S scavenger), organophosphines (selectivity modifier). | CeO₂ (structural promoter), K⁺ (electronic promoter). |
| Effect on Active Site | Indirect (protects or alters surroundings). | Direct (electronic, geometric modification). |
Table 2: Optimal Loading Ranges for Common Promoters
| Promoter | Catalyst System | Typical Optimal Loading (wt%) | Primary Effect on Stability |
|---|---|---|---|
| Potassium (K) | Fe-based Fischer-Tropsch | 0.5 - 1.2 | Increases carburization resistance, reduces coking. |
| Cerium (Ce) | Pd/Al₂O₃ for combustion | 2 - 5 | Enhances oxygen storage capacity, prevents sintering. |
| Tin (Sn) | Pt/Al₂O₃ for dehydrogenation | 0.3 - 1.0 | Dilutes Pt ensembles, reduces coke formation. |
| Lanthanum (La) | Ni/Al₂O₃ for reforming | 1 - 3 | Inhibits Ni-Al₂O₃ interaction, prevents spinel formation. |
Experimental Protocols
Protocol A: Testing a Sulfur Scavenging Additive Objective: Evaluate the efficacy of ZnO as a sacrificial additive for protecting a Ni catalyst from sulfur poisoning in a simulated syngas stream.
- Setup: Use a fixed-bed reactor. Load zone 1 with 0.5g ZnO powder mixed with SiC. Load zone 2 with 0.2g of the Ni/MgAl₂O₄ catalyst.
- Poisoned Feed: Use a H₂/CO/CO₂ mix with 50 ppm H₂S added.
- Procedure: Run at 750°C, 10 bar. Monitor CH₄ yield from methanation vs. time.
- Control: Repeat without the ZnO bed.
- Analysis: Compare the time to reach 50% activity loss for both runs.
Protocol B: Incorporating a Structural Promoter via Co-precipitation Objective: Synthesize a Cu/ZnO/Al₂O₃ methanol synthesis catalyst with ZrO₂ as a structural promoter.
- Solution Prep: Prepare 1M aqueous solutions of Cu(NO₃)₂, Zn(NO₃)₂, Al(NO₃)₃, and ZrO(NO₃)₂. Mix to target atomic ratios Cu:Zn:Al:Zr = 50:30:15:5.
- Precipitation: Heat the mixed solution to 70°C with stirring. Precipitate by adding 1M Na₂CO₃ solution dropwise until pH 7.0 is reached and maintained for 1 hour.
- Aging & Washing: Age the slurry at 70°C for 2 hours. Filter and wash thoroughly with deionized water until effluent conductivity < 100 µS/cm.
- Drying & Calcination: Dry the cake at 110°C for 12 hours. Calcine in static air at 350°C for 4 hours.
- Activation: Reduce the final catalyst in 5% H₂/N₂ at 250°C prior to testing.
Visualization
Diagram 1: Additive vs. Promoter Function in a Catalyst System
Diagram 2: Experimental Workflow for Promoter Optimization
The Scientist's Toolkit: Research Reagent Solutions
Table 3: Essential Materials for Catalyst Additive/Promoter Research
| Item | Function in Research | Example Use Case |
|---|---|---|
| High-Purity Metal Salts (Nitrates, Chlorides, Acetylacetonates) | Precursors for catalyst and promoter synthesis via impregnation. | Preparing a Pt-Sn/Al₂O₃ catalyst for alkane dehydrogenation. |
| Scavenger Additives (ZnO, CuO, Activated Carbon) | Remove specific impurities (S, Cl, organics) from feedstock to protect catalyst. | Using a ZnO guard bed in syngas conversion experiments. |
| Structural Promoter Precursors (Ce(NO₃)₃, La₂O₃, ZrOCl₂) | Enhance catalyst thermal stability and prevent sintering. | Adding Ce to a Pd-based combustion catalyst. |
| Electronic Promoter Precursors (K₂CO₃, CsNO₃, NH₄F) | Modify the electronic properties of active sites. | Using K to promote Fe catalysts for Fischer-Tropsch synthesis. |
| High Surface Area Supports (γ-Al₂O₃, SiO₂, TiO₂, Activated Carbon) | Provide a stable, dispersive matrix for active phases and promoters. | The foundational material for most supported catalyst systems. |
| Characterization Gases (5% H₂/Ar, CO, N₂O) | Used in chemisorption and TPR/TPD to measure active sites and reducibility. | Determining Pt dispersion on a promoted catalyst via H₂ chemisorption. |
Troubleshooting Guides & FAQs
Q1: Why is my cross-coupling reaction yield decreasing significantly upon scaling from 1 mmol to 10 mmol, despite using the same promoter (e.g., DMAP)?
A: This is a common issue in scale-up related to mixing efficiency and localized concentration gradients. At larger scales, inefficient stirring can cause poor dispersion of solid or viscous promoters, leading to suboptimal catalyst activation. Ensure your reaction vessel has appropriate baffles and that the stirring speed (RPM) is adjusted to maintain consistent mixing, not just matching the smaller scale's speed. Consider switching to a more soluble promoter analogue (e.g., 4-PPyr for DMAP) or pre-dissolving the promoter in a minimal amount of solvent before addition.
Q2: My ligand (e.g., BINAP) appears to degrade during a long-term hydrogenation reaction. How can I diagnose and prevent this?
A: Ligand degradation is a critical failure mode affecting catalyst stability and reproducibility. First, diagnose by taking periodic aliquots and analyzing via UPLC-MS for ligand decomposition products. Common causes are oxidation or P-C bond cleavage. Prevention strategies include:
- Additive: Introduce a stoichiometric mild reductant like 1,4-cyclohexadiene (0.5-1.0 equiv relative to substrate) to scavenge oxygen.
- Promoter: Use copper(I) iodide (2-5 mol%) as a stabilizing additive, which can coordinate and protect the phosphine ligand.
- Protocol: Ensure rigorous degassing of solvents and substrates via freeze-pump-thaw cycles or sparging with inert gas.
Q3: How can I improve the reproducibility of an enantioselective reaction when using a chiral amine organocatalyst that is hygroscopic?
A: Reproducibility issues often stem from variable water content, which can deactivate catalysts or alter reaction pathways.
- Solution: Implement a standardized catalyst handling protocol. Store the catalyst in a desiccator with self-indicating silica gel. Before use, dry the catalyst under high vacuum (<0.1 mBar) at 40°C for 2 hours. Consider using a molecular sieve (3Å) as an in-situ additive (10-20 mg/mL) in the reaction mixture to control water activity. Record ambient humidity during weighing for advanced process understanding.
Q4: The stabilization effect of my chosen additive (e.g., KI) on my Pd catalyst is not reproducible across different solvent batches. What could be the cause?
A: Trace impurities in solvents, particularly peroxides in ethers (THF, 1,4-dioxane) or stabilizers (BHT) in some CH₂Cl₂, can severely impact additive performance. Peroxides oxidize iodide (I⁻) to iodine (I₂), eliminating its role as a halide scavenger to stabilize Pd(0).
Protocol for Solvent Purification/Testing:
- Test for Peroxides: Shake 1 mL of solvent with 1 mL of 10% KI solution. A yellow color indicates peroxide presence.
- Purification: Pass solvent through a column of activated alumina. For THF, reflux over sodium/benzophenone until a deep blue color is achieved, then distill.
- Standardization: Use a single, high-purity solvent source for all critical stability experiments and document the brand/certificate of analysis.
Experimental Protocols
Protocol 1: Assessing Catalyst Stability via Turnover Number (TON) Decay Objective: Quantify the deactivation of a palladium cross-coupling catalyst with and without stabilizing additives.
- Setup: In a glovebox, prepare two 20 mL vial reactors each with Pd(OAc)₂ (0.005 mmol, 1.12 mg) and SPhos ligand (0.0125 mmol, 5.1 mg) in degassed toluene (5 mL). To the test vial, add benzoic acid additive (0.05 mmol, 6.1 mg).
- Reaction: Add aryl bromide substrate (5.0 mmol) and potassium phosphate base (7.5 mmol). Seal vials, remove from glovebox, and heat to 80°C with stirring at 800 RPM.
- Sampling: Take 50 µL aliquots at t = 1, 2, 4, 8, 16, and 24 hours. Quench in 1 mL of acetonitrile containing 0.1 mM dodecane as internal standard.
- Analysis: Analyze by GC-FID. Calculate TON = (moles product)/(moles Pd). Plot TON vs. time. A flatter curve with the additive indicates enhanced stability.
Protocol 2: Accelerated Stress Test for Ligand Oxidation Objective: Evaluate the effectiveness of radical scavenger additives in preventing phosphine ligand oxidation.
- Stress Solution: Prepare a 0.1 M solution of triphenylphosphine in degassed toluene.
- Additive Testing: Aliquot 2 mL into four GC vials. Add nothing (control), BHT (0.01 M), TEMPO (0.01 M), or hydroquinone (0.01 M).
- Stress Induction: Introduce a controlled air spike (10 µL) to each vial. Seal and agitate at 30°C.
- Monitoring: At t = 0, 2, 6, and 24 hours, analyze 0.1 mL by ³¹P NMR spectroscopy. Integrate peaks for intact PPh₃ (~ -5 ppm) and oxidized OPPh₃ (~ +25 ppm).
- Quantification: Calculate % ligand remaining = [PPh₃]/([PPh₃]+[OPPh₃]) * 100.
Data Presentation
Table 1: Impact of Carboxylic Acid Additives on Pd-Catalyzed Suzuki-Miyaura Yield & Stability
| Additive (10 mol%) | Yield at 1 h (%) | Yield at 24 h (%) | Final TON | [Pd] Leaching (ppm)* |
|---|---|---|---|---|
| None | 45 | 72 | 1440 | 15.2 |
| Acetic Acid | 68 | 95 | 1900 | 8.7 |
| Pivalic Acid | 75 | 98 | 1960 | 4.1 |
| Octanoic Acid | 60 | 90 | 1800 | 10.5 |
| Benzoic Acid | 71 | 97 | 1940 | 5.3 |
*Measured via ICP-MS of reaction filtrate.
Table 2: Cost-Benefit Analysis of Common Stabilizing Promoters
| Promoter | Cost per 5g (USD) | Effective Conc. (mol%) | Key Stability Mechanism | Primary Use Case |
|---|---|---|---|---|
| DMAP | 55.00 | 5 | Lewis Base Activation | Acylation, Pd-Catalyzed Amination |
| Copper(I) Iodide | 75.00 | 2 | Redox Buffering | Sonogashira, Ullmann Couplings |
| Tetrabutylammonium Iodide | 40.00 | 10 | Halide Anion Source | Heck, Cross-Couplings |
| 1,4-Cyclohexadiene | 120.00 | 50 | In-situ H₂ Source | Reduction without External H₂ Pressure |
| Molecular Sieves (3Å) | 25.00/50g | 10 mg/mL | Water Scavenging | Moisture-Sensitive Organocatalysis |
Diagrams
Title: Catalyst Deactivation & Stabilization Pathways
Title: Catalyst Stability Assessment Workflow
The Scientist's Toolkit: Research Reagent Solutions
| Item | Function in Catalyst Stability Research |
|---|---|
| Pivalic Acid | Carboxylic acid additive; mitigates Pd aggregation via formation of soluble Pd carboxylates, enhancing catalyst lifetime in C-H activation and cross-coupling. |
| Tetrabutylammonium Iodide (TBAI) | Halide source additive; maintains catalytically active Pd species in correct oxidation state, prevents formation of inactive Pd-black in Heck reactions. |
| Molecular Sieves (3Å) | Physical scavenger; removes trace water and alcohols from reaction mixtures, critical for reproducibility of moisture-sensitive organo- and metal-catalysis. |
| 1,4-Cyclohexadiene | Sacrificial hydrogen donor; provides in-situ H₂ for reductions, avoiding safety/reproducibility issues with external H₂ tanks, and can stabilize low-valent metal centers. |
| Copper(I) Iodide | Co-catalyst/Promoter; acts as a redox buffer and ligand stabilizer, preventing oxidation of precious phosphine ligands in Pd/Cu bimetallic systems. |
| BHT (Butylated Hydroxytoluene) | Radical scavenger; inhibits free-radical degradation pathways of organic ligands and sensitive substrates, improving batch-to-batch consistency. |
| DMAP (4-Dimethylaminopyridine) | Lewis base promoter; enhances electrophilicity of metal centers and acylating agents, allowing lower catalyst loadings and temperatures. |
| Deuterated Solvents with Stabilizers | NMR analysis; essential for in-situ reaction monitoring. Choose stabilizer-free versions (e.g., d⁸-Toluene) to avoid additive interference in mechanistic studies. |
Technical Support Center
Troubleshooting Guides & FAQs
Q1: Our supported palladium catalyst shows significant deactivation (≥40% yield drop) between steps 2 and 3 of our API synthesis. What are the most likely causes?
A: Rapid deactivation in mid-sequence is often linked to:
- Leaching of Active Metal: Ligand dissociation or oxidative addition complexes can solubilize Pd, removing it from the support.
- Poisoning by Step-Specific Byproducts: Amines, sulfur-containing impurities, or heavy metals from previous steps can irreversibly bind to catalytic sites.
- Support Degradation: The reaction medium (e.g., pH shift, solvent polarity) in the new step may compromise the catalyst's structural integrity.
- Coking/Fouling: Polymerization or degradation of sensitive intermediates can physically block pores and active sites.
Diagnostic Protocol: Run Inductively Coupled Plasma (ICP) analysis on the reaction filtrate from Step 2. Detectable Pd (>50 ppm) confirms leaching. Perform X-ray Photoelectron Spectroscopy (XPS) on spent catalyst; new peaks at ~168 eV indicate sulfur poisoning.
Q2: How can we differentiate between catalyst poisoning and thermal sintering as the failure mode?
A: Perform the following characterization suite on fresh and spent catalyst samples:
| Failure Mode | Diagnostic Technique | Key Quantitative Indicator | Threshold for Concern |
|---|---|---|---|
| Poisoning | XPS Surface Analysis | Atomic % of contaminant (S, Cl, etc.) on catalyst surface | >2% atomic concentration |
| Sintering | CO Chemisorption | Drop in Active Surface Area (ASA) | >30% reduction in ASA |
| Sintering | TEM Imaging | Increase in average metal nanoparticle size | >20% size increase |
| Leaching | ICP-MS of Filtrate | Pd concentration in solution | >100 ppm |
Experimental Protocol for CO Chemisorption:
- Degas 0.1 g of catalyst sample at 150°C under vacuum for 2 hours.
- Cool to 50°C and expose to calibrated doses of CO gas.
- Use the volumetric or pulse chemisorption method to calculate the volume of CO irreversibly adsorbed.
- Calculate metal dispersion: Dispersion (%) = (Number of surface metal atoms / Total number of metal atoms) × 100. A sharp decline indicates sintering.
Q3: What in-situ or online monitoring techniques are recommended to pinpoint the exact stage of deactivation?
A: Implement Flow-IR or PAT (Process Analytical Technology) probes.
- Technique: Attenuated Total Reflectance Fourier Transform Infrared (ATR-FTIR) spectroscopy with a flow cell.
- Protocol: Install the probe in a bypass loop from the main reactor. Monitor for the appearance of carbonyl species (1700-1750 cm⁻¹) or changes in intermediate concentrations that correlate with yield drop. A sudden change in reaction profile mid-step pinpoints the deactivation event.
Q4: Are there promoter additives that can prevent failure in multi-step environments?
A: Yes, strategic promoters enhance stability. Their selection depends on the failure mode.
| Promoter Class | Example Compounds | Primary Function | Recommended Loading (wt.%) |
|---|---|---|---|
| Structural Promoters | La₂O₃, CeO₂ | Stabilize support surface area, inhibit sintering. | 1-5% |
| Electronic Promoters | K⁺, Cs⁺ | Modify metal center electron density, resist poisoning. | 0.5-2% |
| Selectivity Promoters | Bi, Pb | Poison selective side reactions that lead to coking. | 0.1-1% |
| Leaching Inhibitors | N-Donor Ligands (e.g., Phenanthroline) | Enhance metal-ligand binding, reduce dissolution. | Molar ratio 1.5:1 (Ligand:Pd) |
Experimental Protocol for Promoter Screening:
- Impregnate your base catalyst (e.g., Pd/Al₂O₃) with aqueous solutions of promoter candidates (e.g., Ce(NO₃)₃, K₂CO₃).
- Dry at 120°C for 4 hours and calcine at 400°C (for inorganic promoters).
- Test each promoted catalyst in a simulated multi-step sequence using a model reaction in tandem reactors.
- Compare end-of-sequence yield and catalyst characterization data (ASA, leaching) to the unpromoted control.
Thesis Context: Additives & Promoters for Enhanced Catalyst Stability
This troubleshooting guide is framed within a research thesis positing that systematic application of tailored promoter packages can extend catalyst lifetime in multi-step API synthesis by pre-emptively addressing sequential, step-specific failure modes. The data above supports the thesis by providing diagnostic tools to identify specific failure mechanisms (leaching, poisoning, sintering) and correlating them with targeted promoter classes (leaching inhibitors, electronic promoters, structural promoters). The ultimate goal is a predictive model for catalyst stabilization.
The Scientist's Toolkit: Research Reagent Solutions
| Item | Function in Catalyst Stability Research |
|---|---|
| Cerium(III) Nitrate Hexahydrate | Precursor for CeO₂ structural promoter; inhibits support collapse and metal sintering. |
| 1,10-Phenanthroline | N-donor chelating ligand; modifies Pd coordination sphere to inhibit leaching. |
| Potassium Carbonate | Source of K⁺ electronic promoter; donates electron density to metal, resisting electrophilic poisons. |
| Thiophene (Standard) | Controlled poisoning agent for simulating sulfur contamination in stability stress tests. |
| Carbon Monoxide (99.99%) | Probe molecule for chemisorption experiments to measure active metal surface area. |
| Tetrahydrothiophene (Stability Standard) | Less volatile sulfur source for long-duration poisoning studies. |
Visualizations
Catalyst Failure Diagnosis & Remedy Flowchart
Multi-Step API Synthesis with Catalyst Deactivation
A Toolkit for Stability: Strategic Use of Additives and Promoters in Research
Technical Support Center: Troubleshooting & FAQs
Frequently Asked Questions (FAQs)
Q1: My supported metal nanoparticles on Al2O3 are sintering after repeated redox cycles at 600°C. What could be the cause and how can I mitigate this? A: This indicates a potential weakening of the Metal-Support Interaction (MSI). The primary cause is often the reduction of surface hydroxyl groups, which anchor metal particles, and phase transitions in the alumina support (e.g., γ-Al2O3 to θ-Al2O3). To mitigate:
- Pre-stabilization: Pre-calcine the Al2O3 support at a temperature 100°C above your reaction temperature to achieve a stable phase.
- Promoter Addition: Impregnate the support with a structural promoter like La2O3 or SiO2 (1-3 wt%) prior to metal loading. These dopants segregate to grain boundaries, inhibiting support sintering and stabilizing surface defects for metal anchoring.
- Protocol: Incipient wetness impregnation of Al2O3 with La(NO3)3 solution, followed by drying (120°C, 12h) and calcination (750°C, 4h). Then load your active metal.
Q2: I am using TiO2 (P25) as a support, but my catalyst deactivates rapidly under UV-vis irradiation in aqueous medium. What is happening? A: This is likely due to photo-corrosion of the TiO2 support and/or oxidative degradation of the catalytic metal (e.g., Pt, Pd) by photogenerated holes or reactive oxygen species. The support itself is becoming unstable.
- Solution: Apply a thin, conformal overcoat of a more stable oxide (e.g., SiO2, Al2O3) via Atomic Layer Deposition (ALD) to act as a barrier.
- Protocol: Use a benchtop ALD system. For a SiO2 overcoat, cycle Trimethylaluminum (TMA) and H2O pulses at 150°C for 20-50 cycles. Each cycle deposits ~0.1 nm. This creates a porous, protective layer that permits gas diffusion but inhibits direct charge transfer and corrosion.
Q3: During the deposition of Ni nanoparticles on SiO2 via impregnation, I'm getting poor dispersion and large crystallites after reduction. How can I improve dispersion? A: Amorphous SiO2 has low surface energy and minimal ionic character, leading to weak MSI. The issue is weak anchoring of Ni precursors during drying/calcination.
- Solution: Modify the SiO2 surface to create stronger electrostatic or chemical adsorption sites.
- Protocol (Surface Nitridation): Treat SiO2 under flowing NH3 (50 mL/min) at 800°C for 2 hours. This creates surface Si-NH2 and Si≡N groups. These basic sites strongly interact with anionic Ni complexes (e.g., from Ni nitrate) during impregnation, yielding higher dispersion after reduction.
Q4: My XRD analysis shows the loss of the anatase phase in my TiO2-supported catalyst after prolonged use at 450°C. How does this affect stability? A: Anatase to rutile phase transformation (ART) is a common issue. Rutile typically has lower surface area and different electronic properties, which can weaken MSI and lead to nanoparticle sintering.
- Prevention: Dope the TiO2 support with sulfate (SO4^2-) or tungsten (W^6+) ions. These act as structural promoters that stabilize the anatase phase by suppressing cation migration.
- Protocol: Co-precipitate TiCl4 with (NH4)2SO4 or (NH4)10W12O41. Adjust pH to 9 with NH4OH. Filter, wash, dry, and calcine at 500°C. The dopant concentration should be 1-5 mol%.
Table 1: Stabilizing Effect of Common Dopants on Oxide Supports
| Support | Dopant/Promoter (wt%) | Critical Sintering Temp. Increase | Key Stabilizing Mechanism | Reference System |
|---|---|---|---|---|
| γ-Al2O3 | La2O3 (3%) | +150°C | Inhibits θ/α-phase transition; stabilizes surface area | Pt/La-Al2O3 |
| TiO2 (Anatase) | SiO2 (5%) | +200°C (Phase) | Forms Ti-O-Si bonds, retarding ART | V2O5/Si-TiO2 |
| SiO2 | ZrO2 (10%) | +100°C | Increases surface acidity & anchor sites | Ni/Zr-SiO2 |
| CeO2 | SiO2 (ALD 20 cycles) | +300°C | Encapsulation layer restricts CeO2 particle migration | Pt/CeO2@SiO2 |
Table 2: Common Characterization Techniques for Support Stability
| Technique | Measured Parameter | Indicator of Stability | Typical Protocol |
|---|---|---|---|
| BET Surface Area | Specific Surface Area (m²/g) | Support sintering | N2 physisorption at 77K; sample degassed at 300°C for 3h. |
| XRD Crystallite Size | Crystallite size (nm) via Scherrer | Particle growth | Scan rate 2°/min in 20-80° 2θ range; use Si standard. |
| H2-TPR | Reduction temperature peak shift | Strength of Metal-Support Interaction | 50 mg sample, 5% H2/Ar, 10°C/min to 900°C. |
| In Situ Raman | Phase-specific bands (e.g., Anatase vs. Rutile) | Phase stability | Use high-temperature cell; 532 nm laser; track band intensity vs. T. |
Experimental Protocols
Protocol 1: Synthesis of La-Stabilized γ-Al2O3 Support Objective: To prepare a thermally stable alumina support resistant to phase transition up to 900°C. Materials: γ-Al2O3 powder (150 m²/g), La(NO3)3·6H2O, deionized water. Steps:
- Dissolve 1.53g La(NO3)3·6H2O in 10mL DI water to make a 1M solution.
- Use incipient wetness impregnation: Slowly add the solution dropwise to 5g of γ-Al2O3 while stirring until a homogeneous paste forms.
- Age the paste at room temperature for 2 hours.
- Dry at 120°C in an oven for 12 hours.
- Calcine in a muffle furnace with a ramp rate of 5°C/min to 750°C, hold for 4 hours, then cool naturally.
- Characterize via XRD to confirm absence of LaAlO3 formation and BET for surface area retention.
Protocol 2: ALD Overcoating of Pt/TiO2 with Al2O3 for Photostability Objective: Apply a sub-nanometer Al2O3 barrier to prevent photo-corrosion. Materials: Pre-synthesized Pt/TiO2 catalyst, Trimethylaluminum (TMA) precursor, H2O precursor, N2 carrier gas. Steps:
- Load 200mg of Pt/TiO2 powder into an ALD reactor chamber.
- Heat the chamber to 150°C under a continuous N2 flow (20 sccm).
- Execute the following cycle 15 times:
- Pulse TMA for 0.1s.
- N2 purge for 10s.
- Pulse H2O for 0.1s.
- N2 purge for 10s.
- Each cycle deposits ~0.11 Å of Al2O3, resulting in an ultra-thin, conformal layer that allows reactant access while protecting the TiO2 interface.
Visualizations
Diagram 1: Stabilizing Mechanisms of Oxide Supports
Diagram 2: Workflow for Testing Support Stability
The Scientist's Toolkit: Research Reagent Solutions
| Item | Function & Role in Support Stabilization |
|---|---|
| Lanthanum(III) Nitrate Hexahydrate | Precursor for La2O3 dopant. Inhibits Al2O3 phase transition via formation of LaAlO3 perovskite surface layers. |
| Tetraethyl orthosilicate (TEOS) | SiO2 precursor for sol-gel coating or doping. Enhances thermal stability and can form protective overcoats. |
| Ammonium Metatungstate | Source of W^6+ for doping TiO2. Suppresses anatase-to-rutile transformation by substituting for Ti^4+. |
| Trimethylaluminum (TMA) | ALD precursor for depositing ultrathin, conformal Al2O3 barrier layers to prevent sintering/corrosion. |
| Zirconyl Chloride Octahydrate | ZrO2 precursor for creating "mixed oxide" supports (e.g., Zr-SiO2) to enhance acidity and thermal stability. |
| Nitric Acid (1M) | Common aqueous medium for incipient wetness impregnation, especially for nitrate-based precursors. |
| Ammonia Gas (Anhydrous) | Used for gas-phase nitridation of SiO2 surfaces to create basic N-sites for improved metal anchoring. |
Troubleshooting Guides & FAQs
FAQ: Common Issues in Promoter Addition Experiments
Q1: After adding an alkali metal promoter (e.g., K), our catalyst shows a severe drop in activity, not an enhancement. What went wrong? A: This is typically due to over-promotion. Excessive alkali loading blocks active sites instead of electronically modifying them.
- Troubleshooting Steps:
- Quantify Loading: Verify the actual promoter loading via ICP-MS or AAS. Compare to the target loading (often in the 0.1-2 wt% range).
- Check Dispersion: Use CO chemisorption or STEM-EDS mapping to assess if the promoter is uniformly dispersed or has formed large, blocking clusters.
- Protocol - Titration of Optimal Loading:
- Prepare a series of catalysts via incipient wetness impregnation with a KNO₃ solution of varying molarity onto your support (e.g., γ-Al₂O₃).
- Dry at 120°C for 12 hours and calcine at 500°C for 4 hours.
- Test all samples in your standard reaction (e.g., CO hydrogenation) under identical conditions (T, P, GHSV).
- Plot activity (e.g., conversion rate) vs. K loading. Expect a volcano curve; the peak is the optimal loading.
Q2: Our rare earth oxide promoter (e.g., CeO₂) sinters after repeated reduction-oxidation cycles, losing its stabilizing effect. How can we improve its stability? A: Sintering indicates weak interaction with the primary catalyst support.
- Troubleshooting Steps:
- Stabilize with a Structural Promoter: Co-impregnate the rare earth with a structural stabilizer like ZrO₂ or Al₂O₃.
- Modify Synthesis Method: Switch from simple impregnation to a more advanced method like deposition-precipitation or sol-gel synthesis to achieve stronger metal-support bonding.
- Protocol - Sol-Gel Synthesis for Stable CeO₂ Promotion:
- Dissolve cerium(III) nitrate and your catalyst metal precursor (e.g., nickel nitrate) in ethanol.
- Add a chelating agent (e.g., citric acid) under continuous stirring.
- Heat the mixture at 80°C under reflux to form a gel.
- Dry the gel at 120°C overnight and calcine at 600°C for 5 hours in air. This creates a homogeneous, sinter-resistant mixed oxide.
Q3: How do we distinguish between an electronic promoter effect and a simple site-blocking effect? A: Characterize the change in electronic properties of the active site.
- Troubleshooting Steps:
- Conduct XPS Analysis: Measure the binding energy shift of the active metal's core level (e.g., Ni 2p, Co 2p) before and after promotion. A negative shift indicates electron donation (electronic promotion).
- Perform Probe Molecule IR Spectroscopy: Use CO as a probe. A downward shift in the C-O stretching frequency (e.g., from 2050 cm⁻¹ to 2010 cm⁻¹) confirms increased back-donation from the metal, signifying electronic modification.
- Correlate with Activity: The electronic effect should correlate with a change in specific activity (turnover frequency, TOF), not just total conversion.
Q4: During co-impregnation of K and Mo precursors, we observe precipitate formation. How do we avoid this? A: This is a compatibility issue between acidic and basic precursor solutions.
- Troubleshooting Steps:
- Sequential Impregnation: Impregnate with the first metal salt (e.g., ammonium heptamolybdate), then dry and calcine. Subsequently, impregnate with the K salt.
- Use Compatible Precursors: Switch to precursors with similar pH profiles. For example, use potassium heptamolybdate if available, or dissolve components in separate, pH-adjusted waters before carefully mixing.
- Increase Volume/Use Complexing Agents: Use a larger volume of dilute solutions or add a complexing agent like citric acid to sequester metals and prevent salt precipitation.
Table 1: Effect of Alkali Metal Promoters on Iron-Based Fischer-Tropsch Catalyst Performance
| Promoter (1 wt%) | CO Conversion (%) | C₅⁺ Selectivity (%) | CH₄ Selectivity (%) | TOF (s⁻¹) | Reference Note |
|---|---|---|---|---|---|
| None | 45 | 65 | 15 | 0.021 | Baseline |
| Li | 48 | 68 | 14 | 0.022 | Mild effect |
| Na | 52 | 72 | 12 | 0.025 | Optimal for cost |
| K | 58 | 78 | 10 | 0.028 | Best performer |
| Cs | 50 | 75 | 11 | 0.020 | Site blocking at 1 wt% |
Table 2: Impact of Rare Earth Oxides on Ni/Al₂O₃ Steam Reforming Catalyst Stability
| Additive (5 wt%) | Initial Activity (mol/g·h) | Activity after 100h (mol/g·h) | % Activity Retention | Avg. Ni Crystallite Size after test (nm) |
|---|---|---|---|---|
| None | 5.2 | 3.1 | 60% | 24.5 |
| La₂O₃ | 4.9 | 3.9 | 80% | 18.0 |
| CeO₂ | 5.1 | 4.4 | 86% | 15.5 |
| Y₂O₃ | 4.8 | 3.7 | 77% | 19.2 |
Experimental Protocol: Determining the Optimal K Promotion Level for a Co/Mn Fischer-Tropsch Catalyst
Objective: To systematically identify the potassium loading that maximizes the turnover frequency (TOF) for CO hydrogenation.
Materials: See "The Scientist's Toolkit" below.
Method:
- Catalyst Preparation (Incipient Wetness Impregnation Series):
- Prepare six samples of 5%Co/10%Mn on SiO₂ support (pre-calcined).
- Prepare aqueous KNO₃ solutions to yield final K loadings of 0, 0.3, 0.6, 0.9, 1.2, and 1.5 wt% after impregnation and calcination.
- Add each solution dropwise to separate 5g catalyst batches until pore saturation.
- Age for 2 hours, dry at 110°C for 12 hours, and calcine in static air at 400°C for 4 hours.
Standardized Reduction & Activation:
- Load 100mg of each catalyst into a plug-flow microreactor.
- Purge with N₂ at 30 mL/min, heat to 400°C at 5°C/min.
- Switch to 5% H₂/Ar at 30 mL/min and hold for 6 hours.
- Cool in H₂/Ar to reaction temperature (220°C).
Kinetic Measurement:
- Switch to reactant feed (H₂:CO:Ar = 60:30:10, total flow 50 mL/min).
- After 2 hours stabilization, collect data for 1 hour.
- Analyze effluent by online GC (TCD for permanent gases, FID for hydrocarbons).
- Calculate CO conversion and product distribution.
- Perform CO chemisorption (pulse method) on a separate, identically prepared and reduced sample to determine active site count for TOF calculation.
Data Analysis:
- Plot CO conversion, C₅⁺ selectivity, and TOF versus K loading.
- The K loading yielding the maximum TOF is identified as the optimal electronic promotion level before site blocking dominates.
Visualizations
Diagram Title: Mechanism of Promoter Action on Catalyst Properties
Diagram Title: Workflow for Optimizing Promoter Loading
The Scientist's Toolkit
Table 3: Key Research Reagent Solutions for Promoter Studies
| Item / Reagent | Function / Purpose in Experiment |
|---|---|
| Potassium Nitrate (KNO₃) | Common, water-soluble precursor for alkali (K) promotion. Decomposes to K₂O upon calcination. |
| Cerium(III) Nitrate Hexahydrate | Standard precursor for introducing reducible rare earth oxide (CeO₂) promoters. |
| Ammonium Heptamolybdate | Source of Mo for preparing Mo-based catalysts, often used with alkali promoters. |
| Citric Acid | Chelating agent in sol-gel synthesis to homogenize metal distribution and improve stability. |
| CO Gas Cylinder (5% in He/Ar) | For pulse chemisorption to count active metal sites and for IR spectroscopy as a probe molecule. |
| High-Purity H₂/Ar Mixtures | For standardized catalyst reduction and activation prior to reaction testing. |
| Silica (SiO₂) / Alumina (γ-Al₂O₃) Supports | High-surface-area, inert supports for depositing active metals and promoters. |
| Internal Standard Gases (e.g., 1% Ne in Ar) | For accurate calibration and quantification in gas chromatography during kinetic runs. |
Technical Support Center
Troubleshooting Guides & FAQs
Q1: During the application of an Al₂O₃ refractory coating via atomic layer deposition (ALD) on our Ni catalyst, we observe non-uniform coating and patchy coverage. What could be the cause and how can we resolve it?
A: This is typically due to incomplete precursor purge or surface contamination. Ensure your substrate is thoroughly cleaned with an O₂ plasma or UV-ozone treatment for 15 minutes prior to loading into the ALD chamber. Optimize your ALD cycle: for trimethylaluminum (TMA) and H₂O at 150°C, use a pulse time of 0.1s, followed by a 60s purge with high-purity N₂ (≥99.999%). Monitor growth per cycle (GPC) using in-situ ellipsometry; target a consistent GPC of ~1.1 Å/cycle. If patchiness persists, reduce the substrate temperature to 120°C to mitigate precursor decomposition.
Q2: Our PtCo alloy catalyst, designed for high-temperature reactions, shows severe Co leaching in acidic reaction media (pH 3) after 20 hours. How can we improve the alloy stability?
A: Co leaching indicates insufficient alloying or surface segregation. First, verify complete alloy formation using XRD to confirm a single-phase FCC structure and XPS to check for metallic Co surface species. Implement a post-synthesis annealing step at 700°C under 5% H₂/Ar for 2 hours to promote homogeneous alloying. For enhanced stability, consider incorporating a small amount (2-5 at.%) of a third, less-noble refractory element like Ta or W. These elements migrate to the surface under reaction conditions, forming stable oxide patches that protect Co from dissolution.
Q3: When testing a ZrO₂-coated Pd catalyst for methane oxidation, we see a drastic loss in activity (>50%) above 600°C compared to the uncoated catalyst. Is this expected?
A: A 50% loss is excessive and suggests the coating is blocking active sites. The goal is to create a porous, non-continuous coating that stabilizes particle boundaries. Re-evaluate your coating thickness. Data suggests an optimal thickness exists:
Table 1: Catalyst Activity vs. Coating Thickness for Methane Oxidation at 650°C
| Coating Material | Coating Thickness (nm) | Relative Activity (%) | Sintering Resistance (Particle Growth after 50h) |
|---|---|---|---|
| None (Pd only) | 0 | 100 | 250% |
| ZrO₂ | 0.5 | 95 | 20% |
| ZrO₂ | 2.0 | 60 | 5% |
| ZrO₂ | 5.0 | 30 | <2% |
Protocol: Use a lower number of ALD cycles to achieve a sub-monolayer to ~2nm coating. Test activity in a gradient furnace to find the temperature at which deactivation begins, and correlate this with TEM analysis of the coating morphology.
Q4: In our Pt-M (M = Re, Sn, La) alloy system, how do we definitively confirm that the additive is acting as an anti-sintering agent versus a mere structural promoter?
A: This requires a combination of in-situ and post-mortem characterization. Follow this protocol:
- Synthesis: Prepare catalysts via incipient wetness co-impregnation with H₂PtCl₆ and additive nitrate salts, followed by calcination at 400°C and reduction at 500°C.
- Aging Test: Subject samples to a stream of 10% O₂/N₂ at 700°C for 24 hours (accelerated aging).
- Analysis: Perform identical location TEM (IL-TEM) on the same particle ensemble before and after aging. Use CO chemisorption to measure active site loss.
- Interpretation: If the additive is an anti-sintering agent, IL-TEM will show minimal particle migration and coalescence, but chemisorption may still drop due to site blocking. A structural promoter would show particle growth but a lower-than-expected loss in chemisorption. XPS binding energy shifts >0.3 eV for Pt indicate strong electronic interaction suggestive of alloying for sintering inhibition.
Research Reagent Solutions Toolkit
Table 2: Essential Materials for Anti-Sintering Research
| Item & Supplier Example | Function in Research |
|---|---|
| Trimethylaluminum (TMA), STREM Chemicals | Precursor for Al₂O₃ ALD coatings. Forms uniform, conformal refractory layers. |
| Zirconium(IV) tert-butoxide (ZTB), Sigma-Aldrich | Precursor for ZrO₂ ALD coatings. Provides high thermal stability and acidity. |
| Chloroplatinic Acid Hexahydrate (H₂PtCl₆•6H₂O), Alfa Aesar | Standard Pt precursor for impregnation methods. |
| Ceria-Zirconia Support (Ce₀.₅Zr₀.₅O₂), Daiichi Kigenso | High-OSC support material; itself can act as a structural anti-sintering barrier. |
| Tungsten Hexacarbonyl (W(CO)₆), Sigma-Aldrich | Source for refractory W metal via chemical vapor deposition or decomposition for alloying. |
| In-situ FTIR Cell (e.g., Praying Mantis, Harrick) | Allows real-time monitoring of surface species and active site coverage during reaction. |
Experimental Workflow for Evaluating Anti-Sintering Agents
Anti-Sintering Agent Evaluation Workflow
Signaling Pathway: Anti-Sintering Mechanisms at Atomic Scale
Atomic-Scale Anti-Sintering Mechanisms
Technical Support Center
Troubleshooting Guides & FAQs
Q1: Our guard bed is experiencing rapid pressure drop. What could be the cause and how can we resolve it? A: Rapid pressure drop indicates physical fouling or plugging. Common causes are fine particulate impurities in the feed or excessive carbon formation (coking).
- Troubleshooting Steps:
- Analyze Feed: Filter a feed sample through a 0.45 µm membrane. Measure particulate concentration.
- Inspect Bed: If possible, take a core sample from the top of the guard bed. Look for agglomerated material.
- Check Conditions: Review operating temperature and space velocity. Low temperatures can lead to condensation and agglomeration of heavy impurities.
- Solutions:
- Install an upstream particulate filter (e.g., 5-10 µm rated).
- Increase the guard bed operating temperature by 10-20°C, if compatible with the sacrificial component, to prevent condensation.
- Implement a more frequent regeneration cycle if coking is confirmed.
Q2: The sacrificial component in our fixed-bed reactor is being depleted unevenly, forming "channels." How do we fix this? A: Channeling indicates poor flow distribution, leading to preferential paths and reduced guard efficiency.
- Troubleshooting Steps:
- Validate Reactor Loading: Ensure the sacrificial adsorbent/catalyst and inert diluent are mixed uniformly during loading.
- Check Bed Support: Inspect the reactor's support screen or ballast layer for damage or clogging.
- Use Tracer Test: Perform a non-reactive tracer study (e.g., using helium) to diagnose flow maldistribution.
- Solutions:
- Reload the reactor using a validated sock-loading or dense-loading technique.
- Install a more robust bed support system or add a layer of inert ceramic balls above/below the bed.
- Redesign the feed distributor to ensure even flow across the bed diameter.
Q3: How do I quantitatively determine when to replace a sacrificial guard bed? A: Replacement is based on breakthrough of the target impurity.
- Protocol:
- Establish Baseline: Using a clean feed, measure the outlet concentration of the key poison (e.g., Hg, As, S, Cl) after the guard bed via ICP-MS or online GC with a sulfur/chlorine detector.
- Set Threshold: Define the maximum allowable impurity concentration at the inlet of your primary catalyst (e.g., 10 ppb for As).
- Monitor Continuously: Install an online analyzer or take frequent samples downstream of the guard bed.
- Calculate Capacity: The guard bed is exhausted when the outlet concentration exceeds your threshold. The total poison captured (mg) = ∫(Inlet Conc - Outlet Conc) * Flow Rate over time.
Q4: Our promoted catalyst still deactivates despite a guard bed. Are the additives incompatible? A: This suggests the guard bed is not targeting all deactivating species, or the promoter is being stripped.
- Troubleshooting Steps:
- Characterize Spent Catalyst: Use XPS or EDS on deactivated catalyst pellets to identify new poisons on the surface not present in the fresh catalyst.
- Analyze Guard Bed Effluent: Perform full speciation analysis (not just total S or Cl) to identify specific compounds slipping through.
- Check for Promoter Volatility: At operating temperature, some metal promoters (e.g., K, Re) can become volatile and be stripped by gas flow.
- Solutions:
- Redesign the guard bed as a layered or multi-functional system (e.g., a ZnO layer for H₂S, followed by a activated carbon layer for organochlorides).
- Consider a sacrificial promoter "getter" bed—a material that selectively adsorbs the volatile promoter to protect the main catalyst.
- Modify the primary catalyst's promoter loading to account for a predictable loss.
Table 1: Common Guard Bed Materials & Performance Data
| Material (Sacrificial Component) | Target Impurity | Typical Operating Temp (°C) | Theoretical Capacity (g impurity/kg sorbent) | Key Mechanism | Regenerable? |
|---|---|---|---|---|---|
| ZnO | H₂S, Mercaptans | 200 - 400 | 150-300 (as S) | Chemisorption to ZnS | No (Irreversible) |
| CuO on Al₂O₃ | O₂, CO | 150 - 300 | ~50 (as O₂) | Reduction to Cu/Cu₂O | Yes (with O₂) |
| Activated Carbon | Organic Chlorides, Hg | 50 - 150 | 10-20 (as Cl), 10-100 (as Hg) | Physisorption/Amalgamation | Partially (Thermal) |
| Na₂O/Al₂O₃ | HCl, COS | 300 - 400 | 100-200 (as Cl) | Reaction to NaCl | No |
| Pd-based Getter | O₂, Traces of H₂ | RT - 100 | High (stoichiometric) | Catalytic combustion/Adsorption | No |
Table 2: Troubleshooting Flow Diagnostics
| Symptom | Likely Cause | Diagnostic Test | Corrective Action |
|---|---|---|---|
| High ΔP at Inlet | Feed Fines, Coking | Feed Filtration, Bed Sampling | Pre-filtration, Increase Temp |
| High ΔP at Outlet | Fines Migration, Support Failure | Bed Sampling, ΔP Profile | Reload Bed, Fix Support |
| Early Breakthrough | Channeling, Low Capacity | Tracer Test, Material Analysis | Reload Bed, Replace Sorbent |
| Poison Slip | Wrong Sorbent, New Species | Effluent Speciation (GC-MS, ICP) | Re-design Guard Bed Stack |
Experimental Protocols
Protocol 1: Determination of Guard Bed Dynamic Breakthrough Capacity Objective: To measure the effective impurity adsorption capacity of a sacrificial material under simulated process conditions.
- Pack a laboratory-scale tubular reactor (ID = 1 cm) with a known mass (e.g., 5.0g) of guard bed material.
- Condition the material in situ under inert gas (N₂) at the test temperature (e.g., 350°C) for 2 hours.
- Switch feed to a simulated process stream containing a known, calibrated concentration of the target impurity (e.g., 1000 ppm H₂S in H₂) at a fixed gas hourly space velocity (GHSV, e.g., 3000 h⁻¹).
- Monitor the effluent stream continuously using an online analyzer (e.g., GC with TCD/FPD) or at regular intervals via sampling loops.
- Record the time (t_break) when the effluent impurity concentration reaches 5% of the inlet concentration.
- Calculate: Capacity (g/kg) = [(Inlet Conc. g/ml) * (Flow Rate ml/min) * (t_break min)] / [Mass of Sorbent (kg)].
Protocol 2: Accelerated Aging Test for Promoter-Stabilized Catalysts Objective: To evaluate the synergistic effect of a poison-resistant additive and an upstream guard bed.
- Prepare two identical reactors. Load one with only the promoted catalyst (Control). Load the second with a upstream guard bed layer followed by the same promoted catalyst (Test).
- Subject both systems to an accelerated poison feed. This feed contains the primary poison (e.g., thiophene) at 10x the expected concentration, but at a proportionally lower GHSV to maintain the same total poison per catalyst mass.
- Measure the primary reaction's activity (e.g., conversion %) and selectivity every 12 hours.
- Continue the test until the Control reactor's activity drops to 50% of its initial value.
- Analyze the spent catalysts from both reactors using techniques like TPO (for coke), XPS (for surface poison), and TEM (for particle sintering).
- Quantify the stability enhancement as the relative activity of the Test system vs. the Control system at the end of the run.
Diagrams
Title: Layered Guard Bed Configuration for Multi-Impurity Removal
Title: Experimental Workflow for Guard Bed-Catalyst System Testing
The Scientist's Toolkit: Research Reagent Solutions
Table 3: Essential Materials for Poison-Tolerance Experiments
| Item | Function/Description | Example Supplier/Catalog |
|---|---|---|
| Model Poison Compounds | High-purity chemicals to dope feed streams for controlled deactivation studies. | Thiophene (Sigma-Aldrich, #T40102): Common sulfur poison. Chlorobenzene (Sigma-Aldrich, #186302): Common chlorine source. Nickel Carbonyl (Strem, #93-0300): For metal vapor poison. |
| Sacrificial Sorbents | Bench-scale quantities of guard bed materials for testing. | High-Capacity ZnO (BASF, #8x12 mesh). Impregnated Activated Carbon (Calgon, #PCB 12x30). CuO/ZnO/Al₂O₃ (commercial water-gas shift catalyst as O₂/H₂S getter). |
| Fixed-Bed Microreactor System | Integrated system for catalyst/sorbent testing at controlled conditions. | PID Eng & Tech (Microactivity Effi). Altamira (AMI-200). In-house built with Brooks mass flow controllers and Swagelok tubing. |
| Online Gas Analyzer | For real-time monitoring of poison breakthrough. | Gas Chromatograph with Pulsed Flame Photometric Detector (PFPD) for S/Cl speciation (Agilent). Mass Spectrometer for rapid multi-component analysis (Hiden, QGA). |
| Calibration Gas Mixtures | Certified standards for quantifying poison concentrations. | Custom Mixtures in balance gas (e.g., 1000 ppm H₂S in H₂, 100 ppm CH₃Cl in N₂) (Air Liquide, Scott Specialty Gases). |
| Reference Catalysts | Standard promoted catalysts with known stability profiles for benchmark studies. | EUROPT-1 (Pt/SiO₂) for hydrogenation. NIST reference materials for supported metals. |
Troubleshooting Guides & FAQs
FAQ 1: Why does my impregnated catalyst exhibit poor stabilizer distribution after drying?
- Issue: Stabilizer migration to the outer surface of the catalyst pellet or support during drying, leading to a non-uniform shell-like distribution.
- Cause: Rapid drying at high temperatures causes capillary action to pull the dissolved stabilizer salt to the exterior as the solvent evaporates.
- Solution: Implement a slow, controlled drying process. Use a programmed oven ramp (e.g., 1°C/min from room temperature to 60°C, hold for 2 hours, then 1°C/min to final drying temperature of 110°C). Alternatively, use rotary evaporation or vacuum drying for thin films or powders.
FAQ 2: During co-precipitation, how can I prevent premature phase segregation of the stabilizer?
- Issue: The stabilizer precipitates at a different pH or rate than the active metal phase, resulting in separate phases rather than a homogeneous mixed solid.
- Cause: Significant difference in the solubility products (Ksp) or hydrolysis pH of the metal and stabilizer cations.
- Solution: Use a "homogeneous precipitation" technique. Employ a urea decomposition method (heating to 90-100°C) to slowly and uniformly raise the pH throughout the solution. Alternatively, use complexing agents (e.g., citric acid, EDTA) that bind both metals, releasing them gradually upon pH adjustment or temperature increase.
FAQ 3: My stabilized catalyst shows lower initial activity than the unstabilized one. Is this expected?
- Answer: Yes, often initially. Stabilizers like CeO₂, ZrO₂, or La₂O₃ can partially block active sites or alter the electronic properties of the active phase. The key metric is not initial activity alone but activity retention over time under harsh conditions (e.g., high temperature, steam). A moderate initial activity drop is acceptable if the deactivation rate is significantly slowed.
FAQ 4: What is the optimal stabilizer loading range for alumina-supported catalysts?
- Answer: Optimal loading is highly system-dependent but typically follows a threshold effect. Common ranges for structural stabilizers like La or Ba are 1-5 wt%. Excessive loading (>10 wt%) can lead to surface coverage, pore blockage, and the formation of separate stabilizer phases that do not interact beneficially with the active component.
FAQ 5: How do I characterize the interaction between the stabilizer and the active phase?
- Guidance: Use a combination of techniques:
- X-ray Diffraction (XRD): Check for formation of mixed oxides or alloy phases (peak shifts) versus separate phases.
- Temperature-Programmed Reduction (TPR): Assess how the stabilizer modifies the reducibility of the active metal (shift in reduction peaks).
- X-ray Photoelectron Spectroscopy (XPS): Determine surface composition and identify chemical states (e.g., binding energy shifts indicating strong metal-stabilizer interaction).
- CO Chemisorption: Quantify accessible active metal sites before and after stabilization and aging.
Data Presentation
Table 1: Comparison of Stabilizer Incorporation Methods
| Feature | Wet Impregnation | Co-precipitation |
|---|---|---|
| Uniformity | Moderate to Low (often surface-rich) | High (atomic-level mixing possible) |
| Complexity | Simple, low-cost | More complex, requires pH control |
| Best For | Porous supports (Al₂O₃, SiO₂), low loadings (<10 wt%) | Bulk catalysts, high loadings, mixed oxides |
| Key Challenge | Stabilizer migration during drying | Controlling precipitation kinetics & pH |
| Typical Calcination Temp | 400-600°C | 500-800°C |
| Common Stabilizers Used | La(NO₃)₃, Ce(NO₃)₃, Mg(NO₃)₂ | La³⁺, Ce³⁺, Zr⁴⁺ salts with Ni²⁺, Co²⁺ |
Table 2: Effect of La₂O₃ Stabilizer on Ni/Al₂O₃ Catalyst Stability in Dry Reforming of Methane
| Catalyst (3 wt% La) | Initial CH₄ Conversion (%) at 750°C | CH₄ Conversion after 50h (%) | % Activity Loss | Coke Deposition (mgC/gcat) |
|---|---|---|---|---|
| Unstabilized Ni/Al₂O₃ | 88 | 52 | 40.9 | 120 |
| La-impregnated (Post) | 85 | 65 | 23.5 | 75 |
| La-co-precipitated | 82 | 78 | 4.9 | 28 |
Experimental Protocols
Protocol 1: Incipient Wetness Impregnation of La-Stabilized Ni/Al₂O₃
- Support Preparation: Dry γ-Al₂O₃ support pellets (250-500 µm) at 120°C for 2 hours. Cool in a desiccator.
- Pore Volume Determination: Calculate the water pore volume by slowly adding water to 1g of support until incipient wetness.
- Impregnation Solution: Prepare an aqueous solution containing stoichiometric amounts of Ni(NO₃)₂·6H₂O and La(NO₃)₃·6H₂O to achieve target loadings (e.g., 10 wt% Ni, 3 wt% La). The solution volume must equal the total pore volume of the support batch.
- Impregnation: Add the solution dropwise to the support under continuous stirring. Ensure uniform wetting.
- Aging: Cover and let stand at room temperature for 12 hours.
- Drying: Dry in a static oven using a controlled ramp (1°C/min to 60°C, hold 2h, then 1°C/min to 110°C, hold 12h).
- Calcination: Calcine in a muffle furnace at 500°C for 4 hours (ramp: 5°C/min) in static air.
Protocol 2: Co-precipitation Synthesis of Ni-ZrO₂ Stabilized Catalyst
- Solution Preparation:
- Solution A: Dissolve Ni(NO₃)₂·6H₂O and ZrO(NO₃)₂·xH₂O in deionized water (total metal concentration = 0.5 M, Ni:Zr molar ratio = 7:3).
- Solution B: Prepare a 1.0 M Na₂CO₃ precipitation agent.
- Precipitation: Heat Solution A to 70°C with vigorous stirring. Titrate Solution B into Solution A at a constant rate of 2 mL/min using a peristaltic pump until pH 8.0 is reached. Maintain pH at 8.0 ± 0.1 for 1 hour by continued addition of Solution B.
- Aging & Washing: Age the slurry at 70°C for 2 hours. Filter the precipitate and wash with hot deionized water (70°C) until the conductivity of the filtrate is < 100 µS/cm (to remove Na⁺ and NO³⁻ ions).
- Drying: Dry the filter cake at 110°C for 24 hours.
- Calcination: Calcine the dried powder at 600°C for 5 hours (ramp: 2°C/min) in flowing air (50 mL/min).
- Reduction (Pre-reduction Option): Reduce the calcined powder in a flow of 5% H₂/Ar at 500°C for 2 hours before catalytic testing.
Visualizations
Synthesis Method Decision & Workflow
Deactivation Mechanisms & Stabilizer Roles
The Scientist's Toolkit: Research Reagent Solutions
| Reagent / Material | Primary Function in Stabilization |
|---|---|
| Lanthanum Nitrate (La(NO₃)₃·6H₂O) | Precursor for La₂O₃, forms LaAlO₃ at interface to inhibit alumina support sintering and stabilize metal particles. |
| Zirconyl Nitrate (ZrO(NO₃)₂·xH₂O) | Precursor for ZrO₂, enhances thermal stability and oxygen mobility, often used in mixed oxides. |
| Cerium Nitrate (Ce(NO₃)₃·6H₂O) | Precursor for CeO₂, provides redox (oxygen storage) capacity to gasify carbon deposits. |
| Urea (NH₂)₂CO | Homogeneous precipitation agent; decomposes upon heating to release OH⁻ slowly, ensuring uniform co-precipitation. |
| Ammonium Carbonate ((NH₄)₂CO₃) | Alternative precipitating agent; decomposes cleanly, reducing cation contamination. |
| Citric Acid (C₆H₈O₇) | Complexing agent for sol-gel or modified precipitation; improves metal ion mixing and lowers calcination temperature. |
| γ-Alumina (γ-Al₂O₃) Support | High-surface-area support; common substrate for impregnation of active phases and stabilizers. |
| Nitric Acid (HNO₃) / Ammonia (NH₄OH) | pH adjustment solutions for precise control during co-precipitation. |
Diagnosing Instability & Optimizing Formulations: A Problem-Solving Approach
Analytical Techniques for Deactivation Analysis (TEM, XPS, TGA, Chemisorption)
Troubleshooting Guides & FAQs
FAQ 1: TEM Analysis Shows Unclear or Aggregated Metal Particles. What Could Be Wrong?
- Answer: This is often due to sample preparation or beam damage.
- Cause A: Improper dispersion of catalyst powder on the TEM grid leads to agglomeration.
- Solution: Use ultrasonic dispersion in ethanol for 15 minutes before drop-casting. Ensure the grid (e.g., lacey carbon) is plasma-cleaned to improve hydrophilicity.
- Cause B: Excessive electron beam current causing particle sintering or support damage.
- Solution: Use a low-dose imaging protocol. Start with a defocused beam and shift to area of interest. Use faster acquisition times or a lower acceleration voltage (e.g., 80 kV instead of 200 kV) if possible.
- Cause A: Improper dispersion of catalyst powder on the TEM grid leads to agglomeration.
FAQ 2: XPS Reveals Unexpected Carbon or Silicon Contamination on Catalyst Surface. How to Mitigate?
- Answer: Contamination typically originates from the environment, sample handling, or the reactor system itself.
- Protocol: Implement an in-situ pre-treatment protocol in the XPS preparation chamber. For a reduced metal catalyst, introduce 1 bar H₂ at 300°C for 1 hour, followed by cooling under vacuum (<10⁻⁷ mbar) before analysis. Always use gloves and ceramic tweezers. For reactor-derived samples, ensure the feed gas is purified using appropriate traps (e.g., oxygen/moisture traps for CO/H₂).
FAQ 3: TGA Mass Loss Profile is Noisy or Shows Artifacts. How to Improve Data Fidelity?
- Answer: Noisy data can stem from gas flow irregularities or sample-related issues.
- Checklist:
- Gas Flow: Calibrate mass flow controllers. Ensure total gas flow is stable (typically 50-100 mL/min for a standard instrument). Use a balance gas (e.g., N₂) to maintain constant flow when switching reactive gases.
- Sample Mass: Use an optimal sample mass (5-15 mg). Too much sample can create temperature gradients.
- Crucible: Use identical, clean alumina crucibles for sample and reference. Pre-bake crucibles at 900°C in air to remove contaminants.
- Checklist:
FAQ 4: Chemisorption Pulse Titration Gives Irreproducible Metal Dispersion Values. What Are Key Variables to Control?
- Answer: Inconsistent pre-reduction is the most common cause.
- Detailed Protocol: Implement a strict standardized reduction protocol:
- Load ~100 mg of catalyst (pellet size 180-250 µm).
- Heat to 150°C at 10°C/min in 30 mL/min He, hold for 30 min (moisture removal).
- Switch to 30 mL/min 5% H₂/Ar. Heat to reduction temperature (e.g., 400°C) at 5°C/min, hold for 2 hours.
- Cool in H₂/Ar to adsorption temperature (e.g., 40°C for CO).
- Flush with He for 1 hour to remove physisorbed H₂.
- Critical Step: Ensure the gas switching valve is leak-tight and the thermal conductivity detector (TCD) is stabilized before initiating pulse titration.
- Detailed Protocol: Implement a strict standardized reduction protocol:
Key Experimental Protocols
Protocol 1: Operando TEM Sample Preparation for Deactivation Studies
- Dispersion: Weigh 5 mg of spent catalyst powder.
- Suspension: Add to 10 mL of anhydrous isopropanol in a vial.
- Ultrasonication: Sonicate in a bath sonicator for 20 minutes.
- Deposition: Using a micropipette, deposit 5 µL of suspension onto a Protochip MEMS-based operando TEM chip.
- Drying: Place the chip in a vacuum desiccator for 2 hours.
- Loading: Transfer chip to a dedicated operando TEM holder under an argon glovebox atmosphere.
Protocol 2: XPS Depth Profiling for Coke Deposition Analysis
- Mounting: Secure pressed catalyst pellet on a stainless-steel stub with double-sided conductive carbon tape.
- Initial Survey: Acquire a survey spectrum (0-1100 eV) with pass energy of 160 eV.
- High-Resolution Scans: Acquire high-resolution spectra for C 1s, O 1s, Al 2p (or relevant support), and active metal (e.g., Ni 2p) at pass energy of 40 eV.
- Sputtering: Using an Ar⁺ gun (ion energy: 2 kV, raster area: 2 mm x 2 mm), sputter the surface for 30-second intervals.
- Iterative Analysis: After each sputter interval, repeat step 3. Continue for 5-10 cycles to build a depth profile.
Protocol 3: TGA-MS for Distinguishing Coke Types (Polymeric vs. Graphitic)
- Calibration: Calibrate the mass spectrometer (MS) for m/z signals of interest (e.g., 2 for H₂, 44 for CO₂, 78 for aromatic compounds).
- Sample Loading: Load 10 mg of deactivated catalyst into an alumina crucible.
- Temperature Program:
- Ramp from 30°C to 150°C at 20°C/min in 50 mL/min N₂, hold for 10 min (remove moisture).
- Cool to 50°C.
- Switch to 50 mL/min 10% O₂/He.
- Ramp from 50°C to 900°C at 10°C/min.
- Data Correlation: Simultaneously record weight loss (TGA) and MS ion currents. Low-temperature MS peaks (300-450°C) indicate polymeric/alkyl coke. High-temperature MS peaks (>600°C) indicate graphitic coke.
Protocol 4: H₂ Chemisorption by Static Volumetric Method for Promoter Effect Analysis
- System Leak Check: Evacuate the system to <10⁻⁵ Torr and monitor pressure rise (<5 µTorr/min).
- Sample Reduction: Follow the reduction steps from FAQ 4 (Protocol).
- Adsorption Isotherm: At 40°C, introduce small, calibrated doses of H₂ into the sample cell. Record equilibrium pressure after each dose.
- Extrapolation: Plot volume adsorbed (STP) vs. equilibrium pressure. Extrapolate the linear portion of the isotherm to zero pressure to determine the chemisorbed volume.
- Calculation: Apply the stoichiometry (H:Metal = 1:1 for many metals) to calculate metal dispersion, surface area, and particle size.
Table 1: Characteristic Signatures of Catalyst Deactivation by Technique
| Technique | Deactivation Mode | Key Observable Quantitative Data |
|---|---|---|
| TEM/STEM | Sintering | Mean Particle Size Increase (e.g., from 2.1 ± 0.5 nm to 8.3 ± 2.1 nm). |
| XPS | Poisoning, Oxidation | Surface Atomic Ratio Change (e.g., S/Ni from 0.0 to 0.35; Ni²⁺/Ni⁰ from 0.1 to 3.2). |
| TGA-MS | Coking | Weight Loss % per Coke Type (e.g., 4.2% at 380°C (polymeric), 1.8% at 720°C (graphitic)). |
| Chemisorption | Sintering, Poisoning | Decrease in Active Metal Surface Area (e.g., from 120 m²/gₘₑₜₐₗ to 25 m²/gₘₑₜₐₗ). |
Table 2: Recommended Operating Parameters for Deactivation Analysis
| Technique | Critical Parameter | Recommended Setting for Stability Studies | Purpose |
|---|---|---|---|
| XPS | Sputter Rate (SiO₂ equiv.) | 0.5 - 1.0 nm/min | Controlled depth profiling to map promoter distribution. |
| TGA | Ramp Rate in O₂ | 5-10 °C/min | To separate overlapping coke combustion events. |
| Chemisorption | Adsorption Temperature | 40°C (for CO/H₂ on most metals) | Minimize physisorption and weak chemisorption. |
| TEM | Electron Dose Rate | <100 e⁻/Ų·s | To minimize beam-induced morphological changes. |
Visualizations
Title: Analytical Workflow for Identifying Catalyst Deactivation Modes
Title: Promoter Roles in Mitigating Catalyst Deactivation Pathways
The Scientist's Toolkit: Key Research Reagent Solutions
| Item / Reagent | Primary Function in Deactivation Analysis |
|---|---|
| Lacey Carbon TEM Grids | Provide ultra-thin, perforated support for high-resolution TEM imaging of nanoparticles, minimizing background interference. |
| Certified XPS Reference Materials (e.g., Au, Cu, Ag foils) | For precise binding energy scale calibration and instrument function verification. |
| Ultra-High Purity Gases (H₂, O₂, CO) with In-Line Traps | Ensure contamination-free environments for TGA, chemisorption, and in-situ treatments. |
| Certified Porous Reference Material (e.g., Eurokin Alumina) | For validating the accuracy of chemisorption and BET surface area measurements. |
| Ar⁺ Sputtering Source (for XPS) | Enables depth profiling to study the subsurface distribution of additives and poisons. |
| MEMS-based Operando TEM Chips | Allow real-time observation of catalyst structure under controlled gas and temperature environments. |
| Calibrated Mass Spectrometer (MS) for TGA | Enables evolved gas analysis (EGA) to identify the chemical nature of desorbed or combusted species (e.g., coke types). |
Troubleshooting Guide & FAQ
Q1: Our catalyst shows initial high activity with a new promoter but deactivates rapidly within 10 cycles. What could be the cause and how can we troubleshoot?
A: Rapid deactivation after initial high activity often indicates promoter leaching or structural collapse due to an uneven or excessive promoter loading.
- Primary Cause: The promoter loading protocol may not ensure strong interaction with the catalyst support. A common issue is using an incorrect solvent or pH during impregnation, leading to poor dispersion and weak anchoring.
- Troubleshooting Steps:
- Analyze Spent Catalyst: Perform XPS or ICP-MS on the spent catalyst and the reaction supernatant to check for leaching of the promoter metal.
- Check Dispersion: Use STEM-EDS mapping on the fresh catalyst to verify if promoter distribution is homogeneous.
- Protocol Review: Ensure your impregnation protocol includes a slow drying step (e.g., rotary evaporation) and a subsequent calcination step to fix the promoter onto the support.
- Recommended Action: Reduce the promoter loading by 0.5 wt% increments and introduce a strong electrostatic adsorption (SEA) step during preparation to improve binding.
Q2: How do we systematically determine the optimal loading window for an alkaline earth metal promoter (e.g., Ba) on a supported metal catalyst?
A: Determining the optimal loading requires a designed experiment measuring both activity and stability metrics across a loading range.
- Experimental Protocol:
- Synthesis: Prepare a series of catalysts (e.g., Pt/Al₂O₃) via incipient wetness impregnation with Ba(NO₃)₂ solutions to achieve loadings of 0, 0.5, 1.0, 2.0, and 3.0 wt% Ba.
- Characterization (Fresh): Characterize all samples with BET (surface area), CO chemisorption (active site count), and H₂-TPR (metal-support interaction).
- Activity Test: Run a standard activity test (e.g., CO oxidation at 150°C) to measure initial conversion rate.
- Stability Test: Subject each catalyst to a prolonged stability run (e.g., 100 hours on stream) or accelerated aging (cycles to 500°C in steam/air).
- Characterization (Spent): Analyze spent catalysts via TEM for particle size growth and XRD for phase changes.
- Data Analysis: Plot activity and stability metrics vs. loading to identify the plateau or peak. The optimal load is often at the knee of the curve before stability declines.
Q3: We observe a trade-off: higher promoter loading increases stability but reduces low-temperature activity. Is this inevitable?
A: Not inevitable, but common. The reduction often stems from site-blocking or electronic over-modification. The goal is to find the loading that minimizes activity loss for a maximum stability gain.
- Diagnosis: Perform H₂ or CO chemisorption across your loading series. A sharp drop in accessible metal sites suggests physical blockage. Use XPS to measure binding energy shifts; an extreme shift may indicate excessive electron donation/withdrawal, making adsorbate binding too weak/strong.
- Solution Paths:
- Use a Bimetallic Promoter: A combination of a low level of an electronegative promoter (e.g., Cl) with a stabilizer (e.g., La) can separate the functions.
- Core-Shell Architectures: Consider synthesizing catalysts where the promoter is primarily located at the metal-support interface, not on top of the active metal particles.
Table 1: Effect of Lanthanum (La) Promoter Loading on Pt/Al₂O₃ Catalyst Performance in Steam Reforming
| La Loading (wt%) | Initial Activity (mol/gₚₜ·h) | Activity after 100h (mol/gₚₜ·h) | % Activity Retention | Avg. Pt Particle Size Growth (nm, after test) |
|---|---|---|---|---|
| 0.0 | 5.2 | 2.1 | 40% | 8.2 |
| 0.5 | 5.0 | 3.8 | 76% | 3.5 |
| 1.0 | 4.7 | 4.2 | 89% | 1.9 |
| 2.0 | 3.9 | 3.7 | 95% | 1.1 |
| 3.0 | 2.5 | 2.4 | 96% | 0.8 |
Data illustrates the classic trade-off: optimal balance for activity retention likely between 1.0-2.0 wt% La.
Table 2: Troubleshooting Common Additive/Promoter Issues
| Observed Problem | Likely Root Cause | Diagnostic Tests | Potential Corrective Action |
|---|---|---|---|
| Rapid initial deactivation | Promoter leaching | ICP-MS of reaction filtrate, XPS of spent catalyst | Modify impregnation solvent/pH; use a chelating agent; lower loading. |
| Loss of low-T activity | Active site blockage | Chemisorption (H₂, CO), STEM-EDS mapping | Optimize calcination temperature; switch promoter precursor. |
| No stability improvement | Poor promoter-catalyst interaction | H₂-TPR, EXAFS | Introduce a secondary "anchor" additive; change deposition sequence. |
| Selectivity shift negative | Altered electronic properties | XPS, Model reaction tests (e.g., alkene hydrogenation) | Fine-tune loading in 0.1-0.2 wt% increments. |
Experimental Protocols
Protocol: Strong Electrostatic Adsorption (SEA) for Optimized Promoter Deposition
Objective: To achieve atomic-level dispersion of a metal oxide promoter (e.g., CeO₂) on a high-surface-area support (γ-Al₂O₃) for enhanced thermal stability.
- Support Preparation: Calculate the Point of Zero Charge (PZC) of your γ-Al₂O₃ support via acid-base titration. For Al₂O₃, PZC is typically ~pH 8.
- Solution Preparation: Prepare a 0.01M aqueous solution of the promoter precursor (e.g., Ce(NO₃)₃·6H₂O). Adjust the pH of this solution to 2 units below the PZC of the support (e.g., to pH ~6 for Al₂O₃) using dilute HNO₃. This ensures the precursor is cationic while the support surface is positively charged, maximizing adsorption.
- Adsorption: Add the support to the precursor solution (1g/100mL). Stir vigorously for 2 hours at room temperature.
- Filtration & Washing: Filter the solid and wash with a small volume of DI water (pH adjusted to match adsorption pH) to remove non-adsorbed ions.
- Drying & Calcination: Dry at 80°C for 12 hours, then calcine in static air at 500°C for 4 hours (ramp: 2°C/min).
Protocol: Accelerated Aging Test for Catalyst Stability Screening
- Fresh Catalyst Testing: Measure the initial activity (A₀) of the catalyst under standard test conditions (e.g., 90% conversion temperature for a oxidation reaction).
- Aging Cycle: Subject the catalyst to a harsh environment mimicking long-term deactivation. Example: For an oxidation catalyst, expose it to 10 vol% H₂O in air at 750°C for 24 hours.
- Post-Aging Test: Cool the catalyst to reaction temperature. Measure the activity again (A₁) under identical standard conditions.
- Calculation: Determine the % Activity Retention as (A₁/A₀)*100.
- Characterization: Compare XRD patterns and/or TEM images of fresh and aged samples to correlate activity loss with sintering or phase change.
Diagrams
Title: Decision Tree for Selecting Promoter Type
Title: Strong Electrostatic Adsorption Workflow
The Scientist's Toolkit: Key Research Reagent Solutions
| Item / Reagent | Function & Rationale |
|---|---|
| High-Purity γ-Al₂O₃ Support (Porous) | Standard high-surface-area support material. Its surface chemistry (PZC, OH groups) is well-studied, making it a model system for promoter interaction studies. |
| Rare Earth Precursors (e.g., La(NO₃)₃, Ce(NO₃)₃) | Common sources of structural promoters. Nitrate salts are preferred as they decompose cleanly during calcination to the desired oxide form. |
| Alkaline Earth Precursors (e.g., Ba(CH₃COO)₂) | Acetate salts often provide better dispersion than nitrates for these promoters due to different decomposition pathways. |
| Ammonium Hydroxide & Nitric Acid (TraceMetal Grade) | For precise, contaminant-free pH adjustment during SEA synthesis, crucial for reproducible adsorption. |
| Tetrachloropalladic Acid (H₂PdCl₄) / Chloroplatinic Acid (H₂PtCl₆) | Standard precious metal catalyst precursors. The chloride ligand can itself act as a temporary promoter/poison, affecting dispersion and requiring careful washing. |
| CHEMISORPTION GASES (5% H₂/Ar, 5% CO/He, Pure O₂) | For quantifying accessible metal sites and studying metal-support interactions via Temperature-Programmed Reduction (TPR) or Oxidation (TPO). |
| ICP-MS Standard Solutions (Multi-Element) | For calibrating instruments to accurately measure promoter and active metal content in solids and leachates, essential for mass balance and leaching studies. |
Troubleshooting Guides & FAQs
FAQ 1: Why is my catalyst's activity decreasing over time, even under inert conditions? This is a classic symptom of catalyst leaching. The active metal complex is likely dissociating from its ligand or decomposing into inactive or precipitated species, removing it from the catalytic cycle. Check for color changes or precipitation in your reaction mixture.
FAQ 2: How can I quickly test if leaching is responsible for my low catalytic turnover numbers (TONs)? Perform a hot filtration test. Remove the catalyst from the reaction mixture by filtration or centrifugation at reaction temperature. Continue to heat the filtrate (now devoid of the solid catalyst or any supported species). If the reaction ceases or slows dramatically, the catalysis was likely truly homogeneous. If it continues, active metal has leached into solution, indicating a stability failure.
FAQ 3: My ligand is expensive. What are the first-line strategies to prevent metal leaching? The primary strategy is ligand design and modification.
- Bite Angle & Chelation: Increase the number of donor atoms (e.g., switch from PPh3 to a bidentate ligand like DPPF). Multidentate ligands provide a stronger, more entropically-favored binding to the metal center.
- Steric & Electronic Tuning: Incorporate bulky substituents (e.g., t-Bu groups on phosphines) to protect the metal center and modify electronic properties to strengthen the metal-ligand bond.
- Use of Additives/Promoters: Introducing simple additives can be a quick fix. See Table 1 for common stability-enhancing additives.
FAQ 4: What are the best analytical techniques to confirm and quantify metal leaching?
- Inductively Coupled Plasma Mass Spectrometry (ICP-MS): The gold standard for quantifying trace metal content in post-reaction solutions and products.
- X-ray Absorption Spectroscopy (XAS): Can probe the oxidation state and local coordination environment of the metal before and after reaction, identifying decomposition pathways.
- UV-Vis Spectroscopy: Useful for tracking changes in the catalyst's electronic structure over time if the complex has characteristic absorbances.
Detailed Experimental Protocols
Protocol 1: Hot Filtration Test for Leaching Objective: To determine if observed catalysis is due to the soluble homogeneous complex or leached metal species.
- Set up your standard catalytic reaction in an appropriate vessel.
- Allow the reaction to proceed to approximately 20-50% conversion.
- Critically: Maintain reaction temperature. Using an air-free technique, rapidly filter the reaction mixture through a pre-heated (to reaction temp) syringe filter (e.g., 0.2 µm PTFE) or centrifuge to remove all solid catalyst/support.
- Immediately return the clear filtrate/supernatant to the heated reaction environment.
- Monitor reaction progress (e.g., by GC, NMR) over time and compare the rate before and after filtration.
- Analysis: A continued reaction post-filtration indicates significant leaching.
Protocol 2: Screening Additives for Catalyst Stabilization Objective: To evaluate the effect of various additives on catalyst lifetime and leaching.
- Prepare a stock solution of your catalyst in the desired solvent.
- In a series of parallel reaction vials (e.g., for a 96-well plate or carousel), add identical amounts of substrate and solvent.
- To each vial, add a different potential stabilizing additive (see Table 1). Include one control vial with no additive.
- Initiate all reactions simultaneously by adding a precise aliquot of the catalyst stock solution.
- Monitor conversion vs. time for each vial under identical conditions (temp, stirring).
- Analyze the final reaction mixtures by ICP-MS to measure metal content in the product/solution phase.
- Key Metrics: Compare final TON, reaction rate profile, and residual metal in solution.
Data Presentation
Table 1: Common Additives and Promoters for Mitigating Leaching in Homogeneous Catalysis
| Additive Class | Example Compounds | Proposed Function for Stability | Typical Loading (mol% vs. metal) | Potential Drawbacks |
|---|---|---|---|---|
| Lewis Acids | Al(OTf)₃, Zn(OTf)₂, B(C₆F₅)₃ | Bind to ligand heteroatoms, increasing electron density at metal and strengthening M-L bond; can activate substrates. | 10-100% | May promote side reactions; can be sensitive to water. |
| Halide Salts | LiCl, NaCl, NBu₄Br | Provide halide anions that can occupy vacant sites, preventing dimerization or decomposition. | 5-20% | Can inhibit oxidative addition/reductive elimination steps in cross-coupling. |
| Oxidants / Reductants | Benzoquinone, MnO₂, H₂ | Maintain metal in the correct oxidation state; re-oxidize leached metal to active species. | 1-10% | Can over-oxidize/reduce catalyst or substrate. |
| Ionic Liquids | [BMIM][PF₆], [BMIM][NTf₂] | Non-coordinating but polar medium; can enhance solubility and stabilize charged intermediates. | Often as solvent | Viscosity can limit mass transfer; purification challenges. |
| Heteroatom Donors | Thiophene, DMSO, Tetraethylammonium iodide | Weakly coordinate to metal, stabilizing unsaturated intermediates (often used in Pd catalysis). | 1-5% | Can act as catalyst poisons if binding is too strong. |
Table 2: Quantitative Leaching Analysis via ICP-MS for a Model Suzuki-Miyaura Catalyst Conditions: Pd/XPhos catalyst, 80°C, 24h reaction.
| Stabilization Strategy | Final Conversion (%) | Pd in Product (ppm) | Pd in Solution (ppm) | Total Pd Recovered vs. Loaded (%) |
|---|---|---|---|---|
| No additive (Control) | 99 | 350 | 150 | 98 |
| + 10 mol% LiCl | 99 | 45 | 22 | 99 |
| + 20 mol% B(C₆F₅)₃ | 95 | 15 | 8 | 102 |
| + 5 mol% Benzoquinone | 98 | 120 | 65 | 101 |
| Chelating Ligand (DPPF) | 99 | <5 | <5 | 95 |
Diagrams
Diagram Title: Catalyst Deactivation & Leaching Pathways
Diagram Title: Leaching Diagnosis & Stabilization Workflow
The Scientist's Toolkit: Research Reagent Solutions
| Reagent / Material | Primary Function in Leaching Mitigation |
|---|---|
| Bidentate Phosphine Ligands (e.g., DPPF, XantPhos) | Provide chelating effect, drastically reducing metal dissociation rates compared to monodentate ligands. |
| Lewis Acid Additives (e.g., B(C₆F₅)₃, Al(OTf)₃) | Act as "Lewis acid promoters" to tune electron density at the metal center and stabilize the catalytic complex. |
| Ionic Liquids (e.g., [BMIM][PF₆]) | Serve as non-coordinating, polar reaction media that can trap and stabilize charged intermediates, reducing decomposition pathways. |
| Halide Salts (e.g., Tetrabutylammonium Bromide) | Source of halide ions to occupy vacant coordination sites on the metal, preventing dimerization or unwanted ligand loss. |
| ICP-MS Standard Solutions | Critical for accurate quantification of trace metal leaching into products and reaction streams. |
| 0.2 µm PTFE Syringe Filters (Pre-heated) | Essential for performing conclusive hot filtration tests to distinguish homogeneous from leached catalysis. |
| Air-Free Equipment (Schlenk line, Glovebox) | Required for handling sensitive catalysts and additives, especially those prone to oxidation which can accelerate leaching. |
Troubleshooting Guides & FAQs
Q1: After high-temperature calcination (>800°C) to form a protective alumina layer, our catalyst shows a severe loss in Brunauer-Emmett-Teller (BET) surface area. What is the cause and how can we mitigate this? A1: Excessive sintering is the primary cause. While calcination forms the protective layer, uncontrolled grain growth collapses micropores. Mitigation Protocol: Implement a step-wise calcination profile. Ramp at 2°C/min to 500°C, hold for 2 hours to remove templating agents, then ramp at 1°C/min to the target temperature (e.g., 850°C). Introduce a dopant like 1-2 wt% La₂O₃ or SiO₂ into the alumina precursor solution; these act as diffusion barriers for alumina ions, inhibiting sintering. Ensure the furnace atmosphere is dry air (dew point < -40°C) to prevent steam-induced sintering.
Q2: Our protective zirconia layer, deposited via atomic layer deposition (ALD), is cracking and delaminating during thermal cycling (400°C 900°C). How can adhesion be improved? A2: Cracking is due to coefficient of thermal expansion (CTE) mismatch and weak interfacial bonding. Solution Protocol: 1) Create a graded interface. Perform 5-10 ALD cycles of Al₂O₃ on the catalyst core before ZrO₂ deposition. Al₂O₃ bonds well to many oxide surfaces and has an intermediate CTE. 2) Optimize ALD Parameters: Use a higher pulsing temperature (e.g., 250°C vs. 150°C) for the zirconia precursor (e.g., Tetrakis(dimethylamido)zirconium) to ensure complete reaction and denser film. Characterize adhesion using in-situ spectroscopic ellipsometry during a temperature ramp.
Q3: When using ceria-zirconia as a promoter for oxygen storage, its performance degrades after prolonged exposure at 1000°C. What is the mechanism and how can we stabilize it? A3: Degradation is caused by phase segregation (CeO₂ and ZrO₂ separating) and the collapse of the cubic fluorite structure into less active tetragonal/monoclinic phases. Stabilization Protocol: Incorporate a trivalent cation dopant via co-precipitation. Prepare a solution of Ce(NO₃)₃, ZrO(NO₃)₂, and Y(NO₃)₃ or Gd(NO₃)₃. The optimal dopant concentration is 10-20 at%. Co-precipitate with NH₄OH at pH 10, then age, filter, and calcine at 700°C. The Y³⁺ or Gd³⁺ ion creates oxygen vacancies and strains the lattice, inhibiting phase separation up to 1100°C.
Q4: During the synthesis of a core@shell (Catalyst@Protective-layer) structure, we are getting inhomogeneous, island-like coating instead of a uniform layer. What are the critical parameters to control? A4: This is typically due to poor wettability and heterogeneous surface charge on the catalyst core. Optimization Protocol: 1) Surface Functionalization: Treat the catalyst cores with a 0.1 M citric acid solution for 1 hour. Rinse and re-disperse in deionized water at pH 8. This creates a negatively charged, hydrophilic surface. 2) Controlled Hydrolysis: For sol-gel coating (e.g., SiO₂), use a slow hydrolysis agent like urea. Mix catalyst dispersion, tetraethyl orthosilicate (TEOS), and urea (molar ratio TEOS:Urea = 1:10). Heat to 90°C for 4 hours. Urea slowly decomposes to raise pH homogeneously, enabling uniform SiO₂ deposition.
Table 1: Effect of Calcination Parameters on Protective Alumina Layer & Catalyst Properties
| Calcination Temp. (°C) | Ramp Rate (°C/min) | Dopant (2 wt%) | BET SA Retention (%) | Crystallite Size (nm) |
|---|---|---|---|---|
| 750 | 5 | None | 85 | 12 |
| 900 | 5 | None | 45 | 35 |
| 900 | 1 | La₂O₃ | 72 | 18 |
| 900 | Step-wise* | SiO₂ | 78 | 16 |
*Step-wise: 2°C/min to 500°C, hold 2h, then 1°C/min to 900°C.
Table 2: Performance of Doped Ceria-Zirconia Promoters After Aging at 1000°C for 24h
| Promoter Composition | Dopant (15 at%) | Oxygen Storage Capacity (μmol O₂/g) @ 600°C | Primary Crystal Phase Post-Aging |
|---|---|---|---|
| Ce₀.₆Zr₀.₄O₂ | None | 125 | Tetragonal + Cubic |
| Ce₀.₆Zr₀.₄O₂ | Y³⁺ | 380 | Cubic Fluorite |
| Ce₀.₆Zr₀.₄O₂ | Gd³⁺ | 405 | Cubic Fluorite |
Experimental Protocol: Synthesis of a La-Stabilized γ-Al₂O₃ Protective Layer via Sol-Gel
Objective: To coat catalyst particles with a sinter-resistant, high-temperature stable alumina layer.
- Precursor Solution: Dissolve 5g of aluminum sec-butoxide in 50ml of 2-butanol at 60°C under reflux. Separately, dissolve 0.1g of La(NO₃)₃·6H₂O (for 2 wt% La) in 5ml of deionized water.
- Catalyst Dispersion: Disperse 2g of dry catalyst powder in 30ml of 2-butanol using an ultrasonic probe for 15 minutes.
- Coating: Under vigorous mechanical stirring, add the La-doped aqueous solution dropwise (0.5 ml/min) to the catalyst dispersion. Maintain temperature at 60°C.
- Hydrolysis & Aging: After addition, continue stirring for 18 hours (aging). The hydrolysis of alkoxide forms a La-doped boehmite gel on the catalyst surface.
- Drying & Calcination: Filter, wash with ethanol, and dry at 100°C for 12h. Calcinate using the step-wise protocol (see Table 1) to convert boehmite to La-stabilized γ-Al₂O₃.
Diagrams
The Scientist's Toolkit: Research Reagent Solutions
Table 3: Essential Materials for Thermal Stability Enhancement Experiments
| Reagent/Material | Primary Function | Key Consideration for Stability |
|---|---|---|
| Aluminum sec-butoxide (Al(OBu)₃) | Precursor for sol-gel synthesis of alumina protective layers. | Highly moisture-sensitive. Use in dry N₂ glovebox. |
| Tetraethyl orthosilicate (TEOS) | Precursor for silica coatings via Stöber process or ALD. | Hydrolysis rate controlled by pH/temperature. |
| Zirconium(IV) acetylacetonate (Zr(acac)₄) | ALD or CVD precursor for zirconia films. | Offers good volatility and moderate decomposition temperature. |
| Lanthanum(III) nitrate hexahydrate | Dopant for stabilizing alumina and ceria-zirconia phases. | Adding >3 wt% can form segregated LaAlO₃ phases. |
| Yttrium(III) nitrate hexahydrate | Dopant for stabilizing the cubic phase of zirconia and ceria. | Optimal doping level is typically 8-20 atomic %. |
| Urea (NH₂)₂CO | Used as a slow, homogeneous hydrolysis agent for sol-gel coatings. | Prevents local high pH that causes uneven precipitation. |
| Citric Acid Monohydrate | Surface modifier to create negative charge on catalyst cores for better wetting. | Concentration and treatment time must be optimized per core material. |
Design of Experiments (DoE) for Systematic Catalyst Formulation Optimization
Technical Support Center: Troubleshooting & FAQs
Q1: During a Plackett-Burman screening DoE, I observe unusually high variance in the measured conversion rate for identical catalyst formulations. What could be the cause and how can I resolve it? A: High variance in replicates often points to inadequate control of synthesis or testing conditions. For catalyst stability studies involving promoters, ensure precise control of:
- Precipitation/Impregnation pH and Temperature: Fluctuations here cause inconsistent active phase dispersion. Protocol: Use a jacketed reactor with a calibrated pH probe and automated titrant addition. Maintain temperature ±0.5 °C.
- Calcination Ramp Rate: Inconsistent ramp rates lead to varied metal oxide crystallite sizes. Protocol: Program the muffle furnace with a validated ramp rate (e.g., 2°C/min) and include a pre-calibrated independent thermocouple.
- Feedstock Purity: Trace impurities can poison active sites. Solution: Specify and use high-purity precursor salts (e.g., ≥99.99%) from a single batch for an entire DoE block.
Q2: My response surface model from a Central Composite Design (CCD) shows a poor fit (low R² adjusted). How can I improve the model's predictive power for catalyst stability? A: A poor fit often means missing key factors or interactions, especially relevant in additive/promoter research.
- Check for Critical Interactions: Promoter-additive and promoter-calculation temperature interactions are frequently significant. Re-analyze data with all two-factor interactions.
- Consider Transformation of Response: Catalyst deactivation rates often follow logarithmic decays. Try modeling log(Deactivation Rate) or 1/Time to 10% Loss as your response.
- Add Center Points: If not included, add 5-6 replicated experimental runs at the center point of your design to better estimate pure error and curvature. Protocol: Synthesize and test the median promoter loading, additive concentration, and calcination temperature multiple times.
Q3: How do I choose between a Full Factorial and a D-Optimal design when studying multiple promoter additives? A: The choice depends on your goal and resource constraints, as outlined below:
| Design Criterion | Full Factorial (2^k) | D-Optimal Design |
|---|---|---|
| Primary Goal | Estimate all main effects and interactions precisely. | Estimate a specific model (e.g., quadratic) with minimal runs. |
| Best For | Screening 4 or fewer factors when interactions are suspected. | Incorporating process constraints (e.g., promoter A + B ≤ 5% wt.) or when many candidate factors exist. |
| Runs for 5 Factors | 32 runs (2^5) | Can model quadratic terms in ~20-30 runs. |
| Use in Stability Thesis | Ideal for initial screening of 3-4 promoter elements. | Ideal for optimizing loadings of 2-3 selected promoters with known interactions. |
Q4: My accelerated aging test results do not correlate with long-term stability performance. Is my DoE invalid? A: Not necessarily, but your aging stressor may not be representative. For additives targeting thermal sintering, ensure your accelerated test (e.g., high-temperature treatment in steam) shares the same deactivation mechanism as long-term, lower-temperature operation. Protocol for Validation: Run a pilot DoE with both accelerated (e.g., 24h at 800°C, 20% steam) and real-time (500h at 550°C) aging on a subset of formulations. Check if the rank ordering of catalyst stability is preserved. Use a correlation plot to validate the stressor.
Key Experimental Protocols
Protocol 1: High-Throughput Impregnation for Promoter Screening DoE
Objective: To prepare a library of catalyst samples with varying promoter/additive compositions as specified by a screening design matrix.
- Solution Preparation: Calculate volumes of aqueous precursor stock solutions (e.g., Ce(NO₃)₃, La(NO₃)₃, Mg(NO₃)₂) needed for each design point using DoE software.
- Incipient Wetness Impregnation: Using an automated liquid handler, sequentially add calculated volumes to weighed aliquots of the base catalyst support (e.g., γ-Al₂O₃ pellets) in a 96-well plate reactor block.
- Aging & Drying: Seal the block, let it age at room temperature for 2 hours, then dry at 110°C for 12 hours in a forced-air oven.
- Calcination: Transfer samples to a crucible and calcine in a muffle furnace using a programmed ramp (2°C/min to 550°C, hold for 4 hours).
Protocol 2: Accelerated Stability Testing (AST) Protocol
Objective: To rapidly assess the stability of catalyst formulations from a DoE under controlled, severe conditions.
- Reactor Setup: Load 100 mg of sieved catalyst (250-355 μm) into a fixed-bed microreactor.
- Pre-treatment: Activate in situ under 10% O₂/N₂ at 500°C for 1 hour.
- Baseline Activity: Measure initial conversion (%) under standard test conditions (e.g., for CO oxidation: 1% CO, 10% O₂, balance N₂ at GHSV=60,000 h⁻¹, T=300°C).
- Aging Stress: Expose catalyst to aging conditions: e.g., switch feed to 10% H₂O in N₂ and raise temperature to 700°C for 5 hours.
- Post-Test Activity: Cool reactor to standard test temperature and re-measure conversion under identical baseline conditions.
- Response Calculation: Calculate % Activity Retention = (Post-Test Conversion / Initial Conversion) * 100.
Visualizations
Title: DoE Workflow for Catalyst Stability Optimization
Title: Additive Roles in Countering Catalyst Deactivation
The Scientist's Toolkit: Research Reagent Solutions
| Item & Example Specification | Primary Function in Catalyst Stability DoE |
|---|---|
| High-Purity Precursor Salts(e.g., RhCl₃·xH₂O, 99.99% trace metals basis) | Provides the active metal phase. Purity is critical to avoid confounding effects from impurities that accelerate sintering or poisoning. |
| Promoter Stock Solutions(e.g., 1.0 M aqueous (NH₄)₆Mo₇O₂₄) | Enables precise, volumetric addition of promoter elements during impregnation as per DoE weight loading specifications. |
| Structural Stabilizer Additive(e.g., Barium Nitrate, Ba(NO₃)₂, 99.999%) | Forms a surface or bulk compound (e.g., BaAl₂O₄) to inhibit support phase transition and active particle coalescence. |
| Refractory Catalyst Support(e.g., γ-Al₂O₃ spheres, S.A. 150 m²/g, 3mm dia) | Provides a high-surface-area, thermally stable base for depositing active components. Batch uniformity is essential for DoE. |
| Calibration Gas Mixture(e.g., 5000 ppm SO₂ in N₂, NIST-traceable) | Used in controlled poisoning studies or as a process variable to test promoter efficacy against specific chemical deactivation. |
| Thermogravimetric Analysis (TGA) Standards(e.g., Curie point standards: Nickel, Perkalloy) | Validates temperature calibration in TGA/DSC, essential for accurate characterization of coke burn-off or promoter decomposition steps. |
Benchmarking Performance: Validating Stability Gains in Real-World Systems
Accelerated Aging Tests & Lifetime Prediction Models
Technical Support & Troubleshooting Center
Q1: During an accelerated thermal aging test of my promoted catalyst, the deactivation rate is unexpectedly nonlinear. What could be the cause? A: Nonlinear deactivation under constant elevated temperature often indicates a shift in the dominant deactivation mechanism. Common issues and checks:
- Sintering vs. Poisoning: Initial rapid decay may be due to sintering of catalytic nanoparticles. A subsequent plateau or slower decay could indicate the onset of surface poisoning by feed impurities. Perform post-mortem TEM to compare particle size distribution before and after testing.
- Additive Depletion: Your promoter or stabilizing additive (e.g., CeO₂ for oxygen storage, La for thermal stability) may be chemically consumed or physically segregated over time. Use EDX line scanning on spent catalyst pellets to check for additive distribution.
- Protocol Error: Ensure the accelerated test temperature is not so high that it induces an artifact mechanism (e.g., support collapse) not seen under real conditions. Validate by checking if the Arrhenius plot (ln(k_d) vs. 1/T) is linear across your test temperatures.
Q2: My lifetime prediction model, based on accelerated stress tests, overestimates the catalyst's stability in the real operating environment. Why? A: This is a common pitfall. The discrepancy usually arises from an incomplete stress factor matrix in your accelerated tests.
- Missing Stress Factors: Real-world operation involves simultaneous thermal, chemical, and mechanical stress. Your lab test may have only elevated temperature. Are you also cycling the feed composition (e.g., wet/dry, redox cycles) to simulate real feedstock variations?
- Incorrect Acceleration Factor: The activation energy (Ea) for deactivation used in your Arrhenius extrapolation may be wrong if the mechanism changes. Conduct in situ characterization (e.g., XRD, Raman) during aging to confirm the mechanism remains consistent.
- Check Table: Common Discrepancies & Solutions
| Observed Discrepancy | Likely Cause | Corrective Action |
|---|---|---|
| Overestimation of lifetime | Single-stress testing (temp. only) | Implement multi-stress protocols (Temp + Chemical + Pressure). |
| Poor extrapolation accuracy | Incorrect Ea for deactivation | Determine Ea from multiple mechanisms via TGA/DSC of spent samples. |
| Model fails for new catalyst batch | Variability in additive dispersion | Standardize synthesis protocol; use N₂ physisorption & chemisorption for batch QA. |
Q3: How do I design an accelerated aging protocol that accurately reflects long-term, low-temperature catalytic poisoning? A: For mechanisms like chemisorption poisoning, directly accelerating with temperature can be invalid. Use a concentration-based acceleration method.
- Protocol: Accelerated Poisoning Test
- Identify Poison: Determine the primary poison in the feed (e.g., S, Cl, As species).
- Baseline Kinetics: At real operating temperature (Top), measure catalyst activity (k) as a function of poison concentration [P] to establish a deactivation rate law.
- Accelerated Test: Maintain Top but increase the poison concentration [P]accel in the feed stream (e.g., 10x typical level).
- Monitor: Track activity decay over time (taccel). Use the established rate law to correlate time at high poison concentration to equivalent time at real-world concentration.
- Validate: Periodically verify the poisoning mechanism (via XPS of spent samples) is identical at both concentrations.
Q4: What are the key material characterization techniques to validate the stability role of an additive post-aging? A: A combinatory approach is necessary to link macro-performance to micro-structural changes.
| Technique | Function & Information Gained |
|---|---|
| HAADF-STEM / EDX Mapping | Visualizes nanoparticle sintering and maps the spatial distribution of promoter/additive elements (e.g., Pt, La, Ce) before/after aging. |
| X-ray Photoelectron Spectroscopy (XPS) | Determines chemical state changes of the active metal and additive surface species (e.g., formation of sulfates, reduction of oxide promoters). |
| CO / H₂ Chemisorption | Measures the change in active metal surface area (dispersion) due to sintering or pore blockage. |
| In Situ XRD/Raman | Tracks phase transitions (e.g., γ-Al₂O₃ to α-Al₂O₃) or carbonate/coke formation in real-time during aging. |
Experimental Protocols
Protocol 1: Standard Accelerated Thermal Aging for Supported Metal Catalysts Objective: To estimate catalyst lifetime under thermal stress.
- Pre-conditioning: Reduce catalyst sample (e.g., 1% Pt/Al₂O₃) in pure H₂ at 300°C for 2 hours.
- Baseline Activity: Measure intrinsic activity (e.g., turnover frequency for a probe reaction like CO oxidation) at your standard operating temperature (e.g., 200°C).
- Aging Stress: Subject the catalyst to a flowing inert gas (N₂) or a simulated lean/redox gas mixture at a significantly higher temperature (e.g., 750°C vs. a real op. temp of 550°C) for a defined period (e.g., 10-100 hrs).
- Intermittent Testing: Cool periodically to the standard operating temperature (200°C) under inert gas to re-measure activity.
- Data Fitting: Plot remaining activity (%) vs. aging time. Fit to a deactivation model (e.g., separable kinetics: -da/dt = kd * a^n). Use the model and an assumed activation energy for deactivation (Ead) to extrapolate to real operating temperature.
Protocol 2: Multi-Stress Aging (Thermal + Chemical) for Promoted Catalysts Objective: To simulate combined thermal and chemical deactivation in, for example, an automotive three-way catalyst with Ce/Zr promoters.
- Aging Reactor Setup: Use a fixed-bed reactor with precise temperature and gas composition control.
- Cyclic Aging Protocol:
- Lean Phase (60s): Expose catalyst to a flow of 10% O₂, 5% H₂O, balance N₂ at 850°C.
- Rich Phase (60s): Switch to a flow of 2% CO, 5% H₂O, balance N₂ at the same temperature.
- Duration: Perform cycles for a total of 50-100 hours.
- Post-mortem Analysis: Characterize spent catalyst for: (i) Metal sintering (TEM), (ii) Oxygen Storage Capacity (OSC) loss (to assess Ce/Zr promoter degradation), and (iii) Phase stability of the alumina support (XRD).
Visualizations
Diagram Title: Lifetime Prediction Workflow from AST Data
Diagram Title: Deactivation Mechanisms & Additive Mitigation
The Scientist's Toolkit: Research Reagent Solutions
| Material / Reagent | Function in Stability Research |
|---|---|
| CeO₂-ZrO₂ Mixed Oxides | Oxygen storage/release promoters that buffer redox fluctuations, preventing oxidation/deactivation of active metals (e.g., Pt, Pd). |
| Lanthanum Nitrate (La(NO₃)₃) | Precursor for La³⁺ dopant. Stabilizes γ-Al₂O₃ support against high-temperature phase transition to α-Al₂O₃, preserving surface area. |
| Chloroplatinic Acid (H₂PtCl₆) | Standard precursor for depositing platinum nanoparticles. Used to create model catalysts for fundamental aging studies. |
| Simulated Poison Feedstock (e.g., Thiophene, SO₂ gas) | Controlled poison sources for accelerated chemical aging tests to study resistance of promoted catalysts. |
| Thermogravimetric Analysis (TGA) Calibration Standards | Essential for validating weight change (coke burn-off, oxidation) measurements during in situ aging studies. |
Technical Support Center: Troubleshooting & FAQs
This technical support center is designed within the context of research on additives and promoters for enhanced catalyst stability. Below are common experimental issues, their solutions, and key resources.
Frequently Asked Questions (FAQs)
Q1: We observe a rapid decline in conversion yield after 3 cycles with our unstabilized heterogeneous catalyst in a hydrogenation model reaction. What could be the cause? A1: Rapid deactivation is often due to metal leaching, sintering, or coke formation. For unstabilized catalysts, sintering—where nanoparticles agglomerate at high temperature—is a primary culprit. Consider introducing a structural promoter like ceria (CeO₂) or alumina (Al₂O₃) as a stabilizer. These additives act as physical barriers, inhibiting nanoparticle coalescence.
Q2: Our stabilized catalyst shows excellent stability but unexpectedly low initial activity in a Suzuki-Miyaura cross-coupling reaction. How can we address this? A2: This trade-off is common. Stabilizers can sometimes block active sites. Ensure your promoter (e.g., a nitrogen-doped carbon layer) is applied via a controlled deposition method like atomic layer deposition (ALD) to form an ultrathin, porous layer. Alternatively, use a catalytic promoter like a low-concentration Lewis acid (e.g., B(OMe)₃) to enhance the intrinsic activity of the remaining accessible sites without compromising long-term stability.
Q3: During accelerated aging tests, how do we differentiate between chemical poisoning and thermal degradation? A3: Run parallel controlled experiments. For suspected chemical poisoning, perform X-ray photoelectron spectroscopy (XPS) on spent catalyst to identify surface contaminants (e.g., S, Cl). For thermal degradation, use Transmission Electron Microscopy (TEM) to compare fresh and aged samples for particle size growth (sintering). Temperature-programmed oxidation (TPO) can quantify coke deposition.
Q4: What is the best method to quantify metal leaching in a liquid-phase model reaction using a stabilized Pd catalyst? A4: Post-reaction, separate the catalyst via centrifugation or filtration (0.22 µm membrane). Analyze the clear filtrate using Inductively Coupled Plasma Mass Spectrometry (ICP-MS). Compare leached metal concentration to a control experiment with an unstabilized catalyst. A proper stabilizer (e.g., a metal-organic framework coating) should reduce leaching by >90%.
Troubleshooting Guide
| Symptom | Possible Cause | Diagnostic Test | Recommended Solution |
|---|---|---|---|
| Gradual activity loss over cycles | Sintering, Coke deposition | TEM, TPO | Introduce a structural promoter (e.g., MgO) to inhibit particle migration. |
| Sudden, complete loss of activity | Catalyst poisoning, Severe leaching | XPS, ICP-MS of reaction medium | Pre-treat reagents to remove impurities (e.g., sulfur compounds); Use a chelating stabilizer. |
| High initial activity, then rapid decay | Leaching of active species | ICP-MS after 1st cycle | Switch to a catalyst with strong metal-support interaction (SMSI) stabilizer like TiO₂. |
| Stable but low activity | Over-stabilization blocking sites | Chemisorption (e.g., H₂ pulse) | Optimize stabilizer thickness/coverage; Use a promotional additive (e.g., K⁺ ions). |
| Irreproducible results between batches | Inconsistent stabilizer loading | Elemental Analysis (EA), BET surface area | Standardize synthesis protocol; Use precise deposition techniques (e.g., incipient wetness impregnation). |
Table 1: Performance in Heck Coupling Model Reaction (72 Hours, T=120°C)
| Catalyst Formulation | Initial TOF (h⁻¹) | Conversion at Cycle 5 (%) | Metal Leaching (ppm) | Avg. Particle Size Growth (nm) |
|---|---|---|---|---|
| Pd/C (Unstabilized) | 12,500 | 45 | 15.2 | +4.5 |
| Pd/C + Polyvinylpyrrolidone (PVP) | 9,800 | 88 | 1.8 | +0.8 |
| Pd/C + Mesoporous SiO₂ Shell | 8,200 | 98 | 0.5 | +0.2 |
| Pd/C + Ionic Liquid Layer [BMIM][PF₆] | 10,100 | 92 | 3.1 | +1.1 |
Table 2: Performance in Continuous Flow Hydrogenation (Model: Nitrobenzene to Aniline)
| Catalyst | Promoter/Additive Type | Time-on-Stream to 10% Yield Drop (h) | Selectivity Maintained >99% (Y/N) | Required Regeneration Temperature |
|---|---|---|---|---|
| Pt/Al₂O₃ (Baseline) | None | 24 | N | 500°C |
| Pt/Al₂O₃ | CeO₂ (Structural Promoter) | 95 | Y | Not required in test window |
| Pt/Al₂O₃ | Sn (Electronic Promoter) | 65 | Y | 400°C |
Experimental Protocols
Protocol 1: Accelerated Aging Test for Sintering Resistance
- Reduce: Reduce 100 mg of 1% Pd/C catalyst under H₂ flow (50 mL/min) at 300°C for 2 hours.
- Age: Subject catalyst to alternating 5% O₂/N₂ and 5% H₂/N₂ flows every 15 minutes at 500°C for 24 hours.
- Characterize: Analyze aged catalyst via TEM. Measure the average particle diameter of 200 particles. Compare to pre-aged sample.
- Test: Evaluate catalytic activity in a standard model reaction (e.g., benzyl alcohol oxidation) and calculate the percentage loss in TOF.
Protocol 2: Quantifying Leaching in Liquid-Phase Reactions
- Reaction: Carry out the model reaction (e.g., Mizoroki-Heck) in a 50 mL Schlenk flask with 50 µmol catalyst, 1 mmol substrate, and 2 mmol base in 10 mL solvent under inert atmosphere.
- Sampling: At reaction completion, cool rapidly to room temperature.
- Separation: Use a syringe filter (PTFE, 0.22 µm) to completely remove all solid catalyst from the reaction mixture.
- Analysis: Dilute 1 mL of filtrate with 3% HNO₃ and analyze via ICP-MS. Quantify against a standard calibration curve for the active metal.
Visualization: Experimental & Conceptual Diagrams
Title: Catalyst Performance Evaluation Workflow
Title: Deactivation Pathways and Stabilization Strategies
The Scientist's Toolkit: Research Reagent Solutions
| Item / Reagent | Primary Function in Catalyst Stability Research |
|---|---|
| Cerium(IV) Oxide (CeO₂) | Structural promoter; enhances thermal stability and oxygen storage capacity, prevents sintering. |
| Polyvinylpyrrolidone (PVP) | Polymeric stabilizer; controls nanoparticle growth during synthesis and provides colloidal stability. |
| 1-Butyl-3-methylimidazolium Hexafluorophosphate ([BMIM][PF₆]) | Ionic liquid coating; creates a protective layer, reduces leaching, and can enhance selectivity. |
| Trimethylaluminum (TMA) / H₂O | Precursors for Atomic Layer Deposition (ALD) of Al₂O₃ overlayers for precise, ultrathin stabilization. |
| Ethylenediaminetetraacetic Acid (EDTA) | Chelating agent; used in post-synthesis washing to remove weakly bound metals, reducing initial leaching. |
| Carbon Black (Vulcan XC-72) | High-surface-area support; provides anchoring sites for metal NPs, improving dispersion and stability. |
| Tetraethylorthosilicate (TEOS) | Precursor for sol-gel synthesis of porous SiO₂ shells around catalysts, preventing aggregation. |
| Triphenylphosphine (PPh₃) | Ligand; modifies electronic environment of metal centers, can improve stability but may reduce activity. |
Technical Support Center
Troubleshooting Guides & FAQs
Q1: During our catalyst stability test with lanthanum oxide (La₂O₃) as an additive, we observe an unexpected initial activity drop before stabilization. What could be the cause? A1: This is often due to a transient surface passivation layer. Verify your pre-treatment protocol.
- Protocol: Ensure the catalyst (e.g., Ni-based) with La₂O₃ additive undergoes a standardized in-situ reduction. Heat to 500°C under 5% H₂/Ar (50 mL/min flow rate) at a ramp of 5°C/min, hold for 2 hours, then cool to reaction temperature under inert gas before introducing reactants.
- Check: Analyze pre- and post-reduction samples via X-ray photoelectron spectroscopy (XPS) to confirm reduction of Ni species and check for La surface migration.
Q2: Our carbon nanotube (CNT)-supported catalyst with nitrogen-dopant additives shows high stability but excessive cost in scale-up projections. How do we assess the trade-off? A2: A lifecycle cost-benefit analysis (LC-CBA) framework specific to research-scale catalytic processes is required.
- Protocol: 1) Inventory: Quantify all material/energy inputs for synthesizing 1 gram of catalyst (e.g., precursor costs, CNT purification energy, NH₃ flow for doping). 2) Stability Metric: Calculate cost per hour of stable operation (e.g., $/hour with <10% activity loss) versus un-doped catalyst. 3) Environmental Proxy: Use solvent and energy consumption as proxies for environmental impact. Compare the doped catalyst's extended lifetime against its higher synthesis footprint.
Q3: When testing organic promoter additives (e.g., ionic liquids) for homogeneous catalysis, how do we accurately separate recyclability benefits from simple catalyst leaching? A3: Implement a rigorous hot-filtration test followed by elemental analysis.
- Protocol: 1) Run the catalytic reaction (e.g., coupling reaction) for 30% of completion. 2) Rapidly hot-filter the reaction mixture through a fine porosity membrane (<0.45 µm) under inert atmosphere and reaction temperature. 3) Continue heating the filtrate (now catalyst-free) and monitor for further conversion. 4) Use Inductively Coupled Plasma Mass Spectrometry (ICP-MS) on the filtrate to quantify leached metal (e.g., Pd, Ru) concentration. True promoter-enhanced stability shows <1% further conversion in filtrate and minimal leaching.
Q4: Our environmental impact assessment needs a quantifiable metric for "greenness" when comparing additive options. What is a standard research benchmark? A4: Utilize the simplified E-factor (Environmental Factor) at the benchtop scale. E-factor = mass of total waste (kg) / mass of product (kg). Lower E-factor is better.
- Protocol: For a model reaction (e.g., oxidation using a Co catalyst with and without a stabilizer additive): 1) Record masses of all non-product outputs: spent catalyst, solvents, purification materials, by-products. 2) Isolate and weigh the pure target product. 3) Calculate E-factor for the system with additive vs. without, factoring in the additive's own mass and any change in product yield or purification steps.
Data Presentation
Table 1: Cost-Benefit Comparison of Selected Additives for a Model Hydrogenation Catalyst (Per 1 kg Catalyst Batch)
| Additive Type | Example | Conc. (wt%) | Synthesis Cost Increase (%) | Avg. Lifetime Increase (%) | Waste Solvent Reduction in Recycling (%) | Net Cost-Benefit Index* |
|---|---|---|---|---|---|---|
| Rare Earth Oxide | La₂O₃ | 2.0 | +45% | +120% | +15% | +0.83 |
| Alkali Metal Salt | K₂CO₃ | 1.5 | +8% | +40% | +5% | +0.32 |
| Carbon Support Dopant | N-doped CNT | (Support) | +220% | +300% | +25% | +0.80 |
| Organic Promoter | Imidazolium Salt | 0.5 | +15% | +60% | -10% | +0.25 |
*Net Cost-Benefit Index: Simplified metric = (Lifetime Increase % / Cost Increase %) + (Waste Reduction % / 100). Higher is better. * Negative value indicates increased solvent use for separation.
Table 2: Environmental Impact Proxy Data for Additive-Enhanced Catalyst Recycling
| Experiment | Catalyst System | Cycles to 50% Activity Loss | Total Organic Waste Generated (L/g product) | Cumulative Energy Demand (MJ/mol product) |
|---|---|---|---|---|
| Control | Pd/Al₂O₃ (no additive) | 5 | 1.25 | 8.7 |
| A | Pd/Al₂O₃ + CeO₂ Additive | 12 | 0.80 | 5.1 |
| B | Pd/La₂O₃-SiO₂ Composite | 18 | 0.65 | 4.3 |
| C | Homogeneous Rh complex + Ionic Liquid | 8* | 1.50 | 9.8 |
*Cycle number limited by gradual promoter decomposition. * Higher waste due to solvent needs for product extraction from ionic liquid phase.
Experimental Protocols
Protocol 1: Accelerated Deactivation Testing for Catalyst with Stabilizing Additives. Objective: Quantify lifetime extension provided by an additive under intensified conditions. Materials: Catalyst powder (with/without additive), tubular quartz reactor, mass flow controllers, online GC, furnace. Method:
- Load 100 mg catalyst (sieved to 150-200 µm) into reactor.
- Activate in-situ under specific gas flow (see Q1 Protocol).
- Initiate reaction under standard conditions (e.g., CO₂ hydrogenation at 220°C, 20 bar).
- After measuring initial conversion, introduce a controlled poison or increase temperature by 30°C to accelerate sintering.
- Monitor key activity/selectivity metrics every 30 minutes.
- Record time (or total reactant processed) until conversion drops to 50% of initial.
- Compare this "time-to-half-activity" between additive-modified and base catalysts.
Protocol 2: Lifecycle Inventory (LCI) for Research-Scale Catalyst Evaluation. Objective: Systematically account for all material/energy flows to enable economic and environmental assessment. Method:
- Define System Boundary: From precursor weighing to spent catalyst disposal after 5 regeneration cycles.
- Mass Balance: For each synthesis, recycling, and regeneration step, record masses of all inputs (precursors, solvents, gases, water) and outputs (product, waste solvents, spent filters, emissions).
- Energy Audit: Record energy consumption (heating mantles, furnaces, stirrers, pumps) in kWh, using a plug-load meter.
- Normalize: Express all inputs and outputs per functional unit, e.g., per gram of final stable product synthesized over the catalyst's total lifetime.
Visualizations
Experimental Workflow for Additive Impact Assessment
Decision Logic for Additive Selection in Catalyst Design
The Scientist's Toolkit: Research Reagent Solutions
Table 3: Essential Materials for Catalyst Additive Stability Research
| Item | Function | Example in Research Context |
|---|---|---|
| High-Purity Metal Oxide Additives | Serve as structural or electronic promoters to inhibit sintering or modify active sites. | La₂O₃ (99.99%), CeO₂ nanopowder; used to stabilize Ni or Co nanoparticles. |
| Doped Carbon Supports | Provide enhanced metal-support interaction (EMSI) and inherent stability under harsh conditions. | Nitrogen-doped Carbon Nanotubes (N-CNTs); improves dispersion and longevity of Pt catalysts in fuel cells. |
| Ionic Liquid Promoters | Act as non-volatile, tunable media in homogeneous catalysis to facilitate catalyst recycling. | 1-Butyl-3-methylimidazolium hexafluorophosphate ([BMIM][PF6]); used to immobilize Rh complexes for hydroformylation. |
| Poison/Dopant Gases | For controlled accelerated aging studies to simulate long-term deactivation. | 1% H₂S in H₂ (for sulfur poisoning tests), 100 ppm HCl in N₂ (for chlorine attack studies). |
| Thermogravimetric Analysis (TGA) Kit | To quantitatively measure carbon deposition (coking) on catalysts with/without anti-coking additives. | Alumina crucibles, calibration weights for analyzing mass change under reaction-mimicking gas flows. |
| ICP-MS Standard Solutions | To calibrate instrument for precise measurement of leached metals in solution, critical for recyclability claims. | Multi-element standard (Pd, Pt, Rh, Ru at 1000 µg/mL in dilute acid) for quantifying catalyst loss. |
Technical Support Center
Troubleshooting Guides & FAQs
Q1: During our hydrogenation of nitroarenes, we observe a rapid initial activity loss with our Ni/SiO₂ catalyst. What could be the cause and how can we mitigate it? A: Rapid initial deactivation is often due to metal sintering or coke formation from strong reactant adsorption. Mitigation strategies include:
- Introducing a Structural Promoter: Add a small amount (1-3 wt%) of La₂O₃ or CeO₂ as a structural promoter. These oxides create physical barriers between Ni particles, inhibiting their migration and coalescence.
- Protocol: Use incipient wetness co-impregnation of Ni(NO₃)₂ and La(NO₃)₃ solutions onto SiO₂, followed by calcination at 450°C for 4h and reduction at 400°C for 3h.
- Adjust Process Conditions: Lower the initial reaction temperature by 20°C to reduce coking kinetics.
Q2: Our promoted Pd/Al₂O₃ catalyst shows excellent stability but unexpectedly high selectivity toward a hydrogenolysis side-product. How can we address this? A: This indicates the promoter (e.g., V₂O₅) may be overly enhancing C-X bond cleavage. To refine selectivity while maintaining stability:
- Optimize Promoter Loading: Reduce the promoter loading by half (e.g., from 2 wt% to 1 wt%) and retest. Use a design of experiments (DoE) approach to find the optimal balance.
- Change Promoter Type: Switch to a selectivity-modifying promoter like MnO, which is known to suppress hydrogenolysis pathways while still stabilizing Pd particles.
- Experimental Verification: Perform a pulse chemisorption experiment to confirm the metallic surface area remains high at the lower promoter loading.
Q3: How can we conclusively determine if a deactivated catalyst has suffered from sintering versus poisoning? A: Implement the following diagnostic experimental protocol:
- Thermogravimetric Analysis (TGA): Weigh the spent catalyst, heat in air to 600°C. A mass loss >5% suggests coke deposition (poisoning).
- Temperature-Programmed Oxidation (TPO): If coke is indicated, run TPO to identify the coke type (amorphous vs. graphitic).
- X-ray Diffraction (XRD): Measure the fresh and spent catalysts. An increase in the primary metal particle size (calculated via the Scherrer equation) confirms sintering.
- Inductively Coupled Plasma Optical Emission Spectroscopy (ICP-OES): Wash the spent catalyst with dilute acid and analyze the wash solution. Detectable amounts of S, Cl, or other heteroatoms indicate leaching or poisoning.
Q4: When testing a new Mo-based sulfide catalyst with Co promotion for hydrodesulfurization, the stability improvement is marginal. What might be wrong with the preparation method? A: The issue likely lies in the sulfidation step. For Co-Mo-S active phase formation:
- Ensure Proper Sulfidation: Use a 10% H₂S/H₂ mixture (not pure H₂) and follow a precise temperature ramp: from room temperature to 350°C at 2°C/min, hold for 4 hours.
- Use the Correct Precursor Order: For optimal promotion, the Co should be deposited onto a pre-formed MoS₂ phase. Try a sequential impregnation (Mo first, calcine, then Co) rather than co-impregnation.
- Characterize the Active Phase: Use High-Resolution Transmission Electron Microscopy (HR-TEM) to confirm the presence of the layered Co-Mo-S structure, not separate Co₉S₈ and MoS₂ crystals.
Table 1: Catalyst Performance in Nitrobenzene Hydrogenation (180°C, 20 bar H₂)
| Catalyst Formulation | Initial TOF (h⁻¹) | TOF after 24h (h⁻¹) | Activity Retention (%) | Primary Deactivation Mode (XRD/TGA) |
|---|---|---|---|---|
| 5% Ni/SiO₂ | 420 | 126 | 30% | Sintering (32nm → 48nm) |
| 5% Ni - 1% La/SiO₂ | 390 | 312 | 80% | Mild Coke (<2 wt%) |
| 5% Ni - 1% Ce/SiO₂ | 375 | 330 | 88% | Minimal Coke (<1 wt%) |
| 5% Pd/Al₂O₃ | 1250 | 875 | 70% | Sulfur Poisoning (0.1 wt% S) |
| 5% Pd - 2% Mn/Al₂O₃ | 1050 | 945 | 90% | No significant change |
Table 2: Effect of Promoter Loading on Co-Mo/Al₂O₃ HDS Catalyst Stability
| Co/(Co+Mo) Atomic Ratio | Initial S-Removal (%) | S-Removal after 100h (%) | MoS₂ Slab Length (nm) - Fresh/Spent |
|---|---|---|---|
| 0.0 (Unpromoted) | 68% | 45% | 3.1 / 5.7 |
| 0.2 | 92% | 87% | 3.5 / 3.8 |
| 0.4 | 94% | 90% | 3.3 / 3.5 |
| 0.6 | 90% | 82% | 4.1 / 6.2 |
Detailed Experimental Protocols
Protocol 1: Evaluation of Promoter Effect on Nickel Sintering Resistance
- Catalyst Preparation: Prepare a series of catalysts via incipient wetness co-impregnation of silica support (SA=500 m²/g) with aqueous solutions of nickel nitrate and promoter nitrate (e.g., La, Ce, Mg). Target 5 wt% Ni and 1 wt% promoter metal.
- Drying & Calcination: Dry at 120°C for 12h, then calcine in static air at 450°C for 4h (ramp: 5°C/min).
- In-Situ Reduction: Load 100mg of catalyst into a tubular reactor. Reduce in flowing 5% H₂/Ar (50 mL/min) by heating to 400°C at 2°C/min and holding for 3h.
- Stability Test: Cool to reaction temperature (180°C). Switch to reactant feed (Nitrobenzene in decane, H₂ pressure 20 bar). Monitor conversion via online GC every hour for 24h.
- Post-Mortem Analysis: Cool under inert, passivate with 1% O₂/Ar. Characterize spent catalysts via XRD (particle size), TGA (coke), and N₂ physisorption (surface area).
Protocol 2: Accelerated Aging Test for Poisoning Resistance
- Baseline Activity: Determine the initial activity of the unpromoted and promoted Pd catalyst for a model reaction (e.g., cyclohexene hydrogenation) at 80°C and 5 bar H₂.
- Intentional Poisoning: Introduce a low, constant concentration of a model poison (e.g., 50 ppm thiophene in the feed) to the reactor inlet.
- Monitoring: Track conversion over time. The time taken to reach 50% of the initial activity is defined as T₅₀.
- Analysis: Compare T₅₀ for different catalysts. A longer T₅₀ indicates superior poisoning resistance imparted by the promoter.
Visualizations
Catalyst Deactivation Diagnostic Decision Tree
Promoter Mechanisms for Enhanced Catalyst Stability
The Scientist's Toolkit: Research Reagent Solutions
| Item / Reagent | Function in Catalyst Stability Research |
|---|---|
| Lanthanum(III) Nitrate Hexahydrate | Precursor for La₂O₃ structural promoter. Inhibits Ni/Pd sintering and improves metal-support interaction. |
| Cerium(III) Nitrate Hexahydrate | Precursor for CeO₂/Ce₂O₃ promoter. Offers redox properties, oxygen storage capacity, and stabilizes noble metal dispersion. |
| Ammonium Heptamolybdate | Standard Mo precursor for preparing MoS₂-based hydrotreating catalysts. |
| Cobalt(II) Nitrate Hexahydrate | Co precursor for forming the Co-Mo-S active phase, promoting HDS activity and stability. |
| Thiophene (≥99%) | Model sulfur-containing poison for accelerated aging tests of hydrogenation catalysts. |
| High-Surface-Area γ-Alumina (200-300 m²/g) | Common catalyst support providing high dispersion for active metals. |
| Tetraamminepalladium(II) Nitrate | Salt for preparing well-dispersed Pd catalysts via wet impregnation. |
| 10% H₂S/H₂ Gas Mixture | Essential sulfiding agent for activating Co-Mo, Ni-Mo, or other sulfide catalysts. |
Technical Support Center: Troubleshooting ML-Driven Catalyst Additive Research
This support center addresses common technical challenges encountered when implementing machine learning (ML) pipelines for the discovery and stability prediction of catalyst additives and promoters.
FAQs & Troubleshooting Guides
Q1: During data pre-processing for my additive property dataset, I encounter a high number of missing values for critical stability metrics (e.g., time-on-stream data). How should I handle this without introducing bias? A: This is common in experimental catalyst stability datasets. Do not use simple mean/median imputation, as it will distort the degradation profiles.
- Recommended Protocol: Implement a two-step filtering and flagging approach.
- Filter: Remove entries where the target stability metric (e.g., conversion rate at T=50hrs) is missing.
- Flag and Impute Features: For missing values in input features (e.g., additive concentration, synthesis temperature), use a model-based imputer like
IterativeImputerfrom scikit-learn, constrained by physical bounds (e.g., concentration ≥0). Create new binary features (e.g.,was_Temp_missing) to flag where imputation occurred, preserving information for the ML model.
- Thesis Context: This ensures your training data for stability prediction reflects real, measurable outcomes while maximizing the use of available experimental feature data.
Q2: My ML model (e.g., Random Forest or GNN) for predicting catalytic stability shows excellent training R² (>0.95) but performs poorly on unseen experimental validation data (R² < 0.3). What are the primary checks? A: This indicates severe overfitting. Follow this diagnostic checklist:
| Check | Action | Rationale |
|---|---|---|
| Data Leakage | Verify no validation/test data was used in scaling or imputation. Use Pipeline and cross_val_score. |
Prevents the model from cheating, a common pitfall in small experimental datasets. |
| Feature Space Size | Compare number of features (n) to data points (m). If n > m, apply feature selection. | High dimensionality with sparse data guarantees overfitting. |
| Domain Shift | Ensure the validation set additives come from the same chemical/process space as the training set (e.g., same promoter family). | The model may not generalize to fundamentally different chemistries. |
| Hyperparameter Tuning | Use Bayesian Optimization or Grid SearchCV to tune regularization parameters (e.g., max_depth, min_samples_leaf for RF). |
Default parameters are often overly complex for scientific data. |
Q3: When using a Variational Autoencoder (VAE) for novel additive design, the generated molecular structures are often invalid or synthetically infeasible. How can I improve this? A: This points to issues in the latent space or decoding process.
- Solution Protocol:
- Representation: Use a robust molecular representation like SELFIES (Self-Referencing Embedded Strings) instead of SMILES in your VAE. SELFIES guarantee 100% syntactic validity.
- Constraint: Add a auxiliary predictor network (a "property predictor") to the VAE loss function. This predictor, trained concurrently, penalizes the VAE for generating molecules predicted to have undesirable properties (e.g., low thermal stability).
- Post-Processing: Integrate the generated structures with a rule-based chemical filter (e.g., using RDKit) to remove molecules with unstable functional groups before proceeding to DFT or experimental validation.
Q4: How can I interpret which additive features my "black-box" model (like a deep neural net) deems most important for stability prediction? A: Use post-hoc model interpretability techniques.
- Recommended Methodology: Apply SHAP (SHapley Additive exPlanations).
- Train your best-performing model (e.g., a gradient boosting model or neural net).
- Use the
KernelExplainerorTreeExplainer(for tree-based models) from the SHAP library on your hold-out test set. - Generate summary plots (e.g., beeswarm plots) to identify global feature importance and dependence plots to understand the directionality of effects (e.g., how increasing a specific promoter concentration impacts predicted lifetime).
- Thesis Context: This transforms model predictions into actionable chemical insights, suggesting which additive properties (e.g., electronegativity, ionic radius, binding energy) most strongly correlate with enhanced stability in your catalyst system.
Experimental Protocol: High-Throughput Validation of ML-Predicted Additives
Objective: To experimentally validate the stability-enhancing potential of additive candidates generated and ranked by an ML pipeline. Workflow:
- Candidate Selection: Select top 20 candidates from ML prediction: 15 from highest stability prediction, 5 from diverse/uncertain regions of the latent space (for model improvement).
- Incipient Wetness Impregnation:
- Prepare aqueous solutions of the promoter metal salts (e.g., nitrates) at calculated concentrations to achieve 1 wt.% loading on the γ-Al₂O₃ support.
- Slowly add solution to the support with continuous mixing.
- Age for 2 hours at room temperature.
- Calcination & Activation:
- Dry impregnated catalysts at 120°C for 12 hours.
- Calcine in static air at 500°C for 4 hours (ramp rate: 5°C/min).
- Reduce in flowing 5% H₂/Ar at 400°C for 2 hours prior to stability testing.
- Accelerated Stability Test:
- Perform reaction in fixed-bed reactor under accelerated deactivation conditions (e.g., higher temperature, presence of trace poisons).
- Monitor conversion (%) of probe reaction (e.g., CO oxidation) via online GC every 30 minutes over 100 hours.
- Define stability metric: T50 = time (hours) for conversion to drop to 50% of initial value.
- Feedback to ML Model: Feed experimental T50 results back into the training dataset to refine the next iteration of the model (active learning loop).
Visualizations
Title: ML-Driven Additive Discovery & Validation Workflow
Title: Experimental Protocol for Catalyst Stability Testing
The Scientist's Toolkit: Key Research Reagent Solutions
| Item | Function/Description | Application in Thesis Research |
|---|---|---|
| γ-Al₂O₃ Support (high surface area) | Provides a stable, porous scaffold for dispersing active catalytic phases and additives. | The base material for all promoted catalyst formulations. |
| Promoter Salt Library (e.g., Ce(NO₃)₃, LaCl₃, ZrO(NO₃)₂) | Precursors for additive/promoter elements to be deposited on the catalyst support. | Source of diversity for ML training data and validation candidates. |
| RDKit or Mordred Software | Open-source cheminformatics toolkits for converting molecular structures into numerical descriptors (features). | Featurization of additive chemical structures for ML model input. |
| SHAP (SHapley Additive exPlanations) Library | Python library to explain output of any ML model by computing feature importance values. | Interpreting model predictions to derive chemical insights for the thesis. |
| Self-Referencing Embedded Strings (SELFIES) | Molecular string representation that guarantees 100% valid chemical structures. | Used in VAEs for generating novel, synthetically plausible additive candidates. |
| Fixed-Bed Microreactor System with Online GC | Bench-scale reactor for performing accelerated catalyst lifetime tests with real-time product analysis. | Generating the key experimental stability metric (T50) for model training and validation. |
Conclusion
The strategic use of additives and promoters represents a powerful, often essential, approach to overcoming catalyst deactivation—a major bottleneck in biomedical research and pharmaceutical manufacturing. As explored, foundational understanding of failure modes informs the methodological selection of structural and electronic stabilizers, while targeted troubleshooting and rigorous comparative validation are required to translate formulations into reliable, high-performance systems. Future directions point toward the intelligent design of multifunctional promoters, the application of AI-driven material discovery, and the tailoring of stabilized catalysts for emerging bioconjugation and continuous-flow pharmaceutical processes. Ultimately, enhancing catalyst stability directly contributes to more sustainable, cost-effective, and reproducible biomedical research, accelerating the path from discovery to clinical application.